R E S E A R C H
Open Access
Temporal variability is a personalized feature of
the human microbiome
Gilberto E Flores
1*†, J Gregory Caporaso
2,3†, Jessica B Henley
4, Jai Ram Rideout
3,5, Daniel Domogala
2, John Chase
2,
Jonathan W Leff
4,6, Yoshiki Vázquez-Baeza
7, Antonio Gonzalez
8, Rob Knight
8,9,10, Robert R Dunn
11and Noah Fierer
4,6*Abstract
Background:It is now apparent that the complex microbial communities found on and in the human body vary across individuals. What has largely been missing from previous studies is an understanding of how these communities vary over time within individuals. To the extent to which it has been considered, it is often assumed that temporal variability is negligible for healthy adults. Here we address this gap in understanding by profiling the forehead, gut (fecal), palm, and tongue microbial communities in 85 adults, weekly over 3 months.
Results:We found that skin (forehead and palm) varied most in the number of taxa present, whereas gut and tongue communities varied more in the relative abundances of taxa. Within each body habitat, there was a wide range of temporal variability across the study population, with some individuals harboring more variable
communities than others. The best predictor of these differences in variability across individuals was microbial diversity; individuals with more diverse gut or tongue communities were more stable in composition than individuals with less diverse communities.
Conclusions:Longitudinal sampling of a relatively large number of individuals allowed us to observe high levels of temporal variability in both diversity and community structure in all body habitats studied. These findings suggest that temporal dynamics may need to be considered when attempting to link changes in microbiome structure to
changes in health status. Furthermore, our findings show that, not only is the composition of an individual’s
microbiome highly personalized, but their degree of temporal variability is also a personalized feature.
Background
The increasing recognition that commensal and mutualistic microorganisms are necessary for many aspects of normal human physiology has altered the traditional pathogen-dominated view of human-bacterial interactions [1,2]. As a result of this paradigm shift, there is a tremendous amount of interest in understanding the factors that influence the diversity, composition, dynamics, and function of human-associated microbial communities. One of the primary objectives is to leverage this understanding in order to manage, restore, and/or exploit our microbial partners in ways that promote human health. However, our current
understanding of how and why these communities vary through time is limited. Previous studies that have charac-terized human associated microbial communities over time have been based on relatively few individuals [3,4], intermit-tent sampling intervals [2,5,6], single body habitats [4,7-10], or focused on disease states [11], leaving us with an incom-plete picture of the range of normal variability in the hu-man microbiome. Only by conducting longitudinal studies of large cohorts of both healthy and diseased hosts can we begin to identify the ecological factors structuring the diver-sity, composition, and dynamics of the human microbiome. Here, we investigated the temporal dynamics of forehead, gut (feces), palm, and tongue microbial communities of 85 college-age adults (Table 1) from three U.S. universities. Samples were self-collected weekly over a 3-month period beginning in January 2012. Bacterial and archaeal commu-nities were characterized using high-throughput sequencing of the variable region 4 (V4) of the 16S rRNA gene [12]. In * Correspondence:[email protected];[email protected]
†Equal contributors
1
Department of Biology, California State University, Northridge, Northridge, CA 91330-8303, USA
4
Cooperative Institute for Research in Environmental Sciences, University of Colorado, Boulder, CO 80309, USA
Full list of author information is available at the end of the article
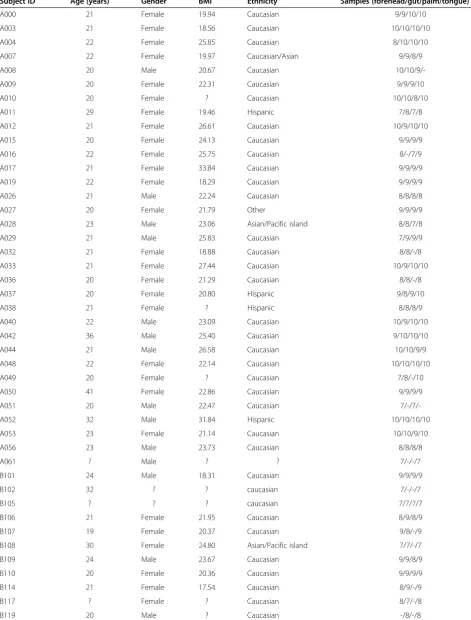
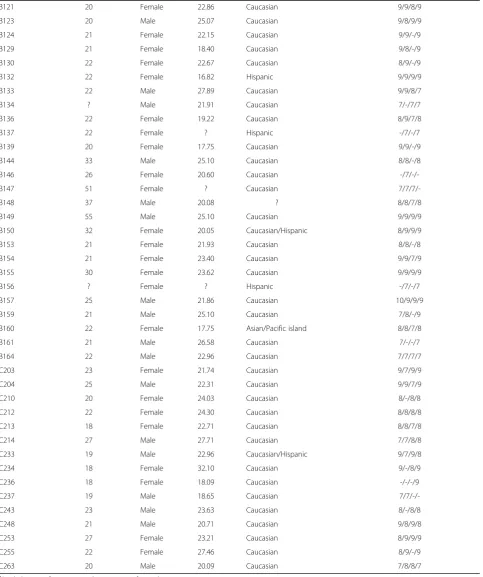
Table 1 Demographic summary of study participants
Subject IDa Age (years) Gender BMI Ethnicity Samples (forehead/gut/palm/tongue) (n)
A000 21 Female 19.94 Caucasian 9/9/10/10
A003 21 Female 18.56 Caucasian 10/10/10/10
A004 22 Female 25.85 Caucasian 8/10/10/10
A007 22 Female 19.97 Caucasian/Asian 9/9/8/9
A008 20 Male 20.67 Caucasian
10/10/9/-A009 20 Female 22.31 Caucasian 9/9/9/10
A010 20 Female ? Caucasian 10/10/8/10
A011 29 Female 19.46 Hispanic 7/8/7/8
A012 21 Female 26.61 Caucasian 10/9/10/10
A015 20 Female 24.13 Caucasian 9/9/9/9
A016 22 Female 25.75 Caucasian 8/-/7/9
A017 21 Female 33.84 Caucasian 9/9/9/9
A019 22 Female 18.29 Caucasian 9/9/9/9
A026 21 Male 22.24 Caucasian 8/8/8/8
A027 20 Female 21.79 Other 9/9/9/9
A028 23 Male 23.06 Asian/Pacific island 8/8/7/8
A029 21 Male 25.83 Caucasian 7/9/9/9
A032 21 Female 18.88 Caucasian 8/8/-/8
A033 21 Female 27.44 Caucasian 10/9/10/10
A036 20 Female 21.29 Caucasian 8/8/-/8
A037 20 Female 20.80 Hispanic 9/8/9/10
A038 21 Female ? Hispanic 8/8/8/9
A040 22 Male 23.09 Caucasian 10/9/10/10
A042 36 Male 25.40 Caucasian 9/10/10/10
A044 21 Male 26.58 Caucasian 10/10/9/9
A048 22 Female 22.14 Caucasian 10/10/10/10
A049 20 Female ? Caucasian 7/8/-/10
A050 41 Female 22.86 Caucasian 9/9/9/9
A051 20 Male 22.47 Caucasian
7/-/7/-A052 32 Male 31.84 Hispanic 10/10/10/10
A053 23 Female 21.14 Caucasian 10/10/9/10
A056 23 Male 23.73 Caucasian 8/8/8/8
A061 ? Male ? ? 7/-/-/7
B101 24 Male 18.31 Caucasian 9/9/9/9
B102 32 ? ? caucasian 7/-/-/7
B105 ? ? ? caucasian 7/7/7/7
B106 21 Female 21.95 Caucasian 8/9/8/9
B107 19 Female 20.37 Caucasian 9/8/-/9
B108 30 Female 24.80 Asian/Pacific island 7/7/-/7
B109 24 Male 23.67 Caucasian 9/9/8/9
B110 20 Female 20.36 Caucasian 9/9/9/9
B114 21 Female 17.54 Caucasian 8/9/-/9
B117 ? Female ? Caucasian 8/7/-/8
Table 1 Demographic summary of study participants(Continued)
B121 20 Female 22.86 Caucasian 9/9/8/9
B123 20 Male 25.07 Caucasian 9/8/9/9
B124 21 Female 22.15 Caucasian 9/9/-/9
B129 21 Female 18.40 Caucasian 9/8/-/9
B130 22 Female 22.67 Caucasian 8/9/-/9
B132 22 Female 16.82 Hispanic 9/9/9/9
B133 22 Male 27.89 Caucasian 9/9/8/7
B134 ? Male 21.91 Caucasian 7/-/7/7
B136 22 Female 19.22 Caucasian 8/9/7/8
B137 22 Female ? Hispanic -/7/-/7
B139 20 Female 17.75 Caucasian 9/9/-/9
B144 33 Male 25.10 Caucasian 8/8/-/8
B146 26 Female 20.60 Caucasian
-/7/-/-B147 51 Female ? Caucasian
7/7/7/-B148 37 Male 20.08 ? 8/8/7/8
B149 55 Male 25.10 Caucasian 9/9/9/9
B150 32 Female 20.05 Caucasian/Hispanic 8/9/9/9
B153 21 Female 21.93 Caucasian 8/8/-/8
B154 21 Female 23.40 Caucasian 9/9/7/9
B155 30 Female 23.62 Caucasian 9/9/9/9
B156 ? Female ? Hispanic -/7/-/7
B157 25 Male 21.86 Caucasian 10/9/9/9
B159 21 Male 25.10 Caucasian 7/8/-/9
B160 22 Female 17.75 Asian/Pacific island 8/8/7/8
B161 21 Male 26.58 Caucasian 7/-/-/7
B164 22 Male 22.96 Caucasian 7/7/7/7
C203 23 Female 21.74 Caucasian 9/7/9/9
C204 25 Male 22.31 Caucasian 9/9/7/9
C210 20 Female 24.03 Caucasian 8/-/8/8
C212 22 Female 24.30 Caucasian 8/8/8/8
C213 18 Female 22.71 Caucasian 8/8/7/8
C214 27 Male 27.71 Caucasian 7/7/8/8
C233 19 Male 22.96 Caucasian/Hispanic 9/7/9/8
C234 18 Female 32.10 Caucasian 9/-/8/9
C236 18 Female 18.09 Caucasian -/-/-/9
C237 19 Male 18.65 Caucasian
7/7/-/-C243 23 Male 23.63 Caucasian 8/-/8/8
C248 21 Male 20.71 Caucasian 9/8/9/8
C253 27 Female 23.21 Caucasian 8/9/9/9
C255 22 Female 27.46 Caucasian 8/9/-/9
C263 20 Male 20.09 Caucasian 7/8/8/7
a
Single-letter prefix represents the university of attendance.
Question marks denote data not provided by study participants. The last column shows the number of samples used in the time series analysis for each body habitat from each subject. Dashes indicate that samples from that individual were not including in the analysis for that particular body habitat. For full metadata, the reader is referred to Additional file3.
total, we generated 170,563,932 quality-filtered sequences from 3,655 samples, with all analyses conducted on samples rarefied to exactly 10,000 sequences per sample. To identify potential drivers of variability, we collected demographic, lifestyle, and hygiene data at the initiation of the sampling period using a standardized 49-question survey (Additional file 1). Weekly questionnaires were used to track changes in health status, medication use, menstrual cycle for women, and other dramatic changes in routine behavior (Additional file 2). De-identified responses to all questions are provided in Additional file 3.
Results and discussion
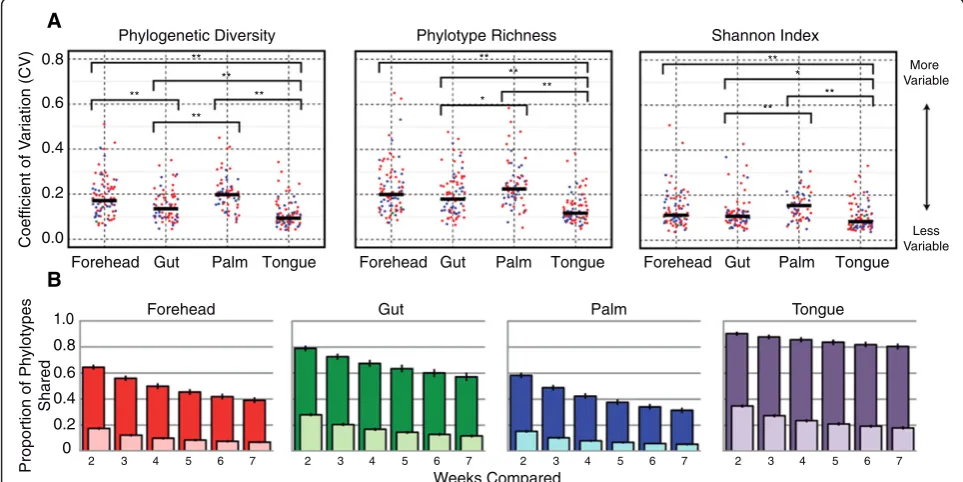
To quantify the amount of temporal variability in diversity of each body habitat, we calculated the coefficient of vari-ation (CV = standard devivari-ation/mean) for three alpha di-versity metrics (phylogenetic didi-versity, phylotype richness, and Shannon index [13]) for each individual [14]. Low CV values indicate that an individual had relatively stable alpha diversity levels, whereas high CV values indicate than an individual had variable levels of alpha diversity over the 3-month study period. As evident in Figure 1a, there was a wide range of variability within each body habitat indicating that some individuals varied more than others. When we compare values across body habitats, we see that skin surfaces, particularly the palm, exhibited
higher levels of temporal variability in diversity than gut or tongue (Figure 1a). These patterns were generally con-sistent regardless of the alpha diversity metric used. Skin surfaces also hosted the most diverse communities we sur-veyed (Additional file 4), as theory would predict for open, exposed environments that have a larger species pool of potential colonizers [15]. Ecological theory also predicts that habitats with large species pools should vary more through time [15], which is what we observed here.
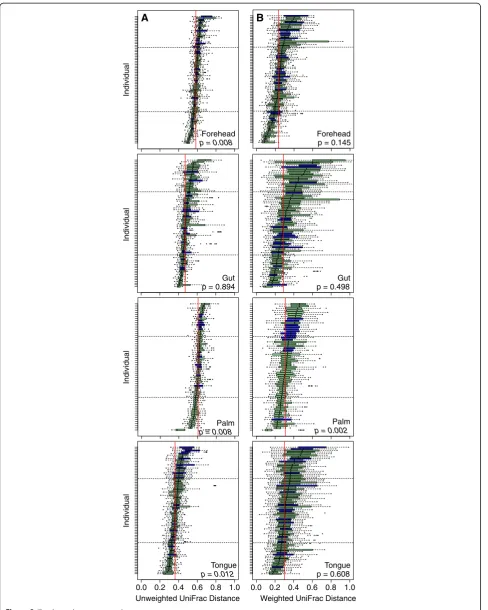
This high degree of temporal variability in alpha diversity levels was matched by high variability (and hence instabil-ity) in community membership (Figure 1b). Comparing the proportion of phylotypes shared among time intervals within an individual shows that fewer phylotypes were shared through time in skin communities than in the gut or tongue communities. For example, on average only 15% of the phylotypes observed on the palm skin surface (excluding singletons on a per individual basis) were ob-served at any other point in time, whether samples were collected 1 or 6 weeks apart. A similar pattern was ob-served when we used median unweighted UniFrac values [16] (a phylogenetic metric of community membership) for each body habitat, where turnover was found to be greater for the skin than for the tongue and gut communities (Figure 2a and Additional file 5a). In contrast, variability in community structure, which accounts for phylotype
0.0 0.2 0.4 0.6 0.8
Forehead Gut Palm Tongue
Phylogenetic Diversity Phylotype Richness Shannon Index
Coef
ficient of V
ariation (CV) ** ** ** ** ** ** ** * ** ** ** More Variable Less Variable !"# $!"# %!"# &!"# '!"# (!!"# # + # & # * # % #) # $ !"# $!"# %!"# &!"# '!"# (!!"# # + # & # * # % #) # $ !"# $!"# %!"# &!"# '!"# (!!"# # & # * # % #) #$ !"# $!"# %!"# &!"# '!"# (!!"# # + # & # * # % #) # $
Proportion of Phylotypes
Shared 0.2 0.4 0.6 0.8 1.0 0 Weeks Compared
2 3 4 5 6 7 2 3 4 5 6 7 2 3 4 5 6 7 2 3 4 5 6 7
e u g n o T m l a P t u G d a e h e r o F d a e h e r o F d a e h e r o
F Gut Palm Tongue Gut Palm Tongue
** *
A
[image:4.595.56.538.421.662.2]B
0.0 0.2 0.4 0.6 0.8 1.0 Unweighted UniFrac Distance
0.0 0.4 1.0
Weighted UniFrac Distance 0.6 0.8 0.2
A B
Forehead
p = 0.008
Gut p = 0.894
Palm
p = 0.008
Tongue
p = 0.012
Forehead p = 0.145
Gut p = 0.498
Palm
p = 0.002
Tongue p = 0.608
Individual Individual
Individual
[image:5.595.57.546.87.698.2]Individual
abundance (median weighted UniFrac), was lower on the forehead than the other body habitats (Figure 2b and Additional file 5b), suggesting that the nature of variability differs depending on the body habitat in question. On the tongue and in the gut, changes in the relative abundance of persistent taxa (that is, those taxa that are consistently present over time) drive the temporal dynamics, whereas temporal variability in forehead communities appears to be driven more by the presence or absence of transient taxa on the skin surface. For the palm, both membership and structure appear highly dynamic, likely due to frequent hand washing and exchange of microbes with the numer-ous surfaces we touch on a daily basis, including our other body parts.
Using median UniFrac values for each individual as our metric of temporal variability in community mem-bership (unweighted) and structure (weighted), we found that individuals differed dramatically not only in the composition of their microbial communities (Additional file 6), as has been observed previously [2,5,17,18], but also in the degree of temporal variability observed in their microbial communities (Figure 2 and Additional file 7). This has been previously shown in vaginal com-munities [8], but we show here that this is a general characteristic of microbial communities across human body habitats. The variability of microbial communities in one body habitat, in general, did not predict the vari-ability of microbial communities of other body habitats. The exception was the two skin habitats, where individ-uals that had more variable forehead communities also had more variable palm communities (Additional files 8 and 9). This finding suggests that the factors that con-tribute to intra-personal temporal variability in micro-biome composition are shared across skin habitats, but not necessarily across other body habitats. Furthermore, relatively few individuals exhibited a significant time-decay relationship [19]; in general, samples collected closer together in time did not harbor more similar communities than those collected further apart in time (Additional file 10). These results highlight that attempts to predict what type of communities to expect in a given body habitat based on data collected during the previous week (or weeks) may be difficult for most individuals. However, it is important to note that if we had sampled more frequently (for example, on a daily basis [3]) or for
a longer period of time, we may have been able to iden-tify a stronger relationship between elapsed time and the composition of the communities within body habitats.
Having established that the degree and nature of vari-ability was specific to each body site and was in itself an important parameter that distinguished individuals from one another, we next sought to identify factors associ-ated with this variation across individuals. Based on pre-vious work [4,20], we expected that antibiotic usage would lead to profound shifts in the structure of an indi-vidual’s microbiome. Indeed, within a given individual, the largest shifts observed in community membership coincided with the time points that the individual re-ported having taken oral antibiotics (P <0.001 for both
unweighted and weighted UniFrac, Monte Carlo t-test
with 1,000 iterations). Across the study population, how-ever, with the exception of palm communities, we did not find a significant effect of antibiotics on variability in community membership and structure; individuals who took antibiotics did not, on average, have more variable communities than those that did not take antibiotics over the time period of this experiment (Figure 2). Our observation that antibiotic use was not associated with increased temporal variability in microbial communities across the study population could be due to the fact that we did not control for the timing of sampling relative to antibiotic use, dosage, or type of antibiotics used by the individuals sampled here, or it may be because microbial community responses to antibiotics are highly individu-alized, as suggested by recent work [4,21].
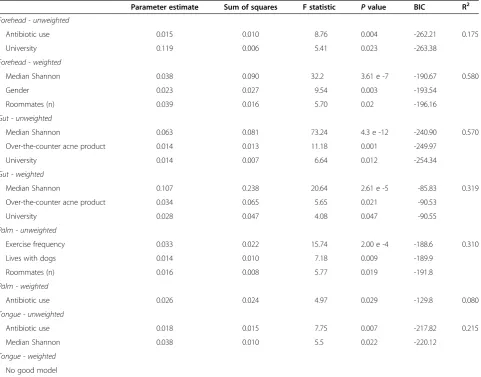
[image:6.595.57.535.90.102.2]We next used generalized linear models (GLMs) to iden-tify which other factors or combination of factors best pre-dicted why some individuals harbored more variable microbial communities than others. For these models, we again used median weighted or unweighted UniFrac values of each individual as our response variables for each body habitat. Potential predictive factors were compiled from the initial survey responses (Additional file 2) and we only in-cluded factors for which we had sufficient replication in survey responses (Additional file 3). Presented models in-cluded factors with a significance value <0.05. As shown in Table 2, our models were often able to explain much of the variability in the temporal stability of microbial communi-ties across individuals, but the strength of the models was dependent on the body habitat in question or the distance (See figure on previous page.)
metric used. Common predictive factors observed in mul-tiple body habitats included median alpha diversity values (Shannon Index), university affiliation, and antibiotic use (Table 2). However, the strongest predictive variable for most body habitats was median diversity, measured using the Shannon index, suggesting an overall relationship be-tween diversity and variability. Other factors appeared to have a body site-specific affect. For example, the number of roommates helped explain a significant amount of variabil-ity in the structure (weighted) of forehead microbial com-munities, a pattern that may driven by the exchange of skin bacteria between individuals sharing a common living area.
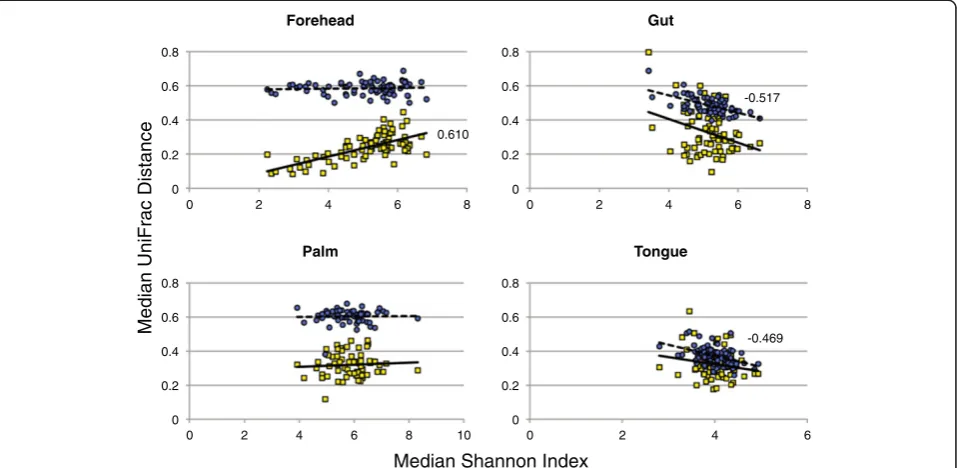
To explore the relationship between diversity and tem-poral variability in greater detail, we generated single-factor linear models using median Shannon index values as our metric of diversity and either median weighted or unweighted UniFrac values as our metric of stability
[image:7.595.59.541.100.477.2](Figure 3). With these models, we observed statistically significant negative correlations between diversity and compositional variability for the gut and tongue commu-nities; individuals with more diverse communities were less variable (more stable) than individuals with less diverse communities. In contrast, a positive relationship was observed between forehead community diversity and structural variability while no relationship was evident for palm communities. Similar directional pat-terns were observed with the other diversity metrics (Additional file 11). Our finding that microbial commu-nities which likely experience lower rates of colonization from external environments (the gut and tongue) exhibit a positive diversity-stability relationship parallels patterns observed in many plant and animal communities where increases in species diversity often result in more stable communities and communities that are more resistant to Table 2 Measured factors that influenced the temporal variability of the human microbiome
Parameter estimate Sum of squares F statistic Pvalue BIC R2
Forehead - unweighted
Antibiotic use 0.015 0.010 8.76 0.004 -262.21 0.175
University 0.119 0.006 5.41 0.023 -263.38
Forehead - weighted
Median Shannon 0.038 0.090 32.2 3.61 e -7 -190.67 0.580
Gender 0.023 0.027 9.54 0.003 -193.54
Roommates (n) 0.039 0.016 5.70 0.02 -196.16
Gut - unweighted
Median Shannon 0.063 0.081 73.24 4.3 e -12 -240.90 0.570
Over-the-counter acne product 0.014 0.013 11.18 0.001 -249.97
University 0.014 0.007 6.64 0.012 -254.34
Gut - weighted
Median Shannon 0.107 0.238 20.64 2.61 e -5 -85.83 0.319
Over-the-counter acne product 0.034 0.065 5.65 0.021 -90.53
University 0.028 0.047 4.08 0.047 -90.55
Palm - unweighted
Exercise frequency 0.033 0.022 15.74 2.00 e -4 -188.6 0.310
Lives with dogs 0.014 0.010 7.18 0.009 -189.9
Roommates (n) 0.016 0.008 5.77 0.019 -191.8
Palm - weighted
Antibiotic use 0.026 0.024 4.97 0.029 -129.8 0.080
Tongue - unweighted
Antibiotic use 0.018 0.015 7.75 0.007 -217.82 0.215
Median Shannon 0.038 0.010 5.5 0.022 -220.12
Tongue - weighted
No good model
Generalized linear models (GLMs) were used to determine which of the measured factors or combination of factors best predicted variability in microbiome membership (unweighted UniFrac) and structure (weighted UniFrac). Unweighted UniFrac distances are a metric of the phylogenetic dissimilarity of samples through time. Weighted UniFrac distances weight dissimilarity both as a function of the phylogenetic dissimilarity and the relative abundance of taxa (such that two samples with the same phylogenetic dissimilarity are considered more different if one is dominated by a particular taxon).
invasions (that is, the portfolio effect) [22]. Although the health implications of the diversity-stability relationships observed here remain undetermined, recent work has shown that gut communities of lower diversity are often associated with disease phenotypes in humans [23].
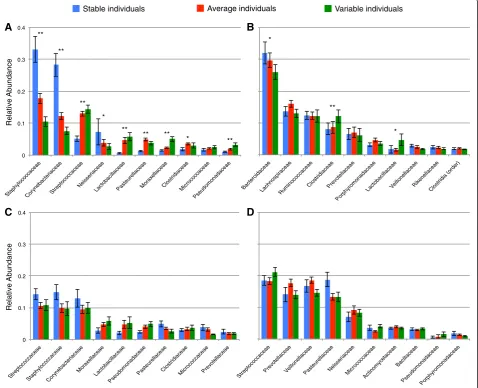
Individuals that had more stable communities harbored taxonomically distinct communities compared with those found in more variable individuals (Figure 4). For ex-ample, individuals with stable forehead communities had
a greater relative abundance of Staphylococcaceae and
Corynebacteriaceae, whereas individuals with highly vari-able forehead communities were enriched in Streptococca-ceae and Lactobacillaceae (Figure 4a). The trade-off between Staphylococcaceaeand Lactobacillaceae is intri-guing because several Lactobacillaceaespecies inhibit at-tachment ofStaphylococcaceae to epithelial cells [24,25]. In the gut, two of the dominant groups of Firmicutes, ClostridiaceaeandLactobacillaceae, were more abundant in variable individuals, whereas the Bacteroidaceae (the dominant family within the Bacteroidetes phylum) were most abundant in stable individuals (Figure 4b). A higher Firmicutes:Bacteriodetes ratio has been observed in guts of obese individuals [26,27], but we did not have enough diversity in body mass index (BMI) to formally test if tem-poral variability may also be associated with obesity. Al-though the mechanisms underlying these patterns remain unclear, these observations highlight the likely importance
of bacterial interactions in determining the stability of human-associated microbial communities.
Conclusions
Our findings suggest that the high degree of temporal variability in alpha diversity levels, community member-ship, and community structure observed across the sam-pled body habitats and across study participants is important to consider when designing studies to assess linkages between the human microbiome and health. Al-though the variability in community composition among healthy individuals exceeds the variability within individ-uals over time (Additional file 6, [3,5,8]), the intra-individual temporal variability is considerable and the degree of variability that an individual experiences over time may be a factor in determining disease state or dif-ferential treatment success. Further, because variability through time can be high, samples collected at one point in time may not adequately characterize an individual's microbiome, even if focusing on only the more abundant phylotypes (Figure 1b, dark shades). If the effect size of a change in disease state on the human microbiome is suf-ficiently large (for example, the loss of a major lineage), this intra-individual temporal variability may be irrele-vant. However, if changes in disease state are associated with more subtle shifts in microbial community compos-ition, it would be important to control for this temporal
0 0.2 0.4 0.6 0.8
0 2 4 6 8
Gut
0 0.2 0.4 0.6 0.8
0 2 4 6
Tongue
0 0.2 0.4 0.6 0.8
0 2 4 6 8 10
Palm
Median Shannon Index
Median UniFrac Distance
0 0.2 0.4 0.6 0.8
0 2 4 6 8
Forehead
-0.517
[image:8.595.60.539.90.324.2]-0.469 0.610
variability before one could establish causal linkages be-tween changes in the microbiome and changes in health status. It is now well established that there is considerable inter-individual variability in the composition of the human microbiome [5,18], leading to the concept of a ‘personal microbiome’, and we are beginning to establish causal rela-tionships between composition of the microbiome and dis-ease [28]. Here we show that there is also a high-degree of inter-individual variability in the stability of the human gut, tongue, forehead, and palm microbiome. As a result, we suggest that the‘personal microbiome’concept should be extended to incorporate the rate of change of an individual’s microbiome, in addition to its composition (a feature which distinguishes the‘personal microbiome’from the‘personal genome’) and that future investigations into associations
between features of the microbiome and host phenotype may want to consider temporal variability as a potential ex-planatory factor.
Methods
Subject recruitment and sample collection
Volunteers were recruited from three Universities (University of Colorado, Boulder (UCB), Northern Arizona University (NAU), and North Carolina State University (NCSU)) in January/February of 2012 and asked to donate weekly self-collected samples for a minimum of 10 weeks using sterile, pre-labeled, double-tipped swabs (Becton, Dickinson and Company, Sparks, MD, USA.). Participants were instructed to sample two skin habitats (foreheads and palms) and the surface of their tongue by swabbing
0 0.1 0.2 0.3 0.4
Bacteroidaceae Lachnospiraceae Ruminococcaceae
Clostridiaceae Prevotellaceae
Porphyromonadaceae
Lactobacillaceae Veillonellaceae Rikenellaceae Clostridia (order)
0 0.1 0.2 0.3 0.4
Streptococcaceae Prevotellaceae Veillonellaceae Pasteurellaceae Neisseriaceae
Micrococcaceae Actinomycetaceae
Bacillaceae
Pseudomonadaceae Porphyromonadaceae 0
0.1 0.2 0.3 0.4
Staphylococcaceae Corynebacteriaceae Streptococcaceae Neisseriaceae
Lactobacillaceae Pasteurellaceae Moraxellaceae Clostridiaceae Micrococcaceae Pseudomonadaceae
0 0.1 0.2 0.3 0.4
Streptococcaceae Staphylococcaceae Corynebacteriaceae
Moraxellaceae Lactobacillaceae
Pseudomonadaceae
Pasteurellaceae Clostridiaceae Micrococcaceae Prevotellaceae
Relative
Abundance
Relative
Abundance
**
**
**
*
**
** **
* **
** *
*
Stable individuals Average individuals Variable individuals
A B
[image:9.595.60.539.92.480.2]C D
for 10 to 15 s. Gut (fecal) samples were collected by touching cotton swabs to used toilet paper so that a small amount of fecal material was transferred to each pair of swabs. Volunteers were asked to collect samples before showering and as close to drop-off times as possible with-out placing samples in freezers to avoid freeze-thaw cycles. One representative at each University collected samples from students and placed them in a -20°C freezer until shipping on dry ice to the UCB where all sample processing occurred. Volunteers were also asked to provide a variety of demographic and behavioral metadata at the initiation of the project using a scantron-based survey (Additional file 1). Weekly questionnaires (Additional file 2) were also provided with sampling kits to collect information on changes in health status, medication use, and menstruation for women. At the conclusion of the study prior to publication, study participants were provided their personalized results via a password-protected website [29]. All volunteers were made aware of the nature of this project and gave written consent in accordance with protocols approved by each University's Institutional Review Board (IRB) (UCB 409.13; NAU 12.0169; NCSU 2443). Per IRB regulations, volunteers were able to drop out of the study at any time and were not re-quired to answer any or all survey questions.
Sample processing
Samples from NAU and NCSU were shipped on dry ice to UCB at the conclusion of sampling. Upon arrival, in-dividual swabs were linked with Personal IDs using digital barcodes and logged into an Excel worksheet. Swabs were then sorted by body habitat and the tip of one duplicate swab was aseptically cut into single wells in 2 mL 96-well deep-well plates (Axygen Inc., Union City, CA, USA). Plates were sealed with silicone Axymat sealing mats (Axygen Inc., Union City, CA, USA). Each plate contained negative control samples that included swab blanks (sterile swabs), extraction blanks (reagents), and a PCR control. Forehead, gut, and tongue plates also included positive controls that were collected from one individual at the initiation of the project and stored/ shipped with samples at each university. No differences were observed in community membership or structure in positive control samples.
DNA extraction, PCR amplification, and sequencing
DNA extraction and PCR amplification of the variable re-gion 4 (V4) of the 16S rRNA gene using Illumina adapted universal primers 515 F/806R [12,30] was conducted using the direct PCR protocol as previously described [31].
Aliquots (4 μL) from the fecal and tongue extracts
were transferred into 384-well plates for triplicate PCR reactions, while skin aliquots (forehead and palm, 4 μL) were transferred into 96-well plates. PCRs were con-ducted in triplicate 20μL reactions and thermal cycling
conditions for the 384-well plates were: initial denatur-ation for 3 min at 94°C; 35 cycles (94°C, 60 s; 50°C, 60 s; 72°C, 105 s) followed by a final elongation for 10 min at 72°C. Conditions for the 96-well plates were identical ex-cept for shorter denaturation (94°C, 45 s) and elongation (72°C, 90 s) steps. PCR products from triplicate reac-tions of each sample were pooled, visualized on an agar-ose gel, and quantified using the PicoGreen dsDNA assay (Invitrogen, Carlsbad, CA, USA). Positive ampli-cons from each body habitat (forehead, gut, palm, and tongue) were then pooled in equimolar concentrations into composite samples that were cleaned using a single-tube MoBio Ultraclean PCR Clean-up Kit (MoBio La-boratories, Carlsbad, CA, USA). Each body habitat was sequenced on an individual lane (4 lanes total) of an Illu-mina HiSeq2000 instrument at the University of Color-ado BioFrontiers Institute Advanced Genomics Facility.
Data processing
All data processing was performed using QIIME 1.6.0-dev unless otherwise noted. The specific processing steps were as follows. Raw fastq data were demultiplexed and quality filtered as described previously [32]. Sequences that passed quality filtering were clustered into phylotypes (Operational Taxonomic Units, OTUs) at 97% sequence identity using a uclust-based [33] closed-reference proto-col against the 12_10 revision of the Greengenes database [34], where reads that did not match a sequence in the ref-erence set at least 97% identity were excluded from subse-quent analyses. The taxonomy of each phylotype was assigned as the taxonomy associated with the Greengenes sequence defining that OTU. The Greengenes phylogen-etic tree was used for phylogenphylogen-etic diversity calculations. A median of 49,242.0 sequences was collected per sample. After removing phylotypes appearing in negative controls at high abundance (≥0.5% across all controls) [31], all samples were rarefied to 10,000 sequences for all down-stream analyses unless otherwise noted.
Potentially mislabeled samples were detected using the random forest classification approach described previously [35]. Briefly, the full sample-by-phylotype abundance matrix (that is, OTU table) was filtered to exclude phylotypes that were observed in fewer than 10 samples. The OTU table was then randomly subsampled to exactly 1,000 sequences per sample. Three samples achieved a probability of being mislabeled greater than 90%, and were excluded from all downstream analyses.
The time series samples were defined as the set of sam-ples that came from an individual’s body site where at least seven samples were collected and successfully sequenced from that individual’s body site over a 10-week sampling period. For example, if six fecal samples and seven forehead samples were sequenced from an individual, their fecal samples would not be included in any time series analyses, but their forehead samples would be included. This resulted in 80 individuals for which we had a forehead time series (48 women, 30 men, 2 unknown), 75 individuals with a gut time series (48 women, 26 men, 1 unknown), 61 individuals with a palm time series (35 women, 25 men, 1 unknown), and 80 individuals with a tongue time series (50 women, 28 men, 2 unknown) from 85 subjects (Table 1).
All QIIME commands for performing these processing steps can be found in Additional file 12.
Statistical analysis
To assess the temporal variability of within sample diver-sity (alpha diverdiver-sity), we calculated the coefficient of variation (CV) for three diversity metrics (phylogenetic di-versity - PD, OTU richness, and Shannon index) for each body habitat of each individual through time. Individual values were used to determine the per body site median across the study population, with higher values indicative of more variable communities.
Variability in community composition (beta diversity) was determined per body habitat by calculating the me-dian weighted and unweighted UniFrac distances for each individual over time. With this metric, communities with a higher median value are more variable whereas a lower value indicates more stable communities. (Note that be-cause we summarize temporal data in a single measure-ment, we do not need to account for lack of independence of temporal samples from a single individual in evalua-tions based on this metric.) Differences across body sites for both alpha- and beta-diversity were assessed using the non-parametric Kruskal-Wallis one-way analysis of vari-ance with pairwise comparisons made using the Mann-WhitneyU-test, as implemented in R.
To determine the number of phylotypes shared by an individual over different windows of time, we converted the OTU tables of each body habitat to a presence/ab-sence matrix, split it by individual, filtered out singletons, and determined the number of OTUs found in exactly two samples, three samples, four samples, and so on up to seven samples using a custom R script. Samples did not have to be from consecutive weeks. We repeated this ana-lysis on only the top 10% most abundant OTUs per indi-vidual. The numbers of phylotypes shared per individual were then averaged across individuals for each window of time and each body habitat.
For each body habitat, the study population was divided into quartiles based on median intra-individual UniFrac
values where the first quartile was defined as ‘stable, the’ second and third quartiles as‘average, and the fourth quar-’ tile as‘variable.’To determine if certain taxa were more or less abundant in the different quartiles (that is, stability classes), we rank transformed the most abundant bacterial families (>1% across individuals) for each body habitat and tested for differences between the groups using the non-parametric Kruskal-Wallis analysis of variance.
adonis [36], ANOSIM [37], and PERMDISP [36] (using 999 permutations) were used to test for differences in com-munity composition between individuals at each body site. The statistical methods were used to analyze both weighted and unweighted UniFrac distance matrices, with only the time series samples being included in the analyses.
To determine the affect of antibiotic use on community variability, we grouped individuals based on their usage (yes
or no) and used the non-parametric Mann-WhitneyU-test
to test for differences between the two groups. Spearman rank correlations were used to determine if community variability as measured using median UniFrac distances was correlated across pairs of body habitats. To assess if pat-terns in community composition could be related to time between sampling events, Mantel tests (Spearman-rank correlations on 999 permutations) were conducted for each individual using both weighted and unweighted UniFrac values and Manhattan time-distance matrices calculated in R using the VEGAN package [35]. Using the mean of the different alpha diversity metrics (PD, phylotype richness, and Shannon index [13]) as our metrics of diversity and median UniFrac distances (both weighted and unweighted) as our metric of community variability on a per individual basis, we constructed linear models for each body habitat across individuals to examine the relationship between di-versity and stability.
We identified key predictors of the variability in com-position of bacterial assemblages using generalized linear models. We used a model simplification procedure,
re-moving non-significant terms (α =0.05) in a stepwise
fashion [38], to explore the relative contributions of the various terms included in the start model. Model simpli-fication approaches have been criticized [39], but in the absence of strong a priori information on the drivers of variability of bacterial assemblages, this approach is a useful first step [40]. The final models we present are those that exclusively include variables that explain sig-nificant variation in our dependent variables. We also used model simplification in which final models were those in which Bayesian information criterion (BIC) was
minimized. However, these ‘best’ models ended up
in-cluding all variables we tested and so here we focus on those variables with significant explanatory power.
we ran per-body-site one-tailed, rank-based Monte Carlo t-tests. The adjacent-week UniFrac distances were com-piled for each individual on a per-body-site basis (that is, the distance between their gut samples on week 1 and week 2, week 2 and week 3, and so on). Each individual’s UniFrac distances were ranked from smallest to largest, and assigned their rank value. Across individual ranks were grouped into distributions based on whether they oc-curred in a week where the individual reported taking an-tibiotics or not. Those distributions were then compared with a one-tailed Monte Carlot-test with 1,000 iterations.
Data availability
Sequence data and accompanying de-identified metadata have been deposited in the EMBL under accession num-ber (ERP005150-ERP005153).
Additional files
Additional file 1:The pre-study questionnaire used to collect demographic, lifestyle, and hygiene data on study participants.
Additional file 2:The weekly questionnaire used to collect information about changes in health status, medication use, stage of menstrual cycle for women, and any other dramatic changes in the routine of study participants.
Additional file 3:A list of all samples collected in this study with corresponding de-identified personal IDs of study subjects and answers to survey questions.
Additional file 4:A figure showing the amount of microbial diversity observed in each sample.
Additional file 5:A figure depicting the temporal variability observed in microbial community membership and structure for each body habitat of each individual.
Additional file 6:A table showing that the composition of each individual’s microbiome is personalized through time.
Additional file 7:A figure showing how the microbial communities of selected individuals vary through time.
Additional file 8:A table showing the results of Spearman rank correlation of community membership across different body habitats.
Additional file 9:A table showing the results of Spearman rank correlation of community structure across different body habitats.
Additional file 10:A table of Mantel test results correlating microbial community membership and structure with time between samples (time distance-decay).
Additional file 11:A table of results correlating microbial diversity with temporal variability in community membership and structure for each body habitat.
Additional file 12:A list of all QIIME commands used in data processing.
Abbreviations
BIC:Bayesian information criterion; BMI: body mass index; CA: California; CV: coefficient of variation; dsDNA: double-stranded deoxyribonucleic acid; GLM: generalized linear model; IRB: Institutional Review Board; MD: Maryland; mL: milliliter; NAU: Northern Arizona University; NCSU: North Carolina State University; OTU: operational taxonomic unit; PCR: polymerase chain reaction; PD: phylogenetic diversity; QIIME: Quantitative Insights Into Microbial Ecology; rRNA: ribosomal ribonucleic acid; sec: seconds; UCB: University of Colorado, Boulder;μL: microliter; U.S.: United States; USA: United States of America; V4: variable region 4.
Competing interests
The authors declare that they have no competing interests.
Authors’contributions
GEF conceived of and designed the study, collected samples, analyzed and interpreted the data, and wrote the paper. JGC conceived of and designed the study, analyzed and interpreted the data, and wrote the paper. JBH conducted all wet lab work. JRR analyzed and interpreted the data. DD collected samples and analyzed and interpreted the data. JC analyzed and interpreted the data. JWL analyzed and interpreted the data. YVB analyzed and interpreted the data. AG analyzed and interpreted the data. RK conceived of and designed the study, analyzed and interpreted the data, and wrote the paper. RRD conceived of and designed the study, analyzed and interpreted the data, and wrote the paper. NF conceived of and designed the study, analyzed and interpreted the data, and wrote the paper. All authors read and approved the final
manuscript.
Acknowledgments
We thank MJ Gebert, G Humphrey, and CL Lauber for logistical support throughout the project; N Rountree for sample collection; A Shade for providing custom R scripts; G Ackermann for IRB assistance; and M Watwood, E Schwartz, and J Wilder for help recruiting study participants. Computational support was provided by an Amazon Web Services research grant to JGC and RK Support for YVB, AG, and RK came from the National Institutes of Health, the Crohns and Colitis Foundation of America, and the Howard Hughes Medical Institute. RRD was supported by grant #52006933 to NC State University from the Howard Hughes Medical Institute through the Precollege and Undergraduate Science Education Program (http://www. hhmi.org/grants/office/undergrad/).
Author details
1Department of Biology, California State University, Northridge, Northridge,
CA 91330-8303, USA.2Department of Biological Sciences, Northern Arizona University, Flagstaff, AZ 86011, USA.3Center for Microbial Genetics and
Genomics, Northern Arizona University, Flagstaff, AZ 86011, USA.
4Cooperative Institute for Research in Environmental Sciences, University of
Colorado, Boulder, CO 80309, USA.5Department of Genetics and Genomic Sciences, Icahn School of Medicine at Mount Sinai, New York, NY 10029, USA.6Department of Ecology and Evolutionary Biology, University of Colorado, Boulder, CO 80309, USA.7Department of Computer Science,
University of Colorado, Boulder, CO 80309, USA.8BioFrontiers Institute, University of Colorado, Boulder, CO 80309, USA.9Department of Chemistry
and Biochemistry, University of Colorado, Boulder, CO 80309, USA.10Howard Hughes Medical Institute, University of Colorado, Boulder, CO 80309, USA.
11
Department of Biological Sciences and Keck Center for Behavioral Biology, North Carolina State University, Raleigh, NC 27607, USA.
Received: 3 June 2014 Accepted: 5 November 2014
References
1. Turnbaugh PJ, Ley RE, Hamady M, Fraser-Liggett CM, Knight R, Gordon JI: The human microbiome project.Nature2007,449:804–810.
2. Huttenhower C, Gevers D, Knight R, Abubucker S, Badger JH, Chinwalla AT, Creasy HH, Earl AM, FitzGerald MG, Fulton RS, Giglio MG, Hallsworth-Pepin K, Lobos EA, Madupu R, Magrini V, Martin JC, Mitreva M, Munzy DM, Sodergren EJ, Versalovic J, Wollam AM, Worley KC, Wortman JR, Young SK, Zeng Q, Aagaard KM, Abolude OO, Allen-Vercoe E, Alm EJ, Alvarado L,et al: Structure, function and diversity of the healthy human microbiome. Nature2012,486:207–214.
3. Caporaso JG, Lauber CL, Costello EK, Berg-Lyons D, Gonzalez A, Stombaugh J, Knights D, Gajer P, Ravel J, Fierer N, Gordon JI, Knight R:Moving pictures of the human microbiome.Genome Biol2011,12:R50.
4. Dethlefsen L, Relman DA:Incomplete recovery and individualized responses of the human distal gut microbiota to repeated antibiotic perturbation.Proc Natl Acad Sci U S A2011,108:4554–4561.
6. Grice EA, Kong HH, Conlan S, Deming CB, Davis J, Young AC, Bouffard GG, Blakesley RW, Murray PR, Green ED, Turner ML, Segre JA:Topographical and temporal diversity of the human skin microbiome.Science2009, 324:1190–1192.
7. Camarinha-Silva A, Jauregui R, Pieper DH, Wos-Oxley ML:The temporal dynamics of bacterial communities across human anterior nares. Environ Microbiol Rep2012,4:126–132.
8. Gajer P, Brotman RM, Bai G, Sakamoto J, Schutte UM, Zhong X, Koenig SS, Fu L, Ma ZS, Zhou X, Abdo Z, Forney LJ, Ravel J:Temporal dynamics of the human vaginal microbiota.Sci Transl Med2012,4:132ra152.
9. Wu GD, Chen J, Hoffmann C, Bittinger K, Chen YY, Keilbaugh SA, Bewtra M, Knights D, Walters WA, Knight R, Sinha R, Gilroy E, Gupta K, Baldassano R, Nessel L, Li H, Bushman FD, Lewis JD:Linking long-term dietary patterns with gut microbial enterotypes.Science2011,334:105–108.
10. David LA, Maurice CF, Carmody RN, Gootenberg DB, Button JE, Wolfe BE, Ling AV, Devlin AS, Varma Y, Fischbach MA, Biddinger SB, Dutton RJ, Turnbaugh PJ:Diet rapidly and reproducibly alters the human gut microbiome.Nature2014,505:559–563.
11. Kong HH, Oh J, Deming C, Conlan S, Grice EA, Beatson MA, Nomicos E, Polley EC, Komarow HD, Murray PR, Segre JA:Temporal shifts in the skin microbiome associated with disease flares and treatment in children with atopic dermatitis.Genome Res2012,22:850–859.
12. Caporaso JG, Lauber CL, Walters WA, Berg-Lyons D, Huntley J, Fierer N, Owens SM, Betley J, Fraser L, Bauer M, Gormley N, Gilbert JA, Smith G, Knight R:Ultra-high-throughput microbial community analysis on the Illumina HiSeq and MiSeq platforms.ISME J2012,6:1621–1624. 13. Magurran A:Measuring Biological Diversity.Oxford: Blackwell Publishing;
2004.
14. Shade A, Caporaso JG, Handelsman J, Knight R, Fierer N:A meta-analysis of changes in bacterial and archaeal communities with time.ISME J2013, 7:1493–1506.
15. Fukami T:Community assembly along a species pool gradient: implications for multiple-scale patterns of species diversity.Popul Ecol 2004,46:137–147.
16. Lozupone C, Knight R:UniFrac: a new phylogenetic method for comparing microbial communities.Appl Environ Microbiol2005, 71:8228–8235.
17. Ravel J, Gajer P, Abdo Z, Schneider GM, Koenig SS, McCulle SL, Karlebach S, Gorle R, Russell J, Tacket CO, Brotman RM, Davis CC, Ault K, Peralta L: Vaginal microbiome of reproductive-age women.Proc Natl Acad Sci U S A 2011,108:4680–4687.
18. Fierer N, Lauber CL, Zhou N, McDonald D, Costello EK, Knight R:Forensic identification using skin bacterial communities.Proc Natl Acad Sci U S A 2010,107:6477–6481.
19. White PE, Adler BP, Lauenroth KW, Gill AR, Greenberg D, Kaufman MD, Rassweiler A, Rusak AJ, Smith DM, Steinbeck RJ, Waide RB, Yao J:A comparison of the species–time relationship across ecosystems and taxonomic groups.Oikos2006,112:185–195.
20. Dethlefsen L, Huse S, Sogin ML, Relman DA:The pervasive effects of an antibiotic on the human gut microbiota, as revealed by deep 16S rRNA sequencing.PLoS Biol2008,6:e280.
21. Maurice CF, Haiser HJ, Turnbaugh PJ:Xenobiotics shape the physiology and gene expression of the active human gut microbiome.Cell2013, 152:39–50.
22. Tilman D:The ecological consequences of changes in biodiversity: A search for general principles.Ecology1999,80:1455–1474.
23. Le Chatelier E, Nielsen T, Qin J, Prifti E, Hildebrand F, Falony G, Almeida M, Arumugam M, Batto JM, Kennedy S, Leonard P, Li J, Burgdorf K, Grarup N, Jorgensen T, Brandslund I, Nielsen HB, Juncker AS, Bertalan M, Levenez F, Pons N, Rasmussen S, Sunagawa S, Tap J, Tim S, Zoetendal EG, Brunak S, Clement K, Dore J, Kleerebezem M,et al:Richness of human gut microbiome correlates with metabolic markers.Nature2013,500:541–546. 24. Prince T, McBain AJ, O’Neill CA:Lactobacillus reuteri protects epidermal
keratinocytes from Staphylococcus aureus-induced cell death by competitive exclusion.Appl Environ Microbiol2012,78:5119–5126. 25. Zarate G, Nader-Macias ME:Influence of probiotic vaginal lactobacilli on
in vitro adhesion of urogenital pathogens to vaginal epithelial cells. Lett Appl Microbiol2006,43:174–180.
26. Ley RE, Turnbaugh PJ, Klein S, Gordon JI:Microbial ecology: human gut microbes associated with obesity.Nature2006,444:1022–1023.
27. Bervoets L, Van Hoorenbeeck K, Kortleven I, Van Noten C, Hens N, Vael C, Goossens H, Desager KN, Vankerckhoven V:Differences in gut microbiota composition between obese and lean children: a cross-sectional study. Gut Pathogens2013,5:10.
28. Smith MI, Yatsunenko T, Manary MJ, Trehan I, Mkakosya R, Cheng J, Kau AL, Rich SS, Concannon P, Mychaleckyj JC, Liu J, Houpt E, Li JV, Holmes E, Nicholson J, Knights D, Ursell LK, Knight R, Gordon JI:Gut microbiomes of Malawian twin pairs discordant for kwashiorkor.Science2013, 339:548–554.
29. My Microbes, Personalized Microbiome Results of the Student Microbiome Project.[http://my-microbes.qiime.org]
30. Bates ST, Berg-Lyons D, Caporaso JG, Walters WA, Knight R, Fierer N: Examining the global distribution of dominant archaeal populations in soil.ISME J2011,5:908–917.
31. Flores GE, Henley JB, Fierer N:A direct PCR approach to accelerate analyses of human-associated microbial communities.PLoS One 2012,7:e44563.
32. Bokulich NA, Subramanian S, Faith JJ, Gevers D, Gordon JI, Knight R, Mills DA, Caporaso JG:Quality-filtering vastly improves diversity estimates from Illumina amplicon sequencing.Nat Methods2013,10:57–59. 33. Edgar RC:Search and clustering orders of magnitude faster than BLAST.
Bioinformatics2010,26:2460–2461.
34. McDonald D, Price MN, Goodrich J, Nawrocki EP, DeSantis TZ, Probst A, Andersen GL, Knight R, Hugenholtz P:An improved Greengenes taxonomy with explicit ranks for ecological and evolutionary analyses of bacteria and archaea.ISME J2012,6:610–618.
35. Knights D, Kuczynski J, Koren O, Ley RE, Field D, Knight R, DeSantis TZ, Kelley ST:Supervised classification of microbiota mitigates mislabeling errors.ISME J2011,5:570–573.
36. Oksanen J, Blanchet FG, Kindt R, Legendre P, Minchin PR, O’Hara RB, Simpson GL, Solymos P, Stevens MHH, Wagner H:vegan: Community Ecology Package.InR package version 20–5.Wien: Institute for Statistics and Mathematics; 2012 [http://CRAN.R-project.org/package=vegan]. 37. Clarke KR:Non-parametric multivariate analyses of changes in
community structure.Aust J Ecol1993,18:117–143.
38. Crawley MJ:Statistical Computing: An Introduction to Data Analysis Using S-Plus.Chichester: John Wiley & Sons, Ltd.; 2002.
39. Whittingham MJ, Stephens PA, Bradbury RB, Freckleton RP:Why do we still use stepwise modelling in ecology and behaviour?J Anim Ecol2006, 75:1182–1189.
40. Anderson DR:Model Based Inference in the Life Sciences: A Primer on Evidence.New York: Springer Science+ Business Media, LLC; 2008.
doi:10.1186/s13059-014-0531-y
Cite this article as:Floreset al.:Temporal variability is a personalized
feature of the human microbiome.Genome Biology201415:531.
Submit your next manuscript to BioMed Central and take full advantage of:
• Convenient online submission
• Thorough peer review
• No space constraints or color figure charges
• Immediate publication on acceptance
• Inclusion in PubMed, CAS, Scopus and Google Scholar
• Research which is freely available for redistribution