Technology (IJRASET)
©IJRASET 2013: All Rights are Reserved
387
Detection Of Myocardial Ischemia In ECG Signals
Using Support Vector Machine
Dr.S.Sumathi1, Mrs.V.Agalya2
Mahendra Engineering College, Mahendhirapuri, Mallasamudram
Abstract--This paper presents an intellectual diagnosis system using rule based evaluvation of myocardial ischemia in electrocardiogram (ECG) signals using wavelet transform. This method is mainly through the computation of an indicator related to the area covered by the ST-wave curve. The algorithm is healthy to acquisition noise, to wave form morphological variations and to baseline wandering. To find the main computation has been implemented to simple finite impulse response filter. The inclusion of rule based system in the complex investigating algorithms yields very interesting recognition and classification of biomedical engineering. The results give importance to that the proposed model illustrates potential advantage to identify the myocardial Ischemia. The sensitivity 93.01% and positive predictivity of 97.19 is achieved.
Keywords: ECG, Wavelet Transform, Support Vector Machine, Myocardial Ischemia.
I. INTRODUCTION
Myocardial Ischemia (MI) is the most common cardiac disorder and its early diagnosis is of great importance. It is defined by a reduced blood flow of the myocardium which causes alterations in the ECG signal, such as deviations in the ST segment and changes in the T wave. MI is considered to be a major complication of the cardiac function and a prime cause for the occurrence of cardiac infarction and dangerous cardiac arrhythmias has been pointed out by Cohen (1988). The main characteristic of ischemia at the cellular level is the depolarization of the cellular resting membrane potential. This causes a potential difference between the normal and ischemic tissue which, in turn, causes the flow of an “injury current” (Coumel and Garfein 1990). This injury current is manifested in the electrocardiogram (ECG) by an ST depression or elevation, depending on the anatomical position of the heart and the dipole’s position with respect to the recording electrodes (Paul 1998, Gu-Young Jeong and Kee-Ho Yu 2007, Tapobrata et al 2009). Thus, there are cases in the 12-lead standard electrode system where the ST depression is not evident in ischemic beats, while ST depression may exist when ischemia is not present such as can happen with leads III and a VF due to patient position has been pointed by Zimmerman and Povinelli (2004). Ischemic episodes could be acute ones that should be detected immediately when the patient is in a Critical Care Unit (CCU) environment, but also in a Holter database ischemic episodes should be reliably and correctly detected. Although ischemia detection from ST analysis alone is difficult to accomplish and has to be accompanied by a number of biochemical and other examinations, ECG still remains one of the basic biosignals for aiding the clinical staff in a CCU environment. Major problems contributing to poor detection of the ST segment in the ECG can be identified as follows:
Slow baseline drift Noise
Sloped ST changes
Patient dependent abnormal ST depression levels and
Varying ST-T patterns in the ECG of the same patient.
Technology (IJRASET)
©IJRASET 2013: All Rights are Reserved
388
Figure 1 The relevant ST segment points in ECG signal
A. Wavelet Transform
The ECG signals are considered as representative signals of cardiac physiology, which are useful in diagnosing cardiac disorders. The complete way to display this information is to perform spectral analysis. The Wavelet Transform (WT) gives extremely general techniques, which can be implemented to many tasks in signal processing. The ECG signal, consisting of lot of characteristic points, can be compressed into a few points. These points characterize the behaviour of the ECG signal. This feature of using a lesser number of parameters to represent the ECG signal is particularly important for recognition and diagnostic functions. The WT can be thought of as an extension of the classic Fourier transform, but instead of working on a single scale (time or frequency), it works on a multiple-scale basis. This multiple-scale feature of the WT allows the decomposition of a signal into a number of scales, every scale representing a particular coarseness of the signal under this study. The procedure of multiresolution decomposition of a signal
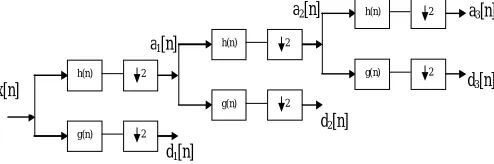
[image:3.612.183.430.400.482.2]x[n] is schematically shown in Figure 2. Every stage of thisscheme consists of two digital filters and two down samplersby 2. The initial filter, the discrete mother wavelet is g[n],high pass in nature, and the second, h[n] is its reflect version,low-pass in nature. The down sampled outputs of firsthigh pass and low-pass filters give the detail, d1 and the approximation,a1, respectively. The first approximation, a1 ismore decomposed and this process is continued as shownin Figure. 2.
Figure 2 Three level wavelet decomposition tree
B. ECG Database
The training set was constructed using patterns from the European Society of Cardiology (ESC) ST-T Database. The ECGs included in this database are 2-hour long recordings digitized at 250 Hz. This database is intended to be used for the evaluation of algorithms for ischemia analysis based on ST and T wave changes. The database consists of 90 continuous two channel records. The leads used included modified leads V1, V2, V3, V4, and V5 and modified limb leads MLI and MLIII. Each record contains at least one ST or T ischemic episode. Specifically, for the ST episode annotations, the expert cardiologists used the following criteria:
ST segment deviations are measured in relation to a reference normal waveform selected from the first 30 s of each record.
Measurements of ST deviation are taken 80 ms after the J-point or in the case of tachycardia 60 ms after the J-point.
ST episodes must contain an interval of at least 30 s during which the absolute value of the ST deviation is no less than 0.1 mV.
The beginning and the end of each episode are annotated searching backward and forward, respectively, from the ST episode, until a beat is found with absolute ST segment deviation less than 0.05 mV. Working independently, the two specialist-annotators visually checked the full disclosure printouts and manually inserted annotations indicating changes in ST and T morphology, rhythm, and
d2[n] a2[n]
a1[n]
a3[n]
d3[n]
d1[n] x[n]
h(n)
g(n) 2
2
h(n)
g(n) 2
2
h(n)
g(n) 2
Technology (IJRASET)
©IJRASET 2013: All Rights are Reserved
389
signal quality. Annotations from the two cardiologists were compared and the differences were resolved by a third cardiologist.
C. Theory Of SVM
The SVM technique, was originally proposed essentially for classification problems of two classes but was found to be useful to deal with non-linearly separable cases too. Given a set ofpoints which belong to either of two classes, a linear SVM finds the hyperplane leaving the largest possible fraction of points of the same class on the same side, while maximizing the distance of either class from the hyperplane[5-10].
b
x
x
K
y
x
u
N i i i i
1)
,
(
)
(
i N j i j j ji
y
K
x
x
y
F
1
)
,
(
0
1
i
Case
(
F
i
b
)
y
i
0
C
Case
2
0
i
(
F
i
b
)
y
i
0
C
Case
3
i
(
F
i
b
)
y
i
0
And by further classification according to the possible combination of alpha and
y
i. We can have:2 1 0
I
I
I
i
for
F
b
i
4 3 0
I
I
I
i
for
F
b
i
II. MATERIAL AND METHODS
The method carried out in this thesis is given. The algorithm is developed in five steps:
ECG Signal Preprocessing ECG Feature Extraction
Detection of Beat
Window Classification and
Ischemia Episode Identification.
A. ECG Signal Preprocessing
In the first stage, preprocessing of the ECG recording is performed to achieve noise removal, artifact rejection and extraction of the signal features which are used for beat characterization. For noise cancellation procedure in this work cubic spline wavelet filtering for eliminating the low and high frequency components for noise cancellation is used in this work.
B. ECG Feature Extraction
Technology (IJRASET)
©IJRASET 2013: All Rights are Reserved
390
amplitude while the high frequency noises are decreased greatly and the low frequency noises are weak, so the R wave is extracted at S= 22 scale. Low-frequency and slow-changing T wave is usually influenced by low amplitude and high frequency disturbances, which can be avoided at larger scales such as S = 23. S wave is high-frequency low-amplitude, and its energy is mostly at S = 25 scale. So the S wave is extracted at S = 24 scale. R peak extraction is based on the relation between the signal singularity and its WT, QRS complex wave corresponds to maxima and minima terminations at S = 22 scale, and R peak corresponds to the zero-crossing point of the maxima and minima terminations with a fixed delay. ST segment is composed of S peak, J point, the beginning of the T wave, T peak and ST voltage. The extractive scheme of the feature points is illustrated in detail as follows. S peak is located at the first downward peak after the zero-crossing point of R peak at S = 22 scale.Tpeak is the first zero-crossing point of maxima and minima terminations after R peak at S = 23 scale.
C. Detection Of Beat
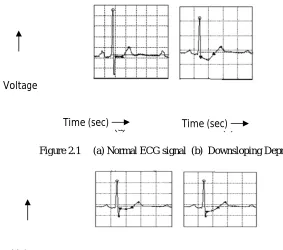
The third stage has the classification of each beat as normal or ischemic based on a set of rules used by cardiologist for locating ST episodes to diagnose ischemia. The two rules are framed based on ST deviation being measured relative to ST deviation in the reference template which has been constructed from the first 30s of each record. The extractive results of six different shapes of ST segment: normal, downsloping depression, horizontal depression, upsloping depression, concave elevation, convex elevation were shown in Figures 2.1 to 2.4. The first rule refers to negative ST deviation, in which ST deviation is more than 0.08mV below the isoelectric line and has an angle larger than 65 degree measured from vertical line, it is considered as negative ST deviation or ST depression. The second rule classifies beat as ischemic if ST deviation is more than 0.08 mV above the isoelectric line has been pointed out by Goldberger (2006).
[image:5.612.132.415.348.598.2]
(a) (b)
Figure 2.1 (a) Normal ECG signal (b) Downsloping Depression
Figure 2.2 ST Horizontal Depression and Upsloping Depression
Time (sec) Voltage
Time (sec)
Time (sec) Voltage
Technology (IJRASET)
[image:6.612.50.546.38.284.2]©IJRASET 2013: All Rights are Reserved
391
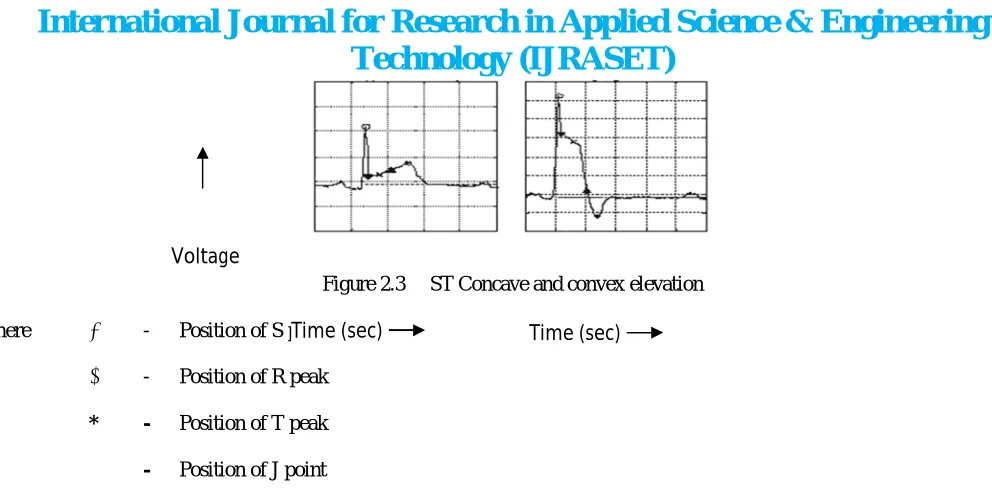
Figure 2.3 ST Concave and convex elevation
where ● - Position of S peak
○ - Position of R peak
* - Position of T peak
▼ - Position of J point
D. Window Classification
According to European Society of Cardiology (ESC) recommendation, a ST episode must include an interval of at least 30 seconds containing ischemic beats. Therefore, we use an adaptive moving window of 30 seconds that starts sliding beat-by-beat from the first cardiac beat to examine whether there exists a sequence of ischemic beats lasting more than 30 seconds. The window is classified as ischemic if the number of ischemic beats is more than 75% of all beats in the window.
E. Ischemia Episode Identification
In the final stage, we find all sequences of ischemic windows. If the duration of normal intervals appeared between two ischemic windows is less than 30 seconds, then a merging technique will be activated to avoid fragmentation of the ST episodes. After episode identification, we annotate the beginning and the end of each episode. The beginning is located by searching backward from the point at which the absolute ST deviation first exceeds 0.08 mV. The search continues until a beat is found for which the absolute ST deviation is less than 0.05 mV. The end of each episode is located by searching forward from the point at which the absolute ST deviation last exceeds 0.08 mV.
III. RESULTS AND DISCUSSIONS
In the numerical experiments, we have used the ECG data from the MIT-BIH Arrhythmia Database corresponding to the normal heartbeat and myocardial arrhythmias. Each type heartbeat was extracted from the record which contained most beats of this type.Then each type heartbeat has a data set that contains many heartbeats. Due to the scarcity of data corresponding to some beat types the number of data belonging to each heartbeat type was variable. We chosen 70% of data set to be training data and 30% of data set to be testing data. The algorithm was tested using a subset of ESC ST-T database. This database contains ECG recordings with annotated ischemic episodes. To evaluate the performance of the proposed classifier, two measures were used and defined as follows:
Sensitivity %
TP
TP
FN
(3.1)Positive Predictivity(%) =
TP
TP
FP
(3.2)where TP, FN and FP are defined in Table 3.1. In order to derive ST episode sensitivity and positive predictivity, an episode-by-episode comparison was needed. According to American National Standard, overlap exists during any interval in which both the
Time (sec) Voltage
Technology (IJRASET)
©IJRASET 2013: All Rights are Reserved
392
[image:7.612.44.575.317.737.2]reference and algorithm annotations indicate that an ST change is in progress. Events match for the purposes of measuring sensitivity when the period of overlap includes either the reference marked extremum or at least 50% of the length of the reference-marked event. Events match for the purposes of measuring positive predictivity when the period of overlap includes either the algorithm-marked extremum or at least 50% of the length of the algorithm-marked event (ANSI/AAMI EC57, 1998). The processing time for ECG recordings was expressed as mean value
one standard deviation.Table 3.1 ST episode Sensitivity and Positive Predictivity matrix
Algorithm
Reference
ST Episode Not Episode
ST Episode TP FN
Not Episode FP TN
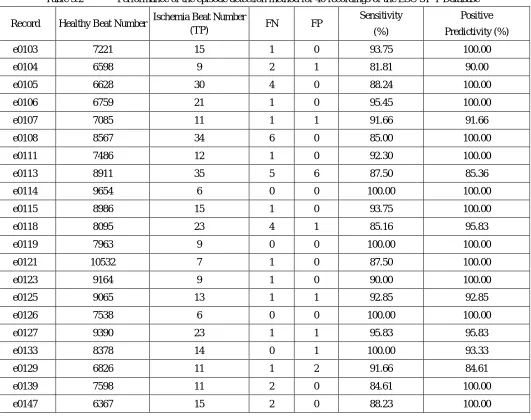
The proposed method is evaluated as follows: we used 40 ECG records of ESC ST-T database. Each record consists of two-channel two-hour ECG recordings with ischemic episode annotation. Table 3.2 shows the results of applying our method to each record. For each ECG recording, the sensitivity and positive predictivity values are given in terms of percentages
Table 3.2 Performance of the episode detection method for 40 recordings of the ESC ST-T Database
Record Healthy Beat Number Ischemia Beat Number
(TP) FN FP
Sensitivity
(%)
Positive
Predictivity (%)
e0103 7221 15 1 0 93.75 100.00
e0104 6598 9 2 1 81.81 90.00
e0105 6628 30 4 0 88.24 100.00
e0106 6759 21 1 0 95.45 100.00
e0107 7085 11 1 1 91.66 91.66
e0108 8567 34 6 0 85.00 100.00
e0111 7486 12 1 0 92.30 100.00
e0113 8911 35 5 6 87.50 85.36
e0114 9654 6 0 0 100.00 100.00
e0115 8986 15 1 0 93.75 100.00
e0118 8095 23 4 1 85.16 95.83
e0119 7963 9 0 0 100.00 100.00
e0121 10532 7 1 0 87.50 100.00
e0123 9164 9 1 0 90.00 100.00
e0125 9065 13 1 1 92.85 92.85
e0126 7538 6 0 0 100.00 100.00
e0127 9390 23 1 1 95.83 95.83
e0133 8378 14 0 1 100.00 93.33
e0129 6826 11 1 2 91.66 84.61
e0139 7598 11 2 0 84.61 100.00
Technology (IJRASET)
©IJRASET 2013: All Rights are Reserved
393
e0148 8766 5 1 1 83.33 83.33
e0151 7524 6 1 0 85.71 100.00
e0155 9655 8 2 1 80.00 88.88
e0166 8498 24 2 1 92.30 96.00
e0170 8432 12 3 0 80.00 100.00
e0203 10051 14 2 2 87.50 87.50
e0303 8865 7 0 0 100.00 100.00
e0305 9289 9 1 0 90.00 100.00
e0403 9763 7 2 1 77.77 87.50
e0404 8528 4 1 1 80.00 80.00
e0405 11056 18 0 0 100.00 100.00
e0411 9487 8 0 0 100.00 100.00
e0413 7367 9 1 0 90.00 100.00
e0415 11276 12 3 1 80.00 92.30
e0417 9227 11 0 0 100.00 100.00
e0501 7754 18 5 2 78.26 90.00
e0601 8728 6 0 1 100.00 85.71
e0605 6749 13 3 1 81.25 92.85
e0808 8765 16 2 1 88.88 94.11
Total 338591 536 64 27 90.01 95.19
When aggregate gross statistics was used, we obtained 90.01% and 95.19 % for episode sensitivity and positive predictivity. The time needed for the processing of each ECG recording was
455
s
91
s
.IV. CONCLUSION
This paper presented an efficient system for the detection of Myocardial Ischemia episodes in ECG signal using SVM. Since the detection algorithm is based on the rules used by cardiologists for diagnosing ischemia in ECG records, it is useful as a diagnostic tool to aid the physician in the analysis of ST changes. Short processing time and acceptable accuracy of the proposed method, are its main advantages and enables it to be used in real time ischemic episodes detection systems and reliable clinical monitoring of the patient status
REFERENCES
[1] [1] Biomedical Engineering - Applications, Basis and Communications.
[2] [2] Coumel P. and Garfein O. (1990), “Electrocardiography: Past and Future”, Annuals of the New York, Academy of Sciences, Vol. 601, New York.
[3] [3] Paul J.S. (1998), “Eigen Filter based Extraction of ST Segment Waveform from Surface ECG’s”, Proceedings of the 20th Annual International Conference
of the IEEE Engineering and Biology Society, Hong Kong, October 29-30, November 1, Vol. 1, pp.190-193
[4] [4] Gu-Young Jeong and Kee-Ho Yu (2007), “Morphological Classification of ST segment using Reference STs Set”, Proceedings of the 29th Annual
International Conference of the IEEE Engineering in Medicine and Biology Society, Lyon, August 23-26, pp. 636-639.
[5] [5] Tapobrata, Upendra Kumar and Hrishikesh Mishra (2009), “Analysis of ECG Signal by Chaos Principle to help Automatic Diagnosis of Myocardial Infarction”, Journal of scientific and Industrial Research, Vol. 68, pp. 866-870.
[6] [6] Zimmerman M.W. and Povinelli R.J. (2004), “On Improving the Classification of Myocardial Ischemia Using Holter ECG Data”, Computers in Cardiology, Vol. 31, pp. 377-380.
Technology (IJRASET)
©IJRASET 2013: All Rights are Reserved
394
[8] [8] Mohammad Karimi Moridani and Majid Pouladian (2009), “Detection Ischemic Episodes from Electrocardiogram Signal using Wavelet Transform”, Journal of Biomedical Science and Engineering, Vol. 2, pp. 239-244.
[9] [9] Gonzalez R., Canizares M., Rodriguez G. and Meissimilly G. (2003), “A Spatial Study of the ST Segment”, Proceedings of the 25th Annual International