Effects caused on Leaky integrate and fire model
Shruti Gupta
KIIT College of Engineering, Gurgaon
Abstract— for analyzing the behaviour of neural system, the model used most widely is integrate and fire model. The membrane potential of a neuron in terms of injected current and synaptic inputs is described by integrate and fire model. When the membrane potential reaches a certain threshold voltage its action potential is generated. For description of spiking neurons, the integrate and fire model has become an important model because it can analyze it mathematically. In this paper, we use leaky integrate and fire model equations as base to study the graphs. Stochastic Linear integrate and fire model or generalized linear model implements single neuron models variability.
Keywords— leaky integrate and fire model, t stop, computational neuroscience, spiking patterns, variations in graph.
I. INTRODUCTION
Membrane potential characterises the neuron state in integrate and fire neuron model. Excitatory or inhibitory contributions by synaptic inputs are received by membrane potential that arrive from other neurons by their relative synapses. Spatial structure of the neuron associated with dendrites is neglected in single compartment integrate and fire model. The entire range of computational functions cannot be accounted for spiking neurons by the simplified mathematical models of biological neurons as in [Renaud Jolivetz et al.]. The temporal summation function is the main parameter of integrate and fire model of the neuron. To understand the behaviour of large recurrent networks of spiking neurons is the major challenge in computational neuroscience.
The model is a perfect integrator, if decay of membrane potential over time is neglected. An output spike is generated, when the membrane potential reaches a threshold called integrate and fire mechanism. The membrane potential of neurons in terms of an electric current consisting of a resistor and capacitor in parallel, representing the leakage and capacitance of the membrane is described by integrate and fire model. For analysis and behaviour of neuronal activity of neural circuit, the model used is integrate and fire which is the simplest and wide application area as in [Skander Mensi et al, 1989].
The leaky integrate and fire model is introduced in Section 2 giving details of formulation of equations, implementation of our work in MATLAB. Section 3 is for numerical analysis of the graphs obtained. Study of graphs obtained. In Section 4 will discuss the results of MATLAB code and at last but not the least in Section 5 we conclude our research work.
II. FORMULATIONOFEQUATIONS
The neuron is modelled as “leaky integrator” of its input I (t): [Nicolas Brunel et al]
(1)
Where v(t) represents the membrane potential at time t, tm is the membrane time constant and R is the membrane resistance. a leaky integrator equation is a definite differential equation, used to depict a section or system that takes the integral of an input, but steadily leaks a little amount of input over time. The leaky integrate and fire model equation used in our MATLAB code for implementation is:
(2)
Where V is the membrane voltage, R is the Leak resistance, C is the capacitance and I is the input current. As in [Lukasz Wiklendt et al], the leaky integrate and fire model with external noise current:
(4)
Where Ii(ext) is the total external current received by the i-th neuron, V is the voltage, R=50 is the leak resistance, = 1nF is the capacitance, I is the current. Ii(ext) is the i-th neuron consists of external sub threshold stimulus I0, external noise current
ℇi(t). Ref [A. N. Burkitt, 2006] we consider the noise current ℇi(t) as Gaussian white noise as in [Arun Singh Chouhan, 2013].
III. NUMERICALANALYSIS
The neural membrane potential is associated with two sources of noise: intrinsic to the neurons and other external to the neuron. In leaky integrate and fire model the spiking events are not explicitly modelled as in [Jianfeng Feng et al]. The refractory period is defined in two ways, after initiation of an action potential, first is the absolute refractory period and second is the relative refractory period.
We plot graphs between membrane potential and time on the basis of value of t stop. We notice that as the value of t stop changes, membrane potential with time also changes. We study for both leaky integrate and fire model with and without external noise current.
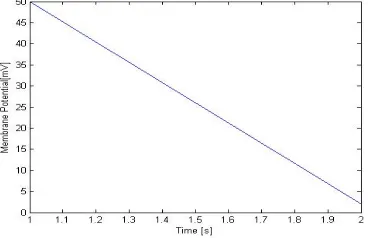
Considering leaky integrate and fire model without external noise current, keeping all parameters constant i.e. I=1 nA, C= 1 nF, R=50 M ohms and changing the value of t stop we get:
[image:3.595.90.508.292.541.2]Fig 1. For the value of tstop=2 to 7 ; we see that membrane potential increases very slightly with time linearly.
Fig 2. For the value of tstop=8 and above; we see that membrane potential increases with time at a greater speed linearly. Now, we take leaky integrate and fire model with external noise current. Keeping all parameters constant except t stop, we observe the graphs.
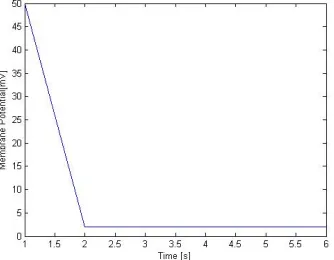
[image:3.595.209.393.586.705.2]Fig 4. For the value of tstop=3; we see that first membrane potential decreases and then remains constant for a small period of time.
Fig 5. For the value of tstop=4; the membrane potential decreases and then remains constant with time.
Fig 6. For the value of tstop=5; the change in membrane potential with time is almost same as previous graph.
Fig 8. For the value of tstop=7, the membrane potential decreases, then becomes constant and finally increases with time.
Fig 9. For tstop value=8, we see a spike in the graph.
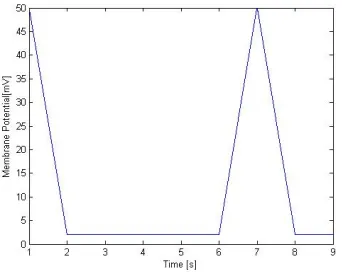
[image:5.595.217.387.580.715.2]Fig 10. For tstop value=9, we see that the spike is completely visible in the graph.
Leaky integrate and fire model shows about process information of neurons and neural systems. It illustrates how membrane potential changes with time on changing the value of t stop. Leaky integrate and fire model is basically a mathematical model as in [Eugene M. Izhikevich, 2004]. It behaves differently under different conditions. With the presence of external noise current, leaky integrate and fire model behaves totally in opposite manner. We examine that in leaky integrate and fire model without external noise current; changing the value of t stop does not have major effect on membrane potential as in [Peter Dayan et al]. We studied t stop value from 2 to 10 and observed that graph remains almost same. Instead in case of leaky integrate and fire model with external noise current; graph keeps changes. For t stop value = 2, we see that membrane potential decreases drastically with time. Taking t stop value = 3, membrane potential first decreases and then becomes constant for rest of the time period. For t stop value = 4, membrane potential remains constant for a longer time. Now for t stop value=5 and 6, the graph remains almost same as previous graph. Taking t stop value=7, we see a changed graph where membrane potential first decreases, remains constant and then increases. For t stop value= 8, we observe that a spike is formed and for t stop value=9 and above the graph remains same, where membrane potential becomes constant after a spike is formed.
V. CONCLUSIONS
Conclusion of both the graphs differs. Leaky integrate and fire model without external noise current is linear as in [Ward, L. M, 2003]. It states that the graphs obtained by changing the value of t stop is of linear type as membrane potential increases with time linearly in same fashion. But leaky integrate and fire model with external noise current is non-linear type. By changing the value of t stop the graphs obtained is different altogether, there is no symmetry. Membrane potential increases, decreases and even remains constant. Integrate and fire model is a linear and Hodgkin-Huxley model is non-linear as in [Basset,D,S., Bullmore, 2006].
REFERENCES
[1] Renaud Jolivetz, Timothy J. Lewisy and Wulfram Gerstnerz, Generalized integrate-and-_re models of neuronal
activity approximate spike trains of a detailed model to a high degree of accuracy, Laboratory of Computational Neuroscience, New York University, New York, NY 10003, USA.
[2] Skander Mensi, Richard Naud and Wulfram Gersnter, “From stochastic Non-linear integrate and fire to Generalised Linear Models”, ser. Lecture Notes in Statistics. Berlin, Germany: Springer, 1989, vol. 61.
[3] Nicolas Brunel and Peter E. Latham, “Firing Rate of the Noisy Quadratic Integrate-and-Fire Neuron, Department of Neurobiology, Los Angeles, CA 90095, U.S.A.
[4] Lukasz Wiklendt, Stephan K. Chalup, and Maria M. Seron, “Quadratic leaky integrate and fire neural networks tuned with an Evolution-Strategy for a simulated 3D biped walking controller” School of Electrical Engineering and Computer Science, Callaghan, NSW 2308, Australia.
[5] A. N. Burkitt, 2006, “A review of the integrate and fire neuron model: I. Homogeneous synaptic input ,” Biol Cybern (2006), Springer-Verlag.
[6] Arun Singh Chouhan, April – 2013, “An Analytical study of Leaky integrate and fire neuron model using MATLAB simulation” International Journal of Engineering Research & Technology (IJERT), ISSN: 2278-0181, Vol. 2 Issue 4.
[7] Jianfeng Feng, Ping Zhang, “Behavior of integrate-and-fire and Hodgkin-Huxley models with correlated inputs”, Physical Review E, Volume 63, 051902
[8] Eugene M. Izhikevich, September 2004, “Which Model to Use for Cortical Spiking Neurons?” IEEE Transactions on neural networks, Vol. 15, No. 5. [9] “Peter Dayan and L.F Abbott, “Theoretical neuroscience”, pg no. 165-175.
[10] Ward, L. M.,(2003).Trends in Cognitive Sciences.Journal of Elsevier,Vol. 7, 553.
[11] Basset,D,S., Bullmore, E., (2006). Small world brain networks. The Neuroscientist, 12, 512-523.