5
IV
April 2017
Technology (IJRASET)
©IJRASET: All Rights are Reserved
758
Smart Garbage Collection System
Sumit Rathi1, Shivam Pande 2, Harshad Lokhande 3
1,3
Dept. of Electronics and Telecommunication Engineering, Savitribai Phule Pune University
Pune, India
Abstract: Waste collection and disposal is a complex process that requires the use of money and elaborate management of logistics. This paper will elaborate the structural design working and overall hierarchical description of the system. In this system, without making much of the alterations to the traditional garbage vehicle the proposed system could be mounted on the top of the vehicle canopy for automatically filled level detection. The design is based on two stereoscopic cameras dealing with depth ranging information for filled level detection. Based on deep simulation with image processing and trialling at day to day basis. The core of the proposed design lies depth estimation through a 3D model construction of captured image in using open source system. A tabulation of simulation data with field test experiments verify that design system works energy efficiently and in an orderly manner.
Keywords: waste management, open CV, raspberry pi, multi-stereoscopic camera, sustainability
I. INTRODUCTION
Waste, in general, appears in many different forms such as agricultural, biomedical, chemical, electronic, mineral, organic/inorganic, radioactive, and urban/municipal; etc. All of the above waste forms, apart from urban, are characterized by specific collection points, uniform, and predictable production, and equal, usually long, filling periods. On the contradictory a rundown or inappropriate urban waste collection may introduce or amplify problems disturbing the urban environment, the authorities, or even the citizens. One of the major problem raising is the remote fill-level estimation, since such a waste management could potentially lead to great improvements. Also it helps in optimizations of the overall process, to smoothen the waste collection system.
In most of the system, waste separation is done according to the type of the waste i.e. dry or wet. Similarly, the waste separation is done also on the basis of the type of garbage bin located at various locations. Over the last few decades, plenty of remedial ways were suggested dispensing with filled level detection of garbage vehicle, though it is still a tough challenge /arduous task
The detection of the fill-level for different garbage collection vehicle presents many difficulties due to the various irregularities of the bin-filling process, such as the irregular shape and the variety of the included materials. Likewise, the physical trialling with this process is difficult as the number of experiments needed to reach safe statistical deductions is very large. More challenges exist for the economical and energy efficient data aggregation from a large number of vehicles while the harsh environmental conditions (e.g., humidity, temperature, and dust) can significantly affect the sensor measurement accuracy and reliability. These challenges are being tackled with this work, which is part of the Hackathon Competition by Pune Municipal Corporation for Smart City Project[3].The existing method of waste management is considerably inefficient when the contemporary development of technology is taken into consideration [4]. There is no guarantee that worker will arrive at the right time and garbage vehicle routing & garbage disposal will do properly and regular. Hence this work is an ascend taken in the direction of automating the waste management to make it more efficient [5].
In this paper, we put forward automatic Garbage Detection level in Garbage Van with the collective use of image processing using Raspberry pi and Open CV. The rest of the paper is organized as follows. The chapter II describe related works which are waste management approaches and proposed systems or available technology. After that, our proposal method in chapter III. The Chapter IV, deals with disparity map software analysis. Finally, conclusion of the paper in Chapter V.
II. RESEARCH BACKGROUND
©IJRASET: All Rights are Reserved
759
delineated herein focuses significantly on observation of the quantity of waste created and identification of categories of fabric gift within the collected waste and proposing the implementation of a network of sensorized waste containers joined to acknowledge management system.
The EU FP7 OUTSMART project designed a mesh wireless sensing element network for Berlin, Germany [11] using a ultrasonic sensor for fill-level estimation and a wireless sensing element network supported IEEE 802.15.4 for connecting nodes with gateways through multiple short-range hops. The EU FP7 Future Cities project developed associate urban-scale living research lab within the town of port in European country. Within the context of the project, the Municipality of Port has developed an innovative waste management data collection system for observation fill-level of garbage containers.
A three-tier approach is followed additionally in [6], where multiple sensors are utilized in the lower tier: ultrasonic sensor for fill level, a load cell for weight, temperature and Humidity, Hall effect and measuring system for detecting garbage vehicle shield open or closed. The perceived values and operational parameters, like vehicle identity, date, time, and battery power level, are collected and transmitted once a canopy gap is perceived, so achieving energy-efficient, real-time fill-level reporting.
Considering proposed systems for garbage collection, the main issue lies with accurate fill-level estimation. Weigh Scale is ideal solution to measure the garbage contents, but calibration and cost of heavy duty scales leads to discourage this suggested prototype. By using sensors, the weighing is possible, but the environmental conditions, maintenance and limitations in range of sensors, applied solutions will not sustain for long term usage.To measure the depth of garbage area, the image processing can be solution. The OpenCV with real-time video capture & analysis for graph based system is feasible to implement on Android based system [12]. But the hardware cost with dual camera with recent Android OS can be costly. So, the same OpenCV can be implemented using Raspberry Pi, which will help to get clear depth mapping.
III. SYSTEM ARCHITECTURE
A. Block Diagram
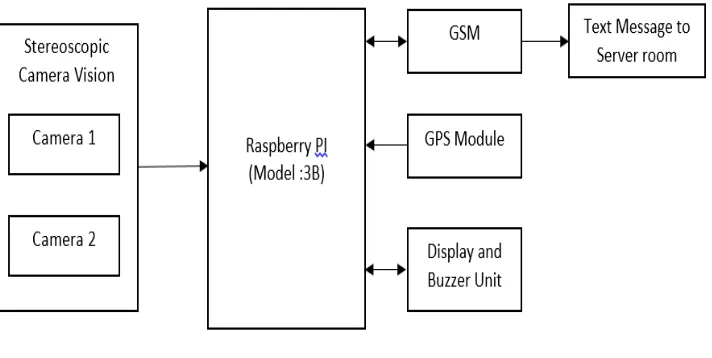
Our proposed smart garbage collection system is envisaged to be mounted on the top of garbage collection vehicle and it consists of the Raspberry pi model 3B and Multi-stereoscopic camera as well as a protective enclosure for the cameras and the raspberry pi that may optionally include an external battery source. The block diagram of system can be generalized as follows.
The block diagram shown is having stereoscopic camera vision circuit which performs all the functions of disparity map and depth analysis with distance measurement with the help of Raspberry Pi.
[image:3.612.136.492.486.665.2]Stereoscopic Camera is the system having 2 cameras of same pixel and same focal length kept at certain distance from each other. This two camera captures at the same time and process the image for further depth measurement.
Fig. 1 System Block Structure
Technology (IJRASET)
©IJRASET: All Rights are Reserved
760
Fig.2 Stereoscopic Cameras
The system implemented with Raspberry PI and Open CV shows the filled-level of Garbage Collection Vehicle Bin. Stereoscopic Camera system will capture two simultaneous images and then it will proceeds further for depth measurement. After depth measurement it is possible to know the garbage available in the garbage collection truck or it is empty. Real Time system will help the authority to know about the fulfillment of the garbage collected at any time just by placing the identity number of the truck.
The figure 3 of Jet colouring map Video shows us the colour level in which if it detects the dark object then it changes colour to red and if fair object comes in frame then it shows blue colour region other colour are in the range from red to blue. The image captured is then processed and threshold filled – level of garbage in the vehicle is estimated. The processed image of the partially or fully filled garbage vehicle is compared with preloaded empty garbage vehicle. After the whole analysis, it will further generate the text message to the Server Authority Room. If the vehicle bin full or above the defined limit of 90% then it will directly go to dumping area, otherwise the authority at the server room will reroute that garbage collection vehicle to some other nearby area so to collect the garbage and get it full up to its level and then send to dumping area.
Fig.3 jet Colour Mapping Video Analysis
The text message generated by the system as shown in fig.4 will contain the GPS coordinate as well as the time and level of garbage collected in the bin. Message will be automatically generated after filling 50% and will give the information about the partial level of the bin and to take decision for dumping the garbage or to reroute to some other nearby area. The message will also be generated after 90% so as to take decision for dumping area. Also if the authority need to know the garbage level filled in truck then the authority can raise flag to receive the level indication using text message any time. The Text message system is sent online and is completely authenticated. The message will be sent online only to the verified number by the authority. The message won’t be able to send to unknown number or it can’t get any reply back from unknown telephone number. This will help to track the garbage
Grayscale Image
©IJRASET: All Rights are Reserved
761
[image:5.612.175.454.99.326.2]
Fig.4 GSM based text message system
B. Figures and Tables
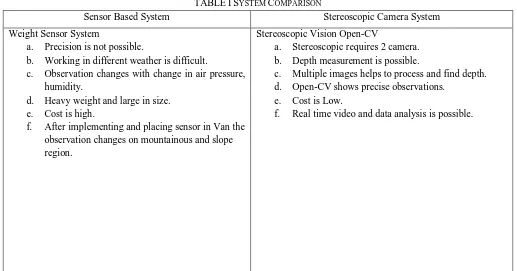
The following tables shows the comparison between the available (sensor based) systems and proposed (stereoscopic) system. TABLEISYSTEM COMPARISON
Sensor Based System Stereoscopic Camera System Weight Sensor System
a. Precision is not possible.
b. Working in different weather is difficult.
c. Observation changes with change in air pressure, humidity.
d. Heavy weight and large in size. e. Cost is high.
f. After implementing and placing sensor in Van the observation changes on mountainous and slope region.
Stereoscopic Vision Open-CV
a. Stereoscopic requires 2 camera. b. Depth measurement is possible.
c. Multiple images helps to process and find depth. d. Open-CV shows precise observations.
e. Cost is Low.
f. Real time video and data analysis is possible.
Table 1. Showing comparison between sensor based and open CV based system
C. Software Implementation
[image:5.612.48.565.370.641.2]Technology (IJRASET)
[image:6.612.100.558.63.705.2]©IJRASET: All Rights are Reserved
762
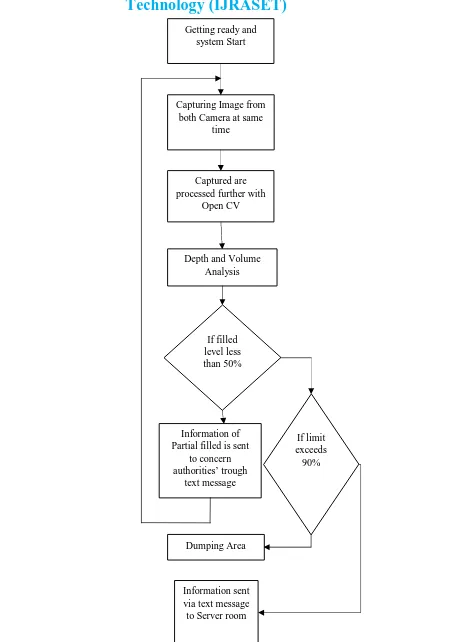
Fig. 4 flowchart of the system Getting ready and
system Start
Capturing Image from both Camera at same
time
Captured are processed further with
Open CV
Depth and Volume Analysis
If filled level less than 50%
Information of Partial filled is sent
to concern authorities’ trough
text message
If limit exceeds
90%
©IJRASET: All Rights are Reserved
763
Disparity Mapping is carried by Block matching techniques. Stereoscopic Camera captures two images simultaneously and process for depth map using Stereo Block Matching algorithm and for some cases we have to go with Semi-Global Block Matching algorithm.
Left Image Right Image
Disparity Mapping
E. Mathematical Analysis
Where:
imgL: Image capture from left camera imgR: Image capture from right camera
The Equation calculates pixel value of the computed depth map image. This value further converted for distance measurement.
Where:
D: distance of point in real world f: Focal length of camera
b: The distance between two cameras d: Pixel Value of Disparity
IV. CONCLUSIONS
Technology (IJRASET)
©IJRASET: All Rights are Reserved
764
implementation of it as well as we found the system gives adequate results with all the calculations and verified measurements. Thus a robust system is developed.
V. ACKNOWLEDGMENT
This work has been financially supported by the NBN Sinhgad School of engineering, Pune for the smart city project by the Pune municipality corporation.
REFERENCES
[1] “UBi:Ultrasonic sensor.” [Online]. Available: www.smartbin.com
[2] “U-Dump: Urban waste collection sensor.” [Online]. Available: www.urbiotica.com.
[3] https://innovate.mygov.in
[4] The EUs approach to waste management, April 2012. [Online]. Available: http://ec.europa.eu/environment/waste/index.htm
[5] H Boileau and H Bjork.[2006] Comparing household waste treatment policies between two medium size cities: Bor˚as (sweden) and chamb´ery (france),” in
Proceedings of the 7th World Congress on Recovery, Recycling and Re-integration, June 2006. [Online]. Available: http://csp.eworlding.com/3r/congress/manu pdf/420.pdf [
[6] M. A. Al Mamun, M. A. Hannan, A. Hussain, and H. Basri, “Wireless Sensor Network Prototype for Solid Waste Bin Monitoring with Energy Efficient Sensing Algorithm,” in 2013 IEEE 16th International Conference on Computational Science and Engineering, 2013, pp. 382– 387.
[7] O. M. Johansson, “The effect of dynamic scheduling and routing in a solid waste management system,” Waste Manag., vol. 26, no. 8, pp. 875–885, 2006.
[8] F. Vicentini, A. Giusti, A. Rovetta, X. Fan, Q. He, M. Zhu, and B. Liu, “Sensorized waste collection container for content estimation and collection optimization,” Waste Manag., vol. 29, no. 5, pp. 1467–1472, 2009.
[9] M. A. Hannan, M. Arebey, R. A. Begum, and H. Basri, “An automated solid waste bin level detection system using a gray level aura matrix,” Waste Manag., vol. 32, no. 12, pp. 2229–2238, 2012
[10] D. Cassaniti, “A Multi-Hop 6LoWPAN Wireless Sensor Network for Waste Management Optimization,” 2011.
[11] “EU FP7 Project: ‘Future Cities.’” [Online]. Available: http://futurecitiesproject.eu
[12] Lokhande H.N. and S. K. Shah. "AFFORDABLE EMERGENCY TELEMEDICINE SYSTEM BASED ON SMARTPHONE." International Journal of Advances in Engineering & Technology 7.2 (2014): 449.