5
XII
December 2017
Analysing Land Use/Land Cover Changes,
Prediction and Fragmentation in Jaldapara-Buxa
Forest and its Corridor, West Bengal, India, Using
Geoinformatics
Ranjana Saha1, Chandan Datta21
Department of Zoology, University of Calcutta, India 2
Vivekananda Collage for Women, University of Calcutta, India 1
School of Oceanographic Studies, Jadavpur University, India 1, 2
Nature Environment & Wildlife Society, India
Abstract: Forest fragmentation and habitat loss are the common problems and recognized as one of the key issues of the biodiversity conservation in Buxa Tiger Reserve and Jaldapara National Park, West Bengal, India. These two protected areas represent the high level of biodiversity co-existence as well as the man-wildlife conflict. These forests have witnessed a long history of forest cover change, deforestation and reforestation and forest fragmentation for the past few decades. The present study deals with the evaluation of forest cover change and predict the future status of the two protected areas and their respective corridors using Cellular Automata Markov Model and the comparison of habitat fragmentation and its change. Changes have shown during the two decades between 1995 and 2015, where large area of dense forest had been converted into plantation or open forest areas. The degradation of the forest increased in the first decade but decreased in the second decade due to some positive activity taken by the forest department. It was found that the fragmentation level of these two protected areas increased by the past two decades. The considerable changes in forest patch areas could be important features for some larger mammals and the fragmentation could affect largely in those species and also increase the rate of human-wildlife conflict. The predicted LULC map of the year 2035 shows the declining trend of dense forest area by 3.4% as well as the increase of the open forest or plantation by 1.07% respectively.
Keywords: Buxa Tiger Reserve, Jaldapara National Park, Wildlife corridor, Land use/ land cover change, Forest fragmentation, Change prediction
I. INTRODUCTION
critical impact of increasing forest fragmentation and wildlife corridor loss (Nagendra et al. 2009).This present study evaluates forest cover change and predicts the future status of the two protected areas and their respective corridors using CA Markov Model and the comparison of habitat fragmentation and its change.
II. STUDYAREA
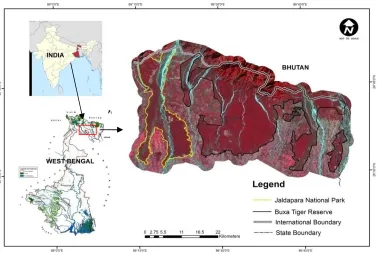
Located at the moist tropical and sub-tropical forest area at the foothills of Eastern Himalayas, the Terai-Dooars area of the Northern West Bengal, in the newly formed district of Alipurduar. Buxa Tiger Reserve is located between latitude 23°30’ N to 23°50’ N and longitude 89°25’ E to 89°55’ E with a total area of 760.87 km2 including 390.58 km2 core area and 370.28 km2 buffer area. Buxa Tiger Reserve (BTR) was included in project tiger and declared as a tiger reserve in 1983, eventually in 1992, 117.23 km2 area was denoted as National Park. The entire protected restricted to the Indo-Bhutan border in the North along with Sinchula Hills (Bhutan hills) to the Sankosh River along with the Assam border in the West.
To the west is located the Jaldapara National Park, formerly known as Jaldapara Wildlife Sanctuary with an area of 217 km2 and lies between latitude 89°15’ N to 89°35’ N and longitude 26°30’ E to 26°48’E. In 2012 it was notified as a National Park from a Wildlife Sanctuary.
The study area was declared as the Eastern Dooars Elephant Reserve in 2002.
The whole forest region is rich with biodiversity and has a mixture of natural and manmade forests with a great collection of rare and medicinal plants. Vegetation types according to Champion and Seth (1968) : (1) Evergreen Forests (Northern tropical evergreen forest); (2) Semi-Evergreen Forests (Eastern sub-montane semi-evergreen forest); (3) Hill Forests (East Himalayan subtropical wet hill forest); (4) Wet Mixed Deciduous Forest (Sub-Himalayan secondary wet mixed forest); (5) Dry Mixed Forests (East Himalayan moist mixed deciduous forest); (6) Sal Forests (Eastern Bhabar and Terai sal); (7) Riverine Forests (Northern dry deciduous forest); (8) Savanna (Moist sal savanna and low alluvium savannah woodland); and (9) Grassland (Eastern alluvial grassland) are found in these region.
Along with the rich plant diversity these forests harbor a wide range of animal diversity including several endemic and endangered species. In BTR 68 species of mammals, 41 species of reptiles, more than 246 species of birds, 4 species of amphibian along with 73 species of fishes can be found. The Clouded leopard (Neofelis nebulosa), Chinese pangolin (Manis pentadactyla), Reticulated python (Python reticulatus) are endemic to BTR.
[image:3.612.126.503.463.720.2]Jaldapara is famous for the home of Indian One-Horned Rhino (Rhinoceros unicornis). Other than this Bengal tiger, Leopard, Leopard cat, Fishing cat and Indian Fox etc. can be found among carnivorous and Elephant, Gaur, Sambar, Chital, Wild boar, Hog deer (Axis porcinus) found in the herbivores.
A. Conflict in Study Area
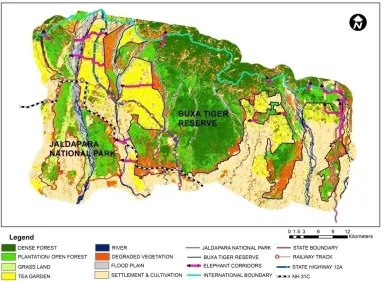
[image:4.612.123.504.198.480.2]This area has been affected of habitat fragmentation and loss and forest degradation for the past few years. And the forest fragmentation leads large forest cover area into small patches. This area has been marked as the high degree human-wildlife conflicted zone, as from 2005, after broad gauging the Siliguri-Alipurduar Dooars rail line so many wildlife death and injury have been take place. Unfortunately the inter-departmental blame game which follows every incident of wildlife death precludes any serious steps been taken to prevent these kinds of incidents. And not only the railway line also some major roads like National Highway 31c which is the connector of West Bengal and Assam runs between the core area of these two forests. And the State Highway 12A also passes through the forest core area (Fig.2).
Fig. 2 Disturbance in Study Area (*Elephant Corridor maps as per Roy. M, 2015)
III.MATERIALSANDMETHODS
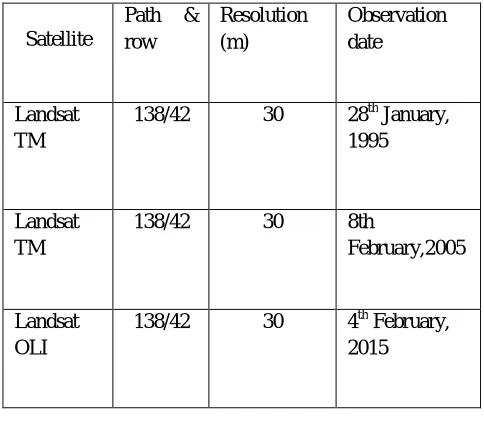
Temporal remote sensing imagery taken in 1995, 2005 and 2015, registered to UTM Zone 45 N projection and WGS 84 datum has been used for the land use land cover change study (TABLE I). When downloading have ensure that the images are completely cloud free as the seasons are choose following the rainy season. ERDAS Imagine 9.1, 14, ArcGIS 10.3 and IDRISI Selva 17.00 software has been used for image processing and mapping. Information of the patches and the degree of fragmentation has been measured by the software FRAGSTATS 4, a spatial pattern analysis program for categorical and continuous maps (McGarigal et al, 2012.) in this study. In this software they suggested that class value can be used as indicator for fragmentation as the class value can separately quantify the amount and distribution of each class and thus can measure the fragmentation of particular forest class (Midha and Mathur, 2010).
A. Data Used
B. Fragmentation Matrix
The LULC maps of all the above mentioned years have been used to measure the fragmentation at class level. Out of 8 land use land cover classes 6 classes have been used to explain the degree of fragmentation and its changing pattern. At the class level metrics four indicators have been adopted.
1) Mean Patch Area (MPA): Average patch area for the class, in Hectares.Smaller MPA of similar patches in a forest indicates greater fragmentation.
2) Patch Density (PD): Number of patches per Hectare. Increase in patch density over the time signifies fragmentation.
3) Mean Nearest Neighbour Distance (MNN): Average nearest neighbour distance. It is an indicator of proximity or isolation.MNN equals the minimal distance to the nearest neighbouring patch of the same type, based on shortest edge-to-edge distance. Decreasing pattern of MNN indicates more fragmented forest classes.
4) Interspersion-Juxtaposition Index (IJI): Measure the degree of patch adjacency among classes in percentage. C. CA Markov Model
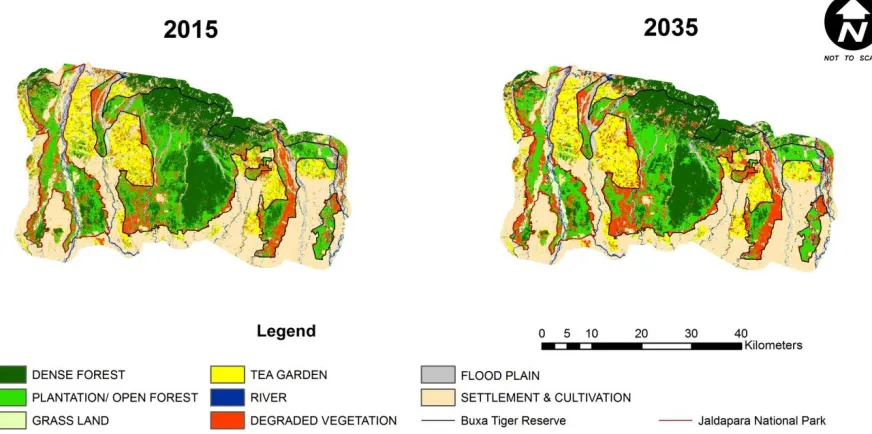
[image:5.612.185.427.297.511.2]The land use/land cover maps of 1995 and 2015 have been used to generate a probability matrix and analysing a probable map of the year 2035 by using CA Markov Model.
TABLE IIsatellite data used in lulc classification
IV. RESULTS
A. Landscape Matrix
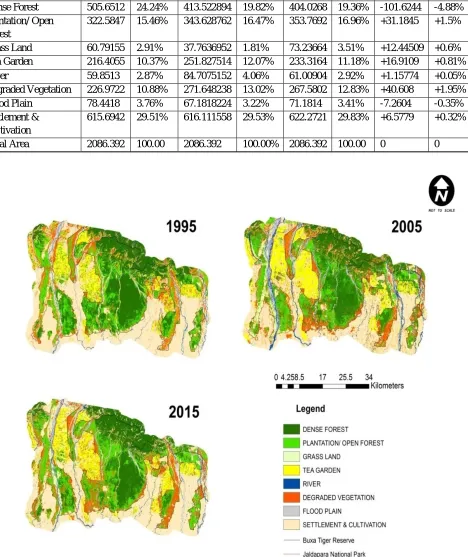
In the result of the classification of land use land cover, showing that the dense forest cover had been reducing day by day. While 24.24 % of the total area was dense forest in 1995 but it’s been reduced to 19.82 % of total area in 2005 and 19.36 % as on 2015. But interestingly while the dense forest cover decreases the plantation/ open forest cover has been increases at the very same time period. Between 1995 and 2015 the plantation has a huge increase as 15.46 % to 16.96% of the total area. The grass land area is been increased in 2015 especially in the Jaldapara National Park due to some activities taken by the State Forest Department to the mega herbivores conservation. The tea gardens which are also playing as a vital wildlife corridor increased in 2005 but decreases in 2015 as many of these estates are running poorly or been closed by the authority in recent days. Degraded vegetation was increased from 10.88 % to 13.02 % in 2005 but decreased as 12.83 % in 2015. And last but not in the least, settlement & cultivation has been increase as per expectations in the 20 years lap. As in 1995, 29.51 % of total area covers the settlement & cultivation, 29.53 % in 2005 and 29.83% in 2015 (Table II).
Accuracy assessment of the year 2015 has been measured through matrix using 2015 classification and reference image individual accuracy.
1) Overall accuracy (n) = 75.609% 2) Overall Kappa Value (K) = 0.71
Satellite
Path & row Resolution (m) Observation date Landsat TM
138/42 30 28th January,
1995
Landsat TM
138/42 30 8th
February,2005
Landsat OLI
138/42 30 4th February,
TABLE IIII Area statistics of BTR, JNP and its corridor during 1995, 2005 and 2015
Fig. 3 Land use land cover classification of Jsldapara-Buxa corridor in 1995, 2005 and 2015
1995 2005 2015 Change of
area (sq. Km) 1995 to 2015
Change of area (%) Land cover type Area (sq.
km)
Area (%)
Area (sq. km)
Area (%)
Area (sq. km)
Area (%)
Dense Forest 505.6512 24.24% 413.522894 19.82% 404.0268 19.36% -101.6244 -4.88%
Plantation/ Open Forest
322.5847 15.46% 343.628762 16.47% 353.7692 16.96% +31.1845 +1.5%
Grass Land 60.79155 2.91% 37.7636952 1.81% 73.23664 3.51% +12.44509 +0.6%
Tea Garden 216.4055 10.37% 251.827514 12.07% 233.3164 11.18% +16.9109 +0.81%
River 59.8513 2.87% 84.7075152 4.06% 61.00904 2.92% +1.15774 +0.05%
Degraded Vegetation 226.9722 10.88% 271.648238 13.02% 267.5802 12.83% +40.608 +1.95%
Flood Plain 78.4418 3.76% 67.1818224 3.22% 71.1814 3.41% -7.2604 -0.35%
Settlement & Cultivation
615.6942 29.51% 616.111558 29.53% 622.2721 29.83% +6.5779 +0.32%
[image:6.612.80.548.146.703.2]TABLE IVII land cover change analysis
B. Fragmentation Analysis
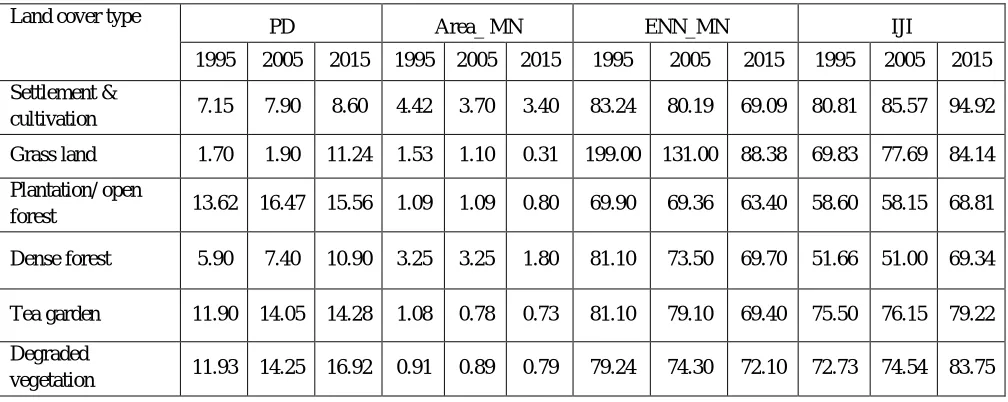
The analysis of the fragmentation shows clearly the corridor fragmentation between BTR and JNP. From Table IV it is clear that the fragmentation rate in plantation / open forest in 1995 was high with the highest patch density, lowest mean patch area, less mean nearest neighbour distance (patches became smaller) and less Interspersion –Juxtaposition Index (distances are more in forest patches). And the rate of fragmentation is increases in 2005 and 2015 eventually (though the patch density decrease and IJI value increase in 2015 but the overall value indicates the increasing fragmentation).In contrast the grass land shows less fragmented in 1995 but increased suddenly in 2015. While dense forest shows a moderate fragmentation rate but increasing eventually. And the tea garden and degraded forest shows the same level of fragmentation which is quite high and is in increasing rate.
TABLEVV FRAGMENTATION MEASUREMENT ANALYSIS
Change analysis of land use land cover
Year 1995 to 2005 Year 2005 to 2015 Area (sq.
km)
Area (%) Area (sq. km)
Area (%) Dense to plantation/ open forest 99.37485096 4.76% 82.2038448 3.94%
Dense to grass land 1.18924344 0.06% 1.94034456 0.09%
Plantation/ open forest to degradation
72.35398817 3.47% 45.65025696 2.19%
Dense forest to degradation 45.94235184 2.20% 17.90124336 0.86%
Grass land to degradation 5.167992984 0.25% 13.9788264 0.67%
Reforestation 109.0849193 5.23% 195.5157943 9.37%
Agriculture to tea garden 70.75789829 3.39% 46.04667144 2.21%
Forest to settlement & cultivation
29.0279719 1.39% 18.5688888 0.89%
Plantation/ open forest to dense forest
53.18004569 2.55% 65.59616448 3.14%
Tea garden to degradation 90.12378883 4.32% 84.77010696 4.06%
Grassland to plantation 1.79429712 0.09% 8.9714856 0.43%
No change 1508.394651 72.30% 1505.248372 72.15%
Total 2086.392 100 2086.392 100
Land cover type
PD Area_ MN ENN_MN IJI
1995 2005 2015 1995 2005 2015 1995 2005 2015 1995 2005 2015
Settlement &
cultivation 7.15 7.90 8.60 4.42 3.70 3.40 83.24 80.19 69.09 80.81 85.57 94.92
Grass land 1.70 1.90 11.24 1.53 1.10 0.31 199.00 131.00 88.38 69.83 77.69 84.14
Plantation/ open
forest 13.62 16.47 15.56 1.09 1.09 0.80 69.90 69.36 63.40 58.60 58.15 68.81
Dense forest 5.90 7.40 10.90 3.25 3.25 1.80 81.10 73.50 69.70 51.66 51.00 69.34
Tea garden 11.90 14.05 14.28 1.08 0.78 0.73 81.10 79.10 69.40 75.50 76.15 79.22
Degraded
[image:7.612.55.559.510.711.2]C. Change Prediction
The transitional area matrix of Jaldapara-Buxa corridors clearly shows that the probability of dense forest remaining the same class is 0.60 in year 2035 and the probability of conversion of dense forest to the plantation/ open forest and degraded vegetation is 0.25 and 0.06. The probability of dense forest converted to settlement and cultivation is 0.029 and tea garden is 0.03, where the other possible classes like grassland, river and flood plain conversion is substantially less (Table V). The probability of the percentage of the dense forest is decrease from 19.36% to 15.96% and the total plantation/ open forest area probability increase from 16.96% to 18.03% as well as the probability of degraded vegetation is likely to be increase from 12.83% to 14.33% by the year 2035 respectively (Table VI).
TABLEV TRANSITIONAL AREA MATRIX
TABLEVI AREA STATISTICS OF 2015 TO 2035
2015
2035
DF P/O GL TG R DV FP S & C NC
DF 0.6019 0.2543 0.0064 0.0366 0.0102 0.0603 0.0011 0.029 0.0003
P/O 0.1387 0.4562 0.015 0.0899 0.0113 0.2452 0.0077 0.036 0.0001
GL 0.0036 0.04 0.1943 0.0607 0.0942 0.1978 0.1755 0.234 0.0003
TG 0.0498 0.1568 0.0339 0.3989 0.0119 0.213 0.0103 0.125 0.0001
R 0.0579 0.0242 0.1012 0.0336 0.2033 0.0625 0.1681 0.349 0.0004
DV 0.0338 0.1655 0.0763 0.1413 0.0374 0.304 0.0511 0.19 0.0001
FP 0.03 0.0109 0.1096 0.0423 0.1218 0.0694 0.2932 0.323 0.0003
S & C 0.0102 0.0354 0.0363 0.1133 0.0412 0.0684 0.0305 0.664 0.0004
NC 0.0103 0.0055 0.0057 0.0083 0.0044 0.0067 0.0027 0.057 0.8995
DF= Dense forest, P/O= Plantation/ Open Forest, GL= Grass land, TG= Tea garden, R= River, DV= Degraded Vegetation, FP= Flood Plain, S & C= Settlement & Cultivation, NC= No change
LAND COVER TYPE
2015 2035 CHANGE OF
AREA (sq. km) CHANGE OF AREA (%) Area (sq.
km) Area (%)
Area (sq.
km) Area (%)
Dense forest 404.0268 19.36% 332.9024 15.96% -71.1244 -3.4%
Plantation/ open forest
353.7692 16.96% 376.2184 18.03% +22.4492 +1.07%
Grass land 73.23664 3.51% 84.18097 4.03% +10.94433 +0.52%
Tea garden 233.3164 11.18% 241.0352 11.55% +7.7188 +0.37%
River 61.00904 2.92% 62.18766 2.98% +1.17862 +0.06%
Degraded vegetation 267.5802 12.83% 299.0044 14.33% +31.4242 +1.5%
Flood plain 71.1814 3.41% 67.2356 3.22% -3.9458 -0.19%
Settlement & cultivation
622.2721 29.83% 623.6272 29.89% +1.3551 +0.06%
Fig. 4 Predicted land use land cover classification of 2035
V. DISCUSSION
Anthropogenic habitat loss and fragmentation have been implicated as among the key drivers of the burgeoning global biodiversity crisis. The current remote sensing technology to predict this destruction of wildlife corridors has become one of the important factors. The fragmentation between the protected areas makes the wildlife habitats into smaller patches, inhibits the free movement of species and isolated it. The present study reveals the rapid land use change from 1995 to 2015 where dense forest decreased by 4.88% while plantation/open forest, grassland, degraded vegetation and settlement & cultivation increased by 1.5%, 0.6%, 1.95% and 0.32% respectively. These rapid loss of wildlife habitat trend is also continued in 2035 probabilities, where the predicted LULC map of the year 2035 shows the declining trend of dense forest area by 3.4% from the year 2015 as well as the increase of the open forest or plantation, degraded vegetation by 1.07% and 1.5% respectively.
VI.CONCLUSIONS
From the above study it indicates that the both protected areas and its adjoining corridor experiencing a massive corridor loss in past 10 years due to continuous biotic pressures. The corridor is fragmented by busy railway tracks, National Highway 31C and State Highway 12A with heavy traffic movements, tea gardens etc. Animal casualties by the train and by road accident took place frequently. Not only the small animals but also large mammals like Elephant, Gaur, Leopard even Royal Bengal tiger casualties have been recorded. The result of this study shows the increasing fragmentation rate with continuous corridor loss with extend to the future prediction probabilities of further destruction of corridors.
REFERENCES
[1] Jensen, J. R. (2009). Remote Sensing of the environment, an earth resource perspective.
[2] De, A. and Tiwari, A.K. (2008). “Estimation of Patchiness: A Measure of Fragmentation in the Rajaji-Corbett National Parks and Adjoining Areas, Uttarakhand, India”, International Journal of Ecology and Environmental Sciences, 34 (4): 345-349.
[3] Khanna, V., Ravichandran, M. S. and Kushwaha, S. P. S. (2001). “Corridor analysis in Rajaji-Corbett Elephant Reserve: A Remote Sensing and GIS approach”. Journal of the Indian Society of Remote Sensing, 29: 41- 46.
[4] Midha, N. and Mathur, P.K. (2010). “Assessment of Forest Fragmentation in the Conservation Priority Dudhwa Landscape, India using FRAGSTATS Computed Class Level Metrics”. Journal of the Indian Society of Remote Sensing, 38: 487-500.
[5] Nagendra, H., Paul, S., Pareeth, S. (2009). “Landscapes of Protection: Forest Change and Fragmentation in Northern West Bengal, India”. Environmental Management,44:853.
[6] Roy, M., Sukumar, R. (2015) “Elephant corridors in Northern West Bengal”. Gajah, 43: 26-35.
[7] Saikia, A., Hazarika, R. and Sahariah, D. (2013). “Land-use/land-cover change and fragmentation in the Nameri Tiger Reserve, India”, GeografiskTidsskrift-Danish Journal of Geography, 113:1, 1-10.
[9] Sudhakar, S., Sridevi, G., Ramana, I.V., Rao, V. Venkateswara., Raha, A.K. (1999). “Techniques of Classification for Landuse/Landcover with Special Reference to Forest Type Mapping in Jaldapara Wildlife Sanctuary, Jalpaiguri District, West Bengal- a Case Study”, Journal of the Indian Society of Remote Sensing, vol.27, no. 4, 217-224.
[10] Uddin, K., Chaudhary, S., Chettri, N., Kotru, R., Murthy, M., Chaudhary, R. P., Ning, W., Shrestha, S. M., Gautam, S. K. (2015). “The changing land cover and fragmenting forest on the Roof of the World: A case study in Nepal’s Kailash Sacred Landscape”, Landscape and Urban Planning, 141: 1–10.
[11] Vogt, P., Kurt, H.R., Iwanowski, M., Estreguil, C., Jacek, K. & Pierre, S. (2007). Mapping landscape corridors, northern Slovakia (Europe). Ecological Indicators. 7, 481–488.
[12] Yadav, P. K., Kapoor, M., Sarma, K. (2012). “Land Use Land Cover Mapping, Change Detection and Conflict Analysis of Nagzira-Navegaon Corridor, Central India Using Geospatial Technology”, International Journal of Remote Sensing and GIS, Volume 1, Issue 2, 90-98.
[13] McGarigal, K., SA Cushman, and E Ene. (2012).FRAGSTATS v4: Spatial Pattern Analysis Program for Categorical and Continuous Maps. Computer software program produced by the authors at the University of Massachusetts, Amherst. Available at the following web site:http://www.umass.edu/landeco/research/fragstats/fragstats.html
[14] Roy, M. (2009). “Habitat use and foraging ecology of the Asian elephant (Elephas maximus) in Buxa Tiger Reserve and adjoining areas of northern West Bengal”, Ph.D. thesis, Department of Zoology Vidyasagar University, Paschim Medinipur, West Bengal, India.
[15] Champion, H.G. and Seth, S.K. (1968). “A Revised survey of forest types of India”, New Delhi, Government of India Publication.