Effect of Process Parameters and Optimization
of MRR in Turning of EN8 Steel on CNC Lathe
using Response Surface Methodology
Romesh Varma1, Pavan Agrawal2, Promise Mittal3 1,2,3
Department of Mechanical Engineering, Vikrant Institute of Technology& Management, Gwalior
Abstract: In order to meet the increasing demand of manufacturing complicated components of high accuracy in large quantities, sophisticated technological equipment and machinery have been developed. The CNC machines often employ the various mechatronics elements that have been developed over the years. The control of a machine tool by means of stored information through the computer is known as Computer Numerically Controlled. In this work, turning operation has been carried out on CNC lathe machine. EN 8 steel bright bars have been used for the experimental analysis. The aim of this research is to optimize the three process parameters such as cutting speed, depth of cut and feed rate for the maximum value of MRR. Response Surface methodology of Design of Experiment (DOE) has been applied for getting the combination of parameters for the experiments. Stat graphics Centurion VI software has been used for the analysis of results and optimizing the response i.e. MRR by applying Response Surface Methodology. Analysis of Variance (ANOVA) has been done with the help of Minitab-18 software to investigate the contribution of process parameters in MRR. The results from ANOVA table show that the depth of cut contributes more than the remaining factors. The ANOVA also investigates that depth of cut and cutting speed are significant factors and feed rate is not that significant in Material Removal Rate. A mathematical model based on Regression analysis has been developed for predicting the MRR. This model gives the linear equation of MRR in terms of cutting speed, depth of cut and feed rate. Results from this model show that the predicted values of MRR are very close to experimental values and the percentage error for the optimum set of parameters is very less.
Keywords: CNC, Turning, MRR, ANOVA, DOE, Depth of cut
I. INTRODUCTION
In order to meet the increasing demand of manufacturing complicated components of high accuracy in large quantities, sophisticated technological equipment and machinery have been developed. The CNC machines often employ the various mechatronics elements that have been developed over the years. The control of a machine tool by means of stored information through the computer is known as Computer Numerically Controlled. The turning machines are, of course, every kind of lathes. Lathes used in manufacturing can be classified as engine, turret, automatics, and numerical control etc. They are heavy duty machine tools and have power drive for all tool movements. They commonly range in size from 12 to 24 inches swing and from 24 to 48 inches centre distance, but swings up to 50 inches and centre distances up to 12 feet are not uncommon. Many engine lathes are equipped with chip pans and built-in coolant circulating system. Turning is the removal of metal from the outer diameter of a rotating cylindrical work piece. Turning is used to reduce the diameter of the work piece, usually to a specified dimension, and to produce a smooth finish on the metal. Often the work piece will be turned so that adjacent sections have different diameters.
by statistical techniques. Response surface methodology uses statistical models, and therefore practitioners need to be aware that even the best statistical model is an approximation to reality
II. EXPERIMENTALSETUPANDMETHODOLOGY
A. Design of Experiment
The design of experiments technique is very powerful tool, helped not only in modelling and also helped analysing the effect of process variables on the response variables. The response variable (or parameter of interest) is an unknown function of the process variables (or controllable parameters or as design factors). A Stat graphics generated design was used with three levels of each of the three design factors. The process variables along with their values on different levels are listed in the tables which shown later. The number of experiment was 27 for each set of variable factors.
B. Steps for the Experiments
1) Inspection and preparing the CNC lathe MCL 12 ready to perform the machining operation. 2) Designing the program using M-Codes and G-codes on CNC lathe MCL 12 machine 3) Cutting EN8 bright bars by power saw to get desired dimension of the work pieces 4) Calculating diameter of each specimen by the high precision vernier caliper. 5) Experiment has been designed using RSM technique of design of experiment.
6) Perform turning operation on work piece in selected cutting process parameters like: cutting speed (A), feed rate (B) and depth of cut(C) on the basis on DOE table.
7) Measured diameter of each machined bar by vernier caliper. 8) Calculate the MR
9) Optimize the results with RSM technique.
C. Experimental Setup
Experiments have been performed on a CNC MCL12 2D machine manufactured by 3D Technologies. EN8 Bright bars of medium carbon steel alloy of diameter 20 mm and length 1200 mm have been used as material. En8 bright bar has high tensile strength and used as shafts, Gears, studs, Bolts, Keys etc. EN8 is a graded and is readily machinable in any condition. Its surface hardness to increase wear resistance is in the range of 50-55 HRC via induction process.
D. Process Variables and their Levels
The experiments are performed on CNC lathe MCL 12 selected. The tool and material selected were carbide tool and EN8 Bright bar respectively. Three process parameters which are cutting speed, depth of cut and feed rate have been decided in the study.
Table1. Parameters and Their Levels for Experiment
E. Material Removal Rate
The MRR (Material Removal Rate) in straight turning operation is the quantity of material per unit metal is removed in unit time in mm3/min. The value of MRR can be found manually with the help of given equation.
MRR= п Davg d f N
Davg= average dia of work piece(Do+Df)/2, d= Depth of cut, f= Feed rate, N= RPM
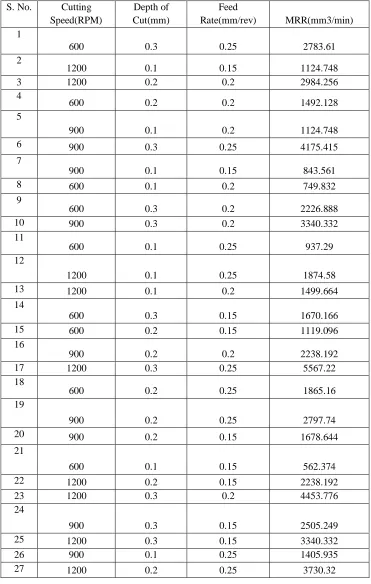
F. Experimental Details and Data Collection
Experiments have been carried out using RSM technique, experimental design which consists of 27 combinations of cutting speed (A), feed rate (B) and depth of cut(C). EN8 bright bars (of diameter 20mm and length 1200mm) required for conducting the
S.No Parameter L1 L2 L3
1 Cutting speed(A)(RPM) 600 900 1200 2 Feed Rate(B)(mm) 0.15 0.20 0.25 3 Depth of
Cut(C)(mm/rev.)
experiment have been prepared first. Then, using different levels of the process parameters 27 specimens have been turned accordingly on CNC lathe machine. After machining, diameter of each machined parts have been again measured precisely with the help of the vernier calipers. The results of the experiments have been shown in Table by using material removal rate calculations.
Table 2. Observation table S. No. Cutting
Speed(RPM)
Depth of Cut(mm)
Feed
Rate(mm/rev) MRR(mm3/min) 1
600 0.3 0.25 2783.61
2
1200 0.1 0.15 1124.748
3 1200 0.2 0.2 2984.256
4
600 0.2 0.2 1492.128
5
900 0.1 0.2 1124.748
6 900 0.3 0.25 4175.415
7
900 0.1 0.15 843.561
8 600 0.1 0.2 749.832
9
600 0.3 0.2 2226.888
10 900 0.3 0.2 3340.332
11
600 0.1 0.25 937.29
12
1200 0.1 0.25 1874.58
13 1200 0.1 0.2 1499.664
14
600 0.3 0.15 1670.166
15 600 0.2 0.15 1119.096
16
900 0.2 0.2 2238.192
17 1200 0.3 0.25 5567.22
18
600 0.2 0.25 1865.16
19
900 0.2 0.25 2797.74
20 900 0.2 0.15 1678.644
21
600 0.1 0.15 562.374
22 1200 0.2 0.15 2238.192
23 1200 0.3 0.2 4453.776
24
900 0.3 0.15 2505.249
25 1200 0.3 0.15 3340.332
26 900 0.1 0.25 1405.935
III.RESULTSANDDISCUSSIONS
A. Analysis of Experiments
For the analysis purpose the Stat graphics software has been used. The value of MRR has been calculated with the assist of equation number 3.8 and has been optimized with the assist of RSM optimization technique.
1) Least Square Means for MRR: It shows the usual error of each mean, which is a measure of its sampling variability. The rightmost two columns show 95.0% confidence intervals for each of the means. You can display these means and intervals by selecting Means Plot from the list of Graphical Options. This given table shows the mean MRR for each level of the factors.
Table 3 Least Squares Means for MRR with 95.0% Confidence Intervals
Level Count Mean Stnd.
Error
Lower Limit
Upper Limit GRAND MEAN 27 2234.42
Cutting Speed
600 9 1489.62 129.977 1218.49 1760.74
900 9 2234.42 129.977 1963.3 2505.55
1200 9 2979.23 129.977 2708.1 3250.36
Depth of Cut
0.1 9 1124.75 129.977 853.62 1395.88
0.2 9 2238.19 129.977 1967.06 2509.32
0.3 9 3340.33 129.977 3069.2 3611.46
Feed Rate
0.15 9 1675.82 129.977 1404.69 1946.95
0.2 9 2234.42 129.977 1963.3 2505.55
0.25 9 2793.03 129.977 2521.9 3064.16
2) Analysis of Variance of MRR: The given ANOVA table partitions the inconsistency in MRR into separate pieces for each of the effects. It then tests the statistical significance of each effect by comparing the mean square against an estimation of the experimental error. In this case, 6 effects have P-values a lesser amount of than 0.05, representing that they are notably different from zero at the 95.0% confidence level.
Table 4 Analysis of Variance for MRR
Source DF Adj SS Adj MS F-Value P-Value
Cutting Speed 2 9985301 4992651 32.84 0.000
Depth of Cut 2 22089848 11044924 72.64 0.000
Feed Rate 2 5616732 2808366 18.47 0.000
Error 20 3040928 152046
Total 26 40732809
S R-sq R-sq(adj) R-sq(pred)
389.931 92.53% 90.29% 86.39%
contribution factor of cutting speed is 32.84% so it has less effect on the MRR than depth of cut. On the contrary, feed rate has insignificant effect on MRR
B. Main Effects of MRR
[image:6.612.169.415.183.336.2]As it is mentioned that there are three variables, which were taken in the analysis to evaluate the maximum MRR (Material Removing Rate) in the turning operation. It is also desirable to evaluate that which variables have the maximum contribution in it. And with the help of software it is now easy to plot a graph which shows all three variables and their effects on the MRR.
Figure 1. Effect of three variables on MRR
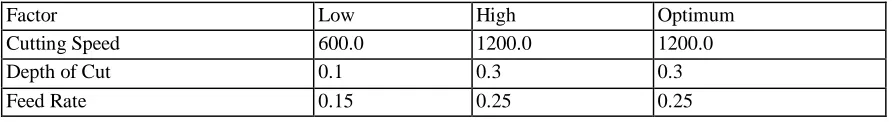
C. Optimization of MRR
This table shows the combination of factor levels which maximizes MRR over the indicated region. Use the Analysis Options dialog box to indicate the region over which the optimization is to be performed. It could possible to set the value of one or more factors to a constant by setting the low and high limits to that value.
Table 4.4 Optimized value of MRR
Factor Low High Optimum
Cutting Speed 600.0 1200.0 1200.0
Depth of Cut 0.1 0.3 0.3
Feed Rate 0.15 0.25 0.25
Optimum value of MRR for the given optimum set of parameters = 5476.16 mm3/min.
D. Development of Mathematical Model
Regression analysis is carried out to establish the relationship between factors and MRR. While performing the regression analysis, it has been assumed that factors and the response are linearly related to each other. A multiple regression analysis has been used to formulate the Cutting speed, depth of cut and feed rate to the MRR.
The response function, which represents the MRR, can be expressed as:
MRR = f (cutting speed, depth of cut, feed rate)
Taking into consideration linearity of response, a linear polynomial equation is fitted to experimental results. The general form of a regression mathematical model is as follow:
y= b0 + b1x1 + b2x2 + b3x3……… (1)
where, y is response,b0, b1, b2and b3 are regression coefficient andx1, x2, x3 are process parameters i.e. wheel speed, depth of cut and
table speed respectively. The coefficients values are calculated using Minitab -18 software. Using these values regression model is developed as shown below: This predicted equation is also written as:
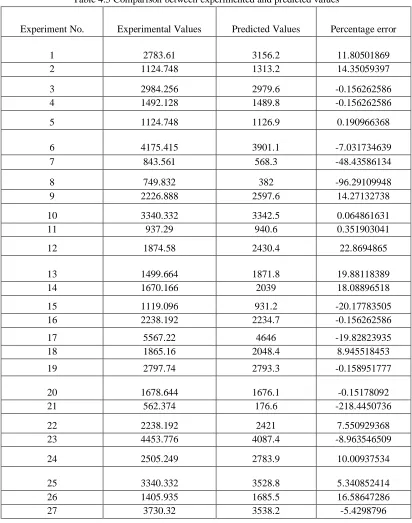
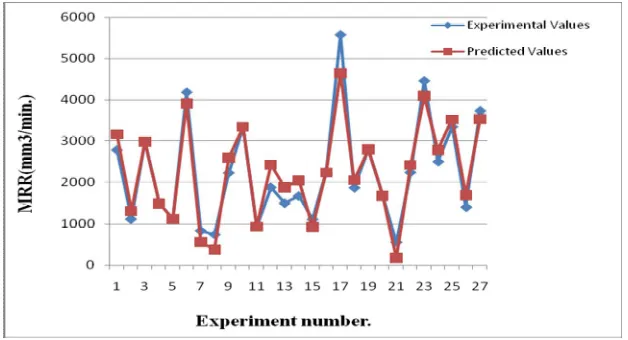
[image:6.612.84.530.441.502.2]E. Comparison b/w Experimental and Predicted Values
[image:7.612.100.512.136.659.2]The predicted values have been compared with the experimental values for all set of experiments. The percentage error has been also calculated. The table which is shown below gives the Predicted values, Experimental values and Percentage error.
Table 4.5 Comparison between experimented and predicted values
Experiment No. Experimental Values Predicted Values Percentage error
1 2783.61 3156.2 11.80501869
2 1124.748 1313.2 14.35059397
3 2984.256 2979.6 -0.156262586
4 1492.128 1489.8 -0.156262586
5 1124.748 1126.9 0.190966368
6 4175.415 3901.1 -7.031734639
7 843.561 568.3 -48.43586134
8 749.832 382 -96.29109948
9 2226.888 2597.6 14.27132738
10 3340.332 3342.5 0.064861631
11 937.29 940.6 0.351903041
12 1874.58 2430.4 22.8694865
13 1499.664 1871.8 19.88118389
14 1670.166 2039 18.08896518
15 1119.096 931.2 -20.17783505
16 2238.192 2234.7 -0.156262586
17 5567.22 4646 -19.82823935
18 1865.16 2048.4 8.945518453
19 2797.74 2793.3 -0.158951777
20 1678.644 1676.1 -0.15178092
21 562.374 176.6 -218.4450736
22 2238.192 2421 7.550929368
23 4453.776 4087.4 -8.963546509
24 2505.249 2783.9 10.00937534
25 3340.332 3528.8 5.340852414
26 1405.935 1685.5 16.58647286
27 3730.32 3538.2 -5.4298796
Figure 2. Differences between experimental and predicted values
IV.CONCLUSIONS
Following conclusions have been drawn on the basis of experimental analysis
A. The effects of process parameters – cutting speed, depth of cut and feed rate have been analysed, and it has been found that all the factors contribute in obtaining maximum MRR but depth of cut plays an important role out all three variables.
B. Mathematical model has been evaluated using regression analysis to compare the experimental value with the predicted value and this model shows that the predicted values the much closer to experimental values and the percentage error for the optimum of MRR is minimum.
C. Response Surface Methodology has been applied to optimize the results. The optimum set of parameters are cutting speed - 1200 rpm, depth of cut – 0.3 mm & feed rate – 0.25 mm/rev. and the optimum value of MRR is 5476.16 mm3/min.
D. The contribution factor of depth of cut is higher than others i.e. 72.64%.the contribution factor of cutting speed is 32.84% so it has less effect on the MRR than depth of cut. On the contrary, feed rate has insignificant effect on MRR.
REFERENCES
[1] Gowd G. H., Vali SS., Ajay V., Mahesh GG., 2014, “Experimental investigation and effects of cutting variables on MRR and tool wear for AISI S2 tool steel”, AMME-2014, 5, pp. 1398-1407
[2] Ram Sonu, Yadav Raj kumar, 2016, “Optimization of Machining Parameters In Turning Of En-31 Alloy Steel Using Response Surface Methodology”, Icristme-16, pp. 402-414.
[3] Poornima, Sukumar., (2012), “Optimization of Machining Parameters In Cnc Turning Of Martensitic Stainless Steel Using Rsm And Ga.” International Journal of Modern Engineering Research. 2(2), pp-539-542.
[4] Sayak Mukherjee, Anurag Kamala, Kaushik Kumar, 2014, “Optimization Of Material Removal Rate During Turning Of Sae 1020 Material In Cnc Lathe Using Taguchi Technique”, GCMM 2014, 97, pp. 29 – 35.
[5] Sahoo P., Barman T. K. and Routara B. C., 2008, “Taguchi based practical dimension modeling and optimization in CNC turning”, Advance in Production Engineering and Management, 3(4), pp. 205-217.
[6] Tarng.Y.S , S.C. Juang and C.H. Chang, 2002, “The Use Of Grey-Based Taguchi Methods To Determine Submerged Arc Welding Process Parameters In Hard Facing”, Journal of Materials Processing Technology, 128(1), pp. 1-6.
[7] Yang, W. H., &Tarng, Y. S., 1998, “Design Optimization Of Cutting Parameters For Turning Operations Based On The Taguchi Method”, Journal of Materials Processing Technology, 84(1), pp.122-129.
[8] Wang M. Y. and Lan T. S., 2008, “Parametric Optimization On Multi-Objective Precision Turning Using Grey Relational Analysis”. Information Technology Journal, 7, pp.1072-1076.
[9] Lin W. S., Lee B. Y., Wu C. L., 2001, “Modeling The Surface Roughness And Cutting Force For Turning”, Journal Of Materials Processing Technology, 108, pp. 286-293.
[10] Kumanan S., Saheb S. K. N. and Jesuthanam C. P., 2006, “Prediction Of Machining Forces Using Neural Networks Trained By A Genetic Algorithm”, Institution of Engineers (India) Journal, 87, pp. 11-15