INVESTIGATION AND EVALUATION OF THE SOLAR AIR COLLECTOR
MODEL TO SUPPORT THE SOLAR VORTEX ENGINE
Ayad T. Mustafa, Hussain H. Al-Kayiem and Syed Ihtsham U. Gilani
Department of Mechanical Engineering, Universiti Teknologi PETRONAS, Bandar Seri Iskandar, Perak, Malaysia E-Mail: [email protected]
ABSTRACT
In this study, mathematical and experimental models were implemented for circular solar air collector. Modeling methodology with conservation equations of continuity, momentum and energy were presented, and model solution is obtained by utilizing a developed code in MATLAB program. An experimental model of concentric circles with outer and inner diameters of 8.8 m and 1.0, respectively, was designed and fabricated in order to perform measurements for the thermal and flow processes in the system. The canopy was inclined by 8.5o. The results showed that, at same solar irradiation, the temperatures of air flow, canopy and ground are increasing by decreasing the radius. When the canopy slope increases, air flow temperature decreases and canopy temperature increases for a constant solar radiation. When the solar radiation increases, air flow, canopy and ground temperatures increases for the same collector radius. The validations of the model predictive and therefore comparisons with results of experimental model of this study and Manzanares prototype data have been done. The model results agree with the experimental results. Further investigations are recommended after installation of the vortex generation engine where the residence time of the air particles will be changed, and consequently the air stream temperature and velocity are expected to change, as well.
Keywords: solar collector, solar energy, energy conversion, buoyancy force, solar vortex engine.
1. INTRODUCTION
Solar collectors are receivers of solar radiation intensity use for conversion of solar energy to heat energy. Solar collectors are either non-concentrating or concentrating solar radiation. In the non-concentrating type, the collector area is the same as the absorber area, while concentrating collectors have a bigger collector area than absorber.
Solar collectors used for electricity generation have the shapes of parabolic troughs, dishes and towers. (1) Parabolic troughs collector is used to concentrate solar radiation on an insulated tube placed at the focal position. (2) Dish collector concentrate solar energy at a single focal point. (3) Power towers are either a large tower surrounded by tracking mirrors called heliostats which focus sunlight on the receiver at the top of tower, or a solar updraft tower plant uses hot air extracted from a solar air collector to generate electricity by power conversion unit. Solar air collector receives solar insolation reaching the absorber then air passing through the collector picks up heat from the absorber (non-concentrating collector).
Solar updraft tower are classified as low temperature solar thermal power plants [1], while power tower with heliostats are designed to operate high temperatures [2]. The main part of the solar updraft tower power plants is the solar air collector which converts the solar energy to hot air movement under a transparent roof. By suitable inclined roof, the buoyancy of the heated air draws a continuous flow from the roof perimeter into the central part installation of an updraft tower will enhance the updraft, and with a turbine set in the path of the hot air
current; the kinetic energy of the flowing air was converted to electricity [3-7].
Literature demonstrates that the circular solar collector modeling can carry out by analytical, numerical, and simulation methods which used mathematical model by different complexity levels. Most modeling methodology used for predict performance of the solar thermal system. The circular solar collector modeling almost being a part of the solar chimney power plant model, and its validation compare with Manzanares prototype data or some basic designs. The basic design of the circular solar collector as a part of the solar chimney power plant for Manzanares prototype was presented by
Schlaich at al. [3, 6, 7].
updraft power plant system. The turbulent mathematical model need to be selected to describe fluid flow within the SUPPS because of Rayleigh number is found higher than1010. Bernardes et al. [12] developed an analysis for the solar chimney power plant, aimed particularly at a comprehensive analytical and numerical model, which describes the performance of the system. The collector is considered as a cavity between two parallel plates, moreover the analysis of the temperature rise in the collector section is determined by employing iterative techniques. Dai et al. [13] and Bilgen et al. [14] analyzed a theoretical model with some parameters, such as chimney height, diameter of the solar collector, ambient temperature, solar irradiance and the efficiency of wind turbine, which influence the performance of power generation for a solar chimney power plant.
Mohammad [15] presented a mathematical thermal model allows to predict the performance based on the solar chimney power plant dimensions and operating conditions. The discrete model with variable density is more appropriate than applying Bernoulli equation. Jing-yin et al. [16], Roozbeh [17], and Pasumarthi et al. [18] developed a mathematical model based on the energy balance and thermal equilibrium equations in the collector to estimate the power output of the solar chimney power plant as well as to examine the effect of various ambient conditions and structural dimensions on the power output. Roozbeh et al. [19] presented a mathematical model to describe the solar chimney power plant mechanism in detail. Two different numerical simulations were performed for the geometry of the prototype in Manzanares, Spain using the CFD software FLUENT that can simulate a two-dimensional axisymmetric model of a solar chimney power plant with the standard k-epsilon turbulence model. Xinping et al. [20] carried out a simulation study to investigate the performance of the power generating system based on a developed mathematical model. The simulated power outputs in steady state were obtained for different global solar radiation intensity, collector area and chimney height. Henry et al. [21] carried out an analysis to improve the description of the operation mode and efficiency of the upwind power plant. The pressure drop at the turbine and the mass flow rate has a decisive influence on the efficiency. The parts of ground, collector, chimney and turbine are modeled together numerically by the numerical CFD programme FLUENT.
In conclusion, the previous studies demonstrated that mathematical modeling of SCPP main parts (chimney, collector, and turbine) has been carried out in different methods. Some are aiming to predict the thermal fluid properties; some are analyzing the thermal plant performance and/or power generation. Some have studied the effect of geometrical and/or meteorological parameters on SCPP performance. It is realized that there is no focus on modeling of non-concentrating circular solar collector individually.
In this paper, a mathematical model for circular configuration solar air collector was developed and solved. The modeling methodology, with suitable and justified assumptions, manipulated the governing equations of conservation of continuity; momentum and energy. Further, an experimental model was designed and fabricated in order to produce measurements results. The purpose of this work is to predict the thermo-hydrodynamic behavior of air at various conditions. The mathematical model is validated by comparisons with the results of experimental model and Manzanares prototype data, as well.
The solar air collector model of this study is part of thermal system called the solar vortex engine (SVE), which is proposed and intended to be studied as new technique for solar power generation. The vortex generation engine is proposed to replaces the physical chimney of SCPP to overwhelm the high cost of installing a high chimney.
2. MATHEMATICAL MODELING
Mathematical model of the solar air collector is built by means of using conservation equations of continuity, momentum, and energy in radial direction behind hypothesis used up.
A. Model hypothesis
a) Air flow in the collector axisymmetric in radial direction from outer peripheral to the collector center; (∂/∂θ = 0).
b) Air flow in the collector has a free convection heat transfer.
c) Steady state in the collector; (∂/∂t = 0).
d) Assume there is no velocity component in axial direction; (∂/∂z = 0), all air flow in the collector is in radial direction.
B. The solar collector model configuration
The solar air collector has a shape of concentric circles canopy with slope ɸ, as shown in Figure-1. The solar collector model built with an outer canopy radius r1,
and nearest circumference to the collector center of radius r2. The height of outer canopy radius is h1, and for nearest
Figure-1. Solar air collector; radial section construction and top view.
C. Governing equations
Model governing equations which can describe airstream behavior in the solar collector included equations of continuity, momentum, and energy of air, canopy, and ground.
1) Continuity equation
Figure-1 shows description of the solar collector construction with air flow properties inside the collector. Slope of the collector canopy can determine as below:
�� � = ℎ −ℎ� (1)
Where: R= (r1 – r2)
Area of air flow inlet to the collector:
�� = � ℎ (2)
Area of air flow outlet from the collector:
� = � � (3)
Where h1: outer height of the solar collector
canopy, tan ϕ: collector canopy slope, L: height of the
solar collector canopy (at each R) which can be calculated by:
� = ℎ + �� � (4)
The continuity equation in the solar collector is:
� A � = � A (5)
Where ρ: air flow density, Vr: radial velocity of air flow.
2) Momentum equation
Figure-2 shows description of the forces acts on air flow inside the solar collector. Balance of forces of air flow inside the collector can obtain by applying Newton’s second law for partial control volume:
�(���)
� = −
�� � +
���
� + (6)
Where ��
� the free streams pressure gradient and the shear stress is � = ����
� .
Figure-2. The forces acts on air flow inside the solar collector.
The radial velocity, Vr is small in free convection
heat transfer. Therefore, radial velocity gradient can assume to be zero ���
� = within the control volume. That’s give the following change in the momentum equation (6):
��
� = � (7)
Then;
�(���)
� = �− +
���
� (8)
Where �: ambient air density
= −� ���� � (9)
≈ −�∆�∆�= −� ��−�
��−� (10)
�− ≈ � − �� (11)
The momentum equation inside the collector becomes:
�(���)
� = (� − ��) + ���
� (12)
Where Ta: ambient temperature, Tf: fluid temperature, β:
thermal expansion coefficient.
Now; for total control volume of air flow in the solar collector, the forces balance for the momentum equation is:
� � = (� − ��) + � � (13)
The shear stress in the momentum equation can calculate by the following empirical equation by Kroger et al. [22-24] with assumption of smooth collector surface;
� = . � ��
� . (14)
=��� ℎ
� (15)
Free convection effects obviously depend on the expansion coefficient. For an ideal gas:
=��� (16)
= −� ���� =� ��� =� (17)
The temperature, Tf in Kelvin degree.
3) Energy equation
a) Canopy energy equation
Heat balance for the collector canopy per area of canopy is:
(� + ) = ( �+ + ) (18)
Where I: solar intensity, αc: absorptivity of the
collector canopy.
Radiation heat transfer from ground to collector canopy:
= � �(� − � ) (19)
Where : Stefan-Boltzmann constant, Tg: ground
temperature, Tc: canopy temperatur
� =
� +��−
(20)
Where ϵg: emissivity of the collector ground, ϵc:
emissivity of the collector canopy.
Convection heat transfer from collector canopy to ambient air:
�= ℎ� � − �� (21)
Where hca: convection heat transfer coefficient;
which could be calculated from the following formula [24-26]:
ℎ�=
. + . ��[� ∆����]⁄
[ ���
∆���� � ]
⁄ (22)
Where Vw: ambient wind velocity, Tm: mean
temperature difference between Tc and Ta, ΔT: temperature
difference between Tc and Ta, k: thermal conductivity, ρ:
density, Cp: specific heat capacity, Pr: Prandtl number.
Radiation heat transfer from collector canopy to sky:
= � � � − � (23)
Where ϵc: emissivity of the collector canopy, Ts:
sky temperature; which could be calculated by [23, 27]:
� = . �� . (24)
Convection heat transfer from collector canopy to air flow in the collector:
= ℎ (� − � ) (25)
Where Tf: air flow temperature, hcf: convection
heat transfer coefficient which could be calculated from the following formula by using Gnielinski’s equation for turbulent flow [23, 24]:
ℎ = + .⁄ ⁄� −⁄ (� �⁄− ) �ℎ (26)
For smooth surfaces, friction factor could be calculated by [23]:
= .8 � − . − (27)
b) Ground energy equation
Heat balance for the collector ground per area of the ground is:
(�� ) = ( + ) (28)
Where c: transmissivity of the collector canopy,
αg: absorptivity of the ground.
Convection heat transfer from ground to air flow in the collector:
= ℎ (� − � ) (29)
Where hgf: convection heat transfer coefficient
which could be calculated from the following formula:
ℎ = + .⁄ ⁄� −⁄ (� �⁄ − ) �ℎ (30)
For rough surfaces, friction factor could be calculated by [23, 24, 27]:
= . 8 [� (�. + � ⁄ ℎ
. .
)]− (31)
Where ɛg: roughness of the ground.
c) Air energy equation
Heat balance for air stream in the collector shown in Figure-3.
Figure-3. Heat balance for air stream in the solar collector.
Heat balance for airstream in the collector is:
(Qc + Q ) × Ac= (ρVrAC T ) − (ρVrAC T )i (32)
Where Ac: area of the collector canopy, which can
calculate as follow:
� = � − � (33)
D. Solution of mathematical model
The solution of mathematical model is obtained by a developed code in MATLAB environment. The set of equations have been solved using Newton-Raphson approach. Thermodynamics properties of air flow can update with air temperature outlet by means of use empirical linear relationships. Input data of Universiti Teknologi PETRONAS as a case study including meteorological data and dimensions of the solar collector with its properties are presented, furthermore conditions of inlet air flow to the solar collector specified as an ambient air.
Table-1. The solar collector properties.
The Collector Properties Symbol Value
Emissivity of the collector canopy-Perspex ϵc 0.9
Transmissivity of the collector canopy-Perspex τc 0.92
Absorptivity of the collector canopy-Perspex αc 0.06
Absorptivity of the ground αg 0.7
Emissivity of the collector ground ϵg 0.9
Roughness of the ground surface ɛg 0.05 m
Roughness of the collector canopy surface ɛc 0.0 m
3. EXPERIMENTAL MODEL
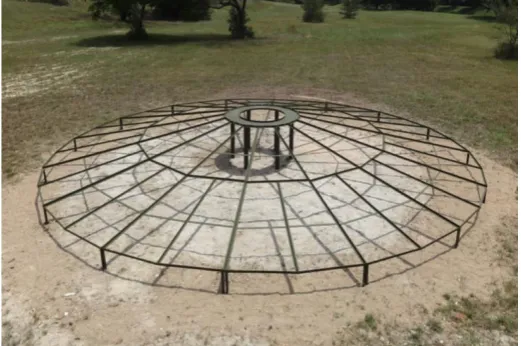
The solar air collector of concentric circles was designed and fabricated in order to produce warm air flow in radial direction below transparent canopy. Figure-4 shows the solar air collector model of 4.4 m in radius which is built in solar research site inside university technology PETRONAS, Malaysia. The geometric parameters of the solar are collector listed in Table-2. The solar air collector was made up of Perspex transparent
[image:6.595.168.429.396.569.2]canopy which having the solar transmission property of 0.92, the structure made of 1.5 inch of steel angle, and an absorbent ground consist of sand-clay mixture which nearly having the solar absorption property of 0.7. The solar air collector is a part from power thermal system used for power generation which utilizing from kinetic energy of swirly updraft air rises from the vortex generation engine located at center of the canopy with diameter of 1m.
Figure-4. Steel structure and absorbent ground of experimental model.
Table-2. Size of experimental model.
Geometric parameter Figure index Size
Height of collector inlet h1 0.24 m
Height of collector exit h2 0.79 m
Collector outer radius r1 4.4 m
Collector inner radius r2 0.5 m
Slope of the collector
canopy ϕ 8.53˚
Testing procedure depending on available instruments; 1st digital reader KIMO-AMI 300 with multi probes of air properties measurements as shown in Table-3. 2nd solarimeter instrument KIMO-SL 200 used to measure the solar insolation with specification of solar irradiation measuring range from 1 W/m2 to 1300 W/m2, accuracy of 5% of measurement, and operating temperature range from -10˚C to +50˚C. 3rd
Table-3. KIMO-AMI 300 instrument with multi probes specifications.
Item Probes Specifications / Functions
Measuring units
Measuring
ranges Accuracy Resolutions
1 Hygrometry Probe
Relative Humidity % RH 3 ~ 98 %RH - 0.1 %RH
Absolute Humidity /
Enthalpy g/kg / kJ/kg
According to measuring
ranges
- 0.1 g/kg
Dew Point ˚C -50 ~ +80 ˚C ± 0.6% of reading ± 0.5 ˚C 0.1 ˚C
Ambient
Temperature ˚C -40 ~ +180 ˚C
± 0.3% of reading ±
0.25 ˚C 0.1 ˚C
2 Hotwire
Probe
Air Velocity m/s
0.15 ~ 3 m/s ± 3% of reading ±
0.03 m/s 0.01 m/s
3.1 ~ 30 m/s ± 3% of reading ±
0.1 m/s 0.1 m/s
Temperature ˚C -20 ~ +80 ˚C ± 0.3% of reading ± 0.25 ˚C 0.1 ˚C
Air Flow m3/h 0 ~ 99999 m3/h ± 3% of reading ±
0.03 area (cm2) 1 m 3
/h
3 Pitot Tube
Air Velocity m/s
2 ~ 5 m/s ± 0.3 m/s
0.1 m/s 5.1 ~ 100 m/s ± 0.5% of reading ±
0.2 m/s
Air Flow m3/h 0 ~ 99999 m3/h ± 0.2% of reading
±1% PE 1 m
3 /h
4 Pressure
Adapter Pressure Pa 0 ~ ±500 Pa
± 0.2% of reading ±0.8% Pa
0.1 Pa of ±100 % Pa
RESULTS AND DISCUSSIONS
By means of developed mathematical model explain previously and experimental model, effects of collector radius, canopy slope, and solar intensity on temperatures of solar air collector will be presented in this section. The main parameter of air properties in solar collector is temperature difference between warm air flow and ambient air; therefore model results are focused on temperatures in the solar air collector.
A. Analysis of the temperatures distribution for solar air collector
Air enters the solar collector from outer peripheral toward center of the collector. During this path, and for constant solar radiation, air temperature increases from ambient to maximum temperature at inner peripheral of the collector. The prediction results of air temperature along the radius are shown in Figure-5. Canopy and ground temperatures are increasing in the direction from collector inlet towards the center of the system. Results presented in Figure-5 are in good agreement with mathematical and experimental Manzanares results reveal by Mohsen et al. [28].
Figure-5. Temperature distribution versus radius for mathematical model of solar air collector (ambient
temperature of 18.5˚C).
B. Effect of canopy slope on temperatures for solar air collector model
The slope of collector canopy, ϕ shown in Figure-1, indicates to canopy height with respect to radius
0 10 20 30 40 50 60 70
5 25 45 65 85 105 124
Te
pe
rat
ue
˚C
Collector Radius (m)
decreasing from outer peripheral to center of the collector. For 5 m canopy radius and constant solar radiation, Figure-6 shows; when canopy slope increase from 0 to 26.5˚, air temperature decreases and canopy temperature increases. The reason of these changes that; air temperature at maximum at zero canopy slope due to still air down side the canopy, then air temperature decrease with canopy slope increases due to air movement down side the canopy which caused by air free convection. While canopy temperature at minimum at zero canopy slopes due to less radiation absorbed, then canopy temperature increase with canopy slope increases due to growth in radiation absorbed until a tilt angle reach the latitude of the collector location which indicate the maximum radiation absorbed.
Figure-6. Effect of canopy slope on temperatures for mathematical model of solar air collector (5 m radius).
C. Effect of solar intensity change on temperatures for solar air collector model
Temperature difference between warm air flow and ambient temperature refer the main parameter of air properties in the solar collector. For canopy radius of 5 m, temperatures of air, canopy, and ground increase with solar intensity increases as shown in Figure-7.
Figure-7. Effect of solar intensity change on temperatures for mathematical model of solar air collector (5 m radius).
D. Experimental results
The temperature distribution of warm air flow below said experimental model of the solar air collector show in Figure-8 by means of temperature difference between warm air flow temperature and ambient air; versus radius of the collector. Results behavior show increases in temperature with radius decreasing; because of absorbing the solar radiation. These results measured for solar intensity of 1000 W/m2 and ambient temperature of 35.6˚C. At peak time of ground absorption between 1pm to 3pm, temperature of exit air flow from the solar air collector is 44.9˚C, temperature of transparent canopy is 52.3˚C, and temperature of absorbent ground is 65.4 ˚C. Figure-8 included comparisons and validation with the mathematical model results.
Figure-8. Temperature difference versus radius for experimental and mathematical models.
E. Validation of the Mathematical Model
The solution of mathematical model is obtained by utilizing a developed code in MATLAB program. The model results are compared with the experimental model of this study and experimental data of Manzanares prototype to validate the theoretical model.
Validation of air temperature difference modeling with respect to the experimental model of this study shown in Figure-8. The comparison between mathematical and experimental models of air flow temperature difference gives an agreement within difference percentage of 14.6 % at maximum. For the data of Manzanares prototype listed in Table 4, validation of air temperature difference modeling with respect to solar intensity is shown in Table-5. The comparison between modeled and Manzanares prototype data of air temperature difference gives an agreement within difference percentage of 16 % [10, 29]. Validation of air temperature modeling with respect to 0 5 10 15 20 25 30 35 0
2.8 5.7 8.5 11.3 14.1 .716 19.3 21.8 24.2 26.5
Te pe rat ur e ˚C
Slope of the canopy (degree)
Air Temp Canopy Temp
0 20 40 60 80 100
200 400 600 800 1000 1200
Te pe rat ur e ˚C
Solar Intensity (W/m2)
Air Temp Ground Temp Canopy Temp
0 2 4 6 8 10 12
0 1 2 3 4 5
Te pe rat ur e Di ffe re ce ˚C
Collector Radius (m)
collector radius is shown in Table-6. The comparison between modeled and Manzanares prototype data of air flow temperature gives an agreement within difference percentage of 10 % [28]. Clearly, the model results agree
with the experimental results. Therefore, the theoretical model proposed can be considered as a moderately valid model for evaluation of solar air collector of power generation system.
Table-4. Manzanares prototype data [10].
Mean outer collector canopy radius 122 m
Average canopy height 1.85 m
Inner collector canopy radius 5 m
Ambient temperature of 1st Sept. 1989 18.5 ˚C
Table-5. Validation of air temperature difference modeling with respect to solar intensity.
2nd September
1982 Day time
[10]
Solar intensity (W/m2) [10]
This Study mathematical model temperature difference
ΔT12 (˚C)
Manzanares experimental
temperature difference ΔT12 (˚C)
[10]
Model - Manzanares
difference percentage %
10.00 744 17.7 14.8 16.38
12.00 850 19.8 17.8 10.1
14.00 755 17.9 17.4 2.79
16.00 455 11.4 11.3 0.8
Table-6. Validation of air temperature modelling with respect to collector radius.
Radius of air collector (m)
This study mathematical model
temperature (˚C)
Manzanares experimental temperature (˚C)
[29]
Theoretical program temperature
(˚C) [29]
Model - Manzanares
difference percentage %
25 45.2 45.2 45.4 0.0
45 44.1 44 45.1 0.23
65 42.4 41 44 3.3
85 39.8 36 40 9.5
105 34.6 31 32 10.4
CONCLUSIONS
A mathematical model for a solar air collector with concentric circles canopy was build. Modeling methodology with conservation equations of continuity, momentum and energy were presented, and model solution is obtained by utilizing a developed code in MATLAB program. An experimental model of concentric circles was designed and fabricated in order to produce measurements results.
The mathematical model has been validated by results of the experimental model of this study and experimental data of Manzanares prototype. Some conclusions can be drawn as follows:
a) When the solar radiation is constant, the temperatures of air flow, canopy and ground increases by decreasing the radius.
b) When the canopy slope increases, air flow temperature decreases and canopy temperature increases for a constant solar radiation.
c) When the solar radiation increases, air flow, canopy and ground temperatures increases for the same collector radius.
gives an agreement within difference percentage of 16 %, and validation of air temperature difference modeling with respect to collector radius gives an agreement within difference percentage of 14.6 % at maximum.
ACKNOWLEDGEMENT
The authors are express grateful to Universiti Teknologi PETRONAS for the technical support of this study.
REFERENCES
[1] N. Ninic. 2006. Available energy of the air in solar chimneys and the possibility of its ground-level concentration. Solar Energy. 80: 804-811.
[2] Solar thermal collector, Wikipedia, the free
encyclopedia. 2015.
(http://en.wikipedia.org/wiki/Solar_thermal_collector).
[3] Schlaich J, Schiel W, Friedrich K, Schwarz G, Wehowsky P, Meinecke W. 1995. The solar chimney: transferability of results from the Manzanares solar chimney plant to larger scale-plants. Tech. Rep., Schlaich B. und Partner CEs, Stuttgart.
[4] A. Koonsrisuk, S. Lorente, A. Bejan. 2010. Constructal solar chimney configuration. International Journal of Heat and Mass Transfer. 53: 327-333.
[5] Xinping Z., Bo X., Wanchao L., Xianjun G., Jiakuan Y., Jian F. 2010. Comparison of classical solar chimney power system and combined solar chimney system for power generation and seawater desalination. Desalination. 250: 249-256.
[6] J. Schlaich, R. Bergermann, W. Schiel and G. Weinrebe. 2004. Sustainable Electricity Generation with Solar Updraft Towers. Structural Engineering International.
[7] J. Schlaich, R. Bergermann, W. Schiel, G. Weinrebe. 2005. Design of commercial solar updraft tower systems-utilization of solar induced convective flows for power generation. Solar Energy Engineering. 127: 117-124.
[8] E. Gholamalizadeh, S.H. Mansouri. 2013. A comprehensive approach to design and improve a
solar chimney power plant: A special case - Kerman project. Applied Energy. 102: 975-982.
[9] A. Asnaghi, S.M. Ladjevardi. 2012. Solar chimney power plant performance in Iran. Renewable and Sustainable Energy Reviews. 16: 3383-3390.
[10]Atit Koonsrisuk, Tawit Chitsomboon. 2013. Mathematical modeling of solar chimney power plants. Energy. 51: 314-322.
[11]Tingzhen Ming, Xinjiang Wang, Renaud Kiesgende Richter, Wei Liu, Tianhua Wu, Yuan Pan. 2012. Numerical analysis on the influence of ambient crosswind on the performance of solar updraft power plant system. Renewable and Sustainable Energy Reviews. 16: 5567-5583.
[12]M.A. dos S. Bernardes, A. Voß, G. Weinrebe. 2003. Thermal and technical analyses of solar chimneys. Solar Energy. 75: 511-524.
[13]Y.J. Dai, H.B. Huang, R.Z. Wang. 2003. Case study of solar chimney power plants in Northwestern regions of China. Renewable Energy. 28: 1295-1304.
[14]E. Bilgen, J. Rheault. 2005. Solar chimney power plants for high latitudes. Solar Energy. 79: 449-458.
[15]Mohammad O. Hamdan. 2013. Analysis of solar chimney power plant utilizing chimney discrete model. Renewable Energy. 56: 50-54.
[16]Jing-yin Li, Peng-hua Guo, Yuan Wang. 2012. Effects of collector radius and chimney height on power output of a solar chimney power plant with turbines. Renewable Energy. 47: 21-28.
[17]Roozbeh Sangi. 2012. Performance evaluation of solar chimney power plants in Iran. Renewable and Sustainable Energy Reviews. 16: 704-710.
[18]N. Pasumarthi, S. A. Sherif. 1998. Experimental and Theoretical Performance of a Demonstration Solar Chimney Model - Part I: Mathematical Model Development. International Journal of Energy Research. 22: 277-288.
[20]Xinping Zhou, Yang J., Xiao B., Hou G., Xing F. 2009. Analysis of chimney height for solar chimney power plant. Applied Thermal Engineering. 29: 178-185.
[21]Henry Pastohr, Oliver Kornadt, Klaus G.urlebeck. 2004. Numerical and analytical calculations of the temperature and flow field in the upwind power plant. International Journal of Energy Research. 28: 495-510 (DOI: 10.1002/er.978).
[22]Kröger D. and J. Buys. 1999. Radial flow boundary layer development analysis. South African Institution of Mechanical Engineering, R and D Journal. 15: 95-102.
[23]Pretorius J.P. 2004. Solar tower power plant performance characteristics, Stellenbosch: University of Stellenbosch.
[24]Pretorius J.P. 2007. Optimization and control of a large-scale solar chimney power plant, Stellenbosch: University of Stellenbosch.
[25]Aurélio dos Santos Bernardes, M., T.W. 2009. Von Backström, and D.G. Kröger, Analysis of some available heat transfer coefficients applicable to solar chimney power plant collectors. Solar Energy. 83(2): 264-275.
[26]Swinbank W.C. 1993. Long‐wave radiation from clear skies. Quarterly Journal of the Royal Meteorological Society. 89(381): 339-348.
[27]Haaland S. 1983. Simple and explicit formulas for the friction factor in turbulent pipe flow. Journal of Fluids Engineering. 105(1): 89-90.
[28]Mohsen Najmi, Ali Nazari, Hossein Mansouri, Ghazzanfar Zahedi. 2012. Feasibility study on optimization of a typical solar chimney power plant. Heat Mass Transfer, Springer. 48: 475-485. (DOI 10.1007/s00231-011-0894-5).