J
OURNAL OFC
LINICALM
ICROBIOLOGY, Dec. 2006, p. 4491–4497
Vol. 44, No. 12
0095-1137/06/$08.00
⫹
0
doi:10.1128/JCM.01375-06
Copyright © 2006, American Society for Microbiology. All Rights Reserved.
Simultaneous Quantification and Genotyping of Hepatitis B Virus for
Genotypes A to G by Real-Time PCR and Two-Step
Melting Curve Analysis
䌤
Wen-Chun Liu,
1Masashi Mizokami,
2Maria Buti,
3Magnus Lindh,
4Kung-Chia Young,
5Koun-Tem Sun,
6Yun-Chan Chi,
7Hsi-Hsien Li,
8and Ting-Tsung Chang
1,9*
Institute of Basic Medical Sciences,
1Department of Medicine,
9Department of Medical Laboratory Science and Biotechnology,
5and
Institute of Molecular Medicine,
8Medical College, and Department of Statistics, Management College,
7National Cheng Kung University,
and Institute of Computer Science of Information Education, National University of Tainan,
6Tainan, Taiwan, Republic of China;
Department of Clinical Molecular Informative Medicine, Nagoya City University Graduate School of Medical Sciences, Nagoya,
Japan
2; Liver Unit, Hospital General Universitari Vall d’Hebron, Barcelona, Spain
3; and Department of Clinical Virology,
Go
¨teborg University, Guldhedsgatan 10B, Goteborg, Sweden
4Received 5 July 2006/Returned for modification 8 September 2006/Accepted 22 September 2006
Both the viral titer and the genotype significantly determine clinical outcomes and responses to antiviral
treatment in chronic hepatitis B virus (HBV) infection. A method was developed for large-scale A-to-G genotyping
with simultaneous viral quantification. The assay was run on a LightCycler instrument using hybridization probes.
The genotype was determined from the melting points of the probes in a two-step manner. Set 1 amplicons
differentiated genotypes B, E, and F from A, C, D, and G and simultaneously quantified viremia by real-time PCR.
Melting curve analysis using the set 2-1 amplicon or the set 2-2 amplicon reaction mixture was then used to
differentiate these genotype groups into single genotypes. HBV DNA quantification was consistent with that of the
Amplicor assay and linear in a range from 10
2to 10
13copies/ml. By comparison with the restriction fragment length
polymorphism method, 92.3% of 441 samples were accurately genotyped by the current assay. The method should
be useful for genotyping and quantification of HBV DNA in areas where all genotypes exist.
Hepatitis B virus (HBV) infection is an important public
health problem chronically infecting more than 350 million
people worldwide. The infection can cause acute and chronic
liver disease, including cirrhosis and hepatocellular carcinoma.
HBV has a circular genome of approximately 3,200 base pairs
and is divided into genotypes A to H, with an intergenotypic
diversity of at least 8% in the full genome sequence (1, 10, 12,
13, 17). The genotypes have distinct geographic distributions,
and accumulating evidence indicates that genotyping is of
clin-ical importance, because the genotypes correlate with the
se-verity of liver disease. HBV genotype C is associated with more
severe liver disease than genotype B (3, 5, 6), and patients
infected with genotype B have a lower rate of positive hepatitis
B virus e antigen (HBeAg) and 1 decade earlier spontaneous
HBeAg seroconversion than genotype C-infected patients
(14). Moreover, patients infected with genotypes C and D
seem to have a lower response rate to alpha interferon than
those infected with genotypes A and B (5), and the risk of
emergence of lamivudine resistance-associated mutations has
been reported to be higher in genotype A-infected patients
than in genotype D-infected patients (2, 20).
Several methods for genotyping HBV have been reported,
including melting curve analysis (MCA) (16, 19), restriction
fragment length polymorphism (RFLP) (7, 8), post-PCR
hy-bridization or line probe assay (4), PCR with genotype-specific
primers (9), and enzyme-linked immunosorbent assay-based
methods (18). One genotyping method was shown to also
quantitate HBV viremia (19), but that method was limited to
distinguishing between genotypes B and C, which are prevalent
in Asia. In this study, an efficient PCR-based method was
developed to combine quantification of HBV DNA and
geno-typing with differentiation of HBV genotypes A to G. The
results showed consistency with currently available viral-load
quantification and efficient genotyping. The PCR-based
method thus provides a useful tool for rapid and cost-effective
diagnosis in areas with different geographical distributions of
HBV genotypes.
MATERIALS AND METHODS
Study subjects and samples.A total of 441 HBV DNA-positive serum samples from Taiwan, Spain, Japan, and Sweden were used for the evaluation of our genotyping system. Among these samples, 380 were from the outpatient clinic at
National Cheng Kung University Hospital in Taiwan. Stored samples (⫺80°C)
from these patients were analyzed in the study. All samples were genotyped by PCR-RFLP (7), and the HBV DNA levels of 110 samples were determined by the Roche Amplicor HBV Monitor Test (11).
Principle of real-time PCR genotyping by melting curve analysis.The geno-typing method was based on MCA with LightCycler hybridization probes as shown in Fig. 1A. The primers and hybridization probes were designed by analyzing 369 full-length HBV nucleotide sequences from the GenBank data-base, which by alignments and phylogenetic analysis using the Clustal X1.81, GeneDoc2.6.002, and Mega2 programs had been classified into eight genotypes, from A to H. These alignments included, after excluding the sequences of inconclusive genotypes, 69 full-length HBV sequences of type A, 93 of type B, 101 of type C, 54 of type D, 6 of type E, 27 of type F, 10 of type G, and 9 of type H isolates (1). Thus, a few conserved signature single-nucleotide polymorphisms that could differentiate all genotypes were identified. These polymorphisms were
* Corresponding author. Mailing address: Department of Internal
Medicine, National Cheng Kung University Hospital, No. 138
Sheng-Li Road, Tainan City 704, Taiwan, Republic of China. Phone:
886-6-2353535, ext. 5389. Fax: 886-6-2095233. E-mail: ttchang@mail
.ncku.edu.tw.
䌤
Published ahead of print on 4 October 2006.
4491
on May 16, 2020 by guest
http://jcm.asm.org/
targeted by the LightCycler sensor probes to allow genotype identification by
melting temperature (Tm) analysis.
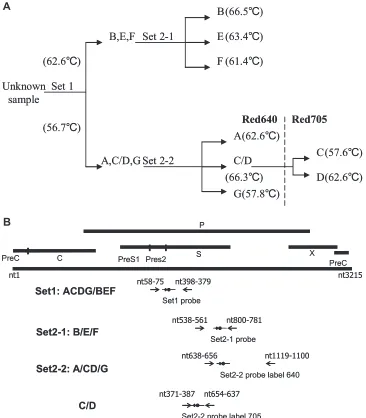
A two-step melting curve analysis was used to differentiate HBV genotype groups into single genotypes. The first step, using the set 1 amplicon (the ACDG/BEF set), simultaneously used real-time PCR for quantification of the viral titer and melting curve analysis for genotyping into groups (B, E, F) and (A, C, D, G). The second step used melting curve analysis with set 2-1 (B/E/F set) and set 2-2 (A/CD/G set and C/D set) amplicons for differentiating each group into single genotypes. Thus, seven genotypes could be clearly differentiated by
showing distinctTmvalues (Fig. 1A). The anchor probes were labeled at the 5⬘
ends with LC-Red 640 dye, and sensor probes covering the single-nucleotide
polymorphisms were labeled at the 3⬘ends with fluorescence. The 3⬘ends of the
anchor probes were also phosphorylated.
Real-time PCR amplification of HBV using LightCycler.The serum HBV DNA was extracted with a Viogene extraction kit, and real-time PCR was then performed on a LightCycler instrument (Roche Diagnostics Applied Science) using primers and probes described in Table 1 and Fig. 1B. The PCR
was run in a total volume of 10l containing 2.5l of DNA template, 1l
of LightCycler FastStart DNA Master Hybridization Mixture (Taq DNA
polymerase, PCR buffer, 10 mM MgCl2, and a deoxynucleoside triphosphate
mixture) (Roche Diagnostics Applied Science), 1.2l of 25 mM MgCl2, 0.075
l of 20M (each) of the probes, and 0.5l of 5M of each primer. The
[image:2.585.110.476.68.486.2]amplification using set 1 (ACDG/BEF set) and set 2-1 (B/E/F set) amplicons was performed as follows: initial hot-start denaturation at 95°C for 10 min, followed by 45 cycles of denaturation at 95°C for 10 s, annealing at 53°C for 10 s, and extension at 72°C for 15 s. The programmed temperature transition rate was 20°C/s for denaturation/annealing and 3°C/s for extension. Real-time PCR monitoring was achieved by measuring the fluorescence at the end of the annealing phase for each cycle. After PCR, a melting curve was generated by holding the reaction mixture at 95°C for 10 s and then lowering the temper-ature to 48°C at a transition rate of 20°C/s and holding it for 60 s. This was followed by heating the reaction mixture slowly at a transition rate of 0.1°C/s to 80°C with continuous collection of fluorescence at 640 nm. The melting curve and quantitative analyses were conducted by using LightCycler analysis software version 3.5 following the manufacturer’s instructions (Roche Diag-nostics Applied Science). For the set 2-2 amplicon (the A/CD/G set plus the
FIG. 1. Primers and hybridization probes on melting curve analysis. (A) The workflow used for differentiating the seven HBV genotypes A to
G with two-step melting curve analysis. With the set 1 amplicon, real-time PCR was used for quantification, with simultaneous melting curve
analysis for differentiating genotypes into two groups. According to the distinct melting temperature, single genotypes can be further differentiated
with either set 2-1 or set 2-2 reaction mixtures. (B) The relevant portions of the HBV genome with binding sites for the different primers and
probes.
3
, forward primer;
4
, reverse primer;
}
, sense probe;
F
, anchor probe.
on May 16, 2020 by guest
http://jcm.asm.org/
C/D set), the PCR was the same as that for set 1 and set 2-1, except for extension at 72°C for 20 s.
Quantification of HBV DNA by real-time PCR.Amplification by set 1 primers and probes (Table 1) was used for the assessment of viremia. The HBV DNA levels were calculated by comparing each sample’s threshold cycle value to a standard curve obtained in each run. The quantification standard was derived from plasmid pGEM-HBV (with an HBV insert from genotype B) purified with
the plasmid Gene-SpinTMMiniprep Purification Kit (Protech). The
concentra-tion of the plasmid was determined spectrophotometrically and expressed as
copies/ml. Serial dilutions of the plasmid ranging from 1⫻102to 1⫻1013
copies/ml were used to prepare the standard curve for quantification of HBV DNA from patient specimens. The reproducibility was evaluated by analyzing
triplicates of two serum samples with HBV DNA levels atxandy, respectively,
on two occasions. The mean values, standard deviations, and coefficient of variation were calculated.
Alternative genotyping of HBV genotypes A, C, D, and G by type-specific multiplex PCR.Because the accuracy of the second-step melting curve analysis was probably influenced by complicated conditions during differentiation of the group of four genotypes (A, C, D, and G), an alternative genotyping method using type-specific multiplex PCR was designed. This PCR utilized one universal
forward primer (5⬘nucleotides [nt] 2305 to 2325) and a mixture of four HBV
genotype-specific reverse primers: 5⬘-TAGGGGACCTGCCTCGGTC-3⬘ (nt
2413 to 2395) for genotype A, 5⬘-TTCATTAACTGTAAGAGGGCCYAAAT-3⬘
(nt 2659 to 2634) for genotype C, 5⬘-GATTGCTGGTGGAAAGATTCTGC-3⬘
(nt 2952 to 2907) for genotype D, and 5⬘-ACTAACATTGGGAAGCTGGAG
ATGC-3⬘(nt 2497 to 2473) for genotype G. Multiplex PCR was carried out in a
total volume of 50l, which contained 0.5l of each primer (20 mM), 2 ml
deoxynucleoside triphosphate (5 mM), 5l 10⫻Tag reaction buffer, and 10l
template and water for a total volume of 50l. The thermocycler (GeneAmp
PCR System 9600; Perkin-Elmer) was programmed to incubate the samples for 5 min at 94°C, followed by 40 cycles consisting of 94°C for 1 min, 59°C for 1 min, and 72°C for 2 min. After the PCR, electrophoresis of the amplified products was completed on a 4% agarose gel, which was stained with ethidium bromide and evaluated under UV light. The multiplex PCR produced different amplicon sizes for genotypes A, C, D, and G, with 109, 349, 609, and 187 bp, respectively.
Direct-sequencing analyses.For samples with discordant results between the PCR-based method and PCR-RFLP, direct sequencing of the HBV complement genome and phylogenetic analysis was conducted (13, 15). HBV amplicons were then subjected to cycle sequencing using ABI PRISM Big-Dye kits (Applied Biosystems, Foster City, CA) and subsequent reading of the sequence using an ABI 3100 Genetics Analyzer. If the genotyping results suggested a mixed infec-tion, the HBV isolates were cloned into a pGEM plasmid and then analyzed by sequencing of five clones.
Statistical methods.The interclass correlation between three duplication ex-periments in each individual run was calculated to evaluate the reproducibility of the developed genotype quantification method. The Pearson correlation between different runs was also calculated. The correlation between our quantification method and the Roche Amplicor HBV monitor test was evaluated by Pearson correlation. All statistics analyses were conducted using the SPSS statistical package, version 11.0.
RESULTS
[image:3.585.50.539.80.419.2]Quantification of HBV by the set 1 amplicon (the ACDG/
BEF set).
The standard calibration curve (serial dilution of
TABLE 1. PCR primers and probes in the amplicons used for HBV quantification and genotyping
Amplicon Sequence (5⬘–3⬘) Sense/
antisensea
Amplicon size (bp)
Position
(nt)b Tmc
Set 1 (ACDG/BEF)
关
Surface/polymerase
兴
340
Genotype BEF,
62.2°C
Forward primer
5
⬘
-TGCTGGTGGCTCCAGTTC-3
⬘
S
58–75
Genotype ACDG,
56.7°C
Reverse primer
5
⬘
-TGATAAAACGCCGCAGACAC-3
⬘
As
398–379
BEF-Sen probe
5
⬘
GTTGACAAAAATCCTCACAATACC-3
⬘
-FL
S
217–240
Genetic-polymorphism site
A/G, nt225
ACDG/BEF-Anc probe
5
⬘
-LC Red 640-CAGAGTCTAGACTCGTGGTGG
ACTTCTCTCA-3
⬘
-PH
S
242–272
Set 2-1 (B/E/F)
关
Surface/polymerase
兴
262
Genotype B, 66.5°C
Forward primer
5
⬘
-TCAAGGAACCTCTATGTTTCCCTC-3
⬘
S
538–561
Genotype E, 63.4°C
Reverse primer
5
⬘
-ACAGCGGCATAAAGGGACTC-3
⬘
As
800–781
Genotype F, 61.4°C
B-Sen probe
5
⬘
-ATTTGTTCAGTGGTTCGTAGGGCTT-3
⬘
-FL
S
688–712
Genetic-polymorphism site
T/G, nt 702; T/C, nt 705; A/C, nt 706
BEF-Anc probe
5
⬘
-LC Red 640-CCCCCACTGTCTGGCTTTCAG
TTATATGGATGAT-3
⬘
-PH
S
714–747
Set 2-2 (A/C/D/G)
关
Surface/polymerase
兴
481
Genotype CD, 66.3
A/CD/G
Forward primer
5
⬘
-CTATGGGAGTGGGCCTCAG-3
⬘
S
638–656
Genotype A, 62.6°C
Reverse primer
5
⬘
-AAAGGCCTTGTAAGTTGGCG-3
⬘
As
1119–1100
Genotype G, 57.8°C
CD-Sen probe
5
⬘
-CATCATCCATATAACTGAAAGCCAAACA
GTG-3
⬘
-FL
As
748–718
Genetic-polymorphism site
A/G, nt 735; A/G, nt 724
ACDG-Anc probe
5
⬘
-LC Red 640-GGGAAAGCCCTACGAACCAC
TGAACAAATGGC-3
⬘
-PH
As
716–685
Genotype D, 62.6°C
C/D
283
Forward primer
5
⬘
-CGCTGGATGTGTCTGCG-3
⬘
S
371–387
Genotype C, 57.6°C
Reverse primer
5
⬘
-GAGGCCCACTCCCATAGG-3
⬘
As
654–637
D-Sen probe
5
⬘
-CAACATACCTTGATAGTCCAGAAGA-3
⬘
-FL
As
466–442
Genetic-polymorphism site
A/G, nt 454
CD-Anc probe
5
⬘
-LC Red 705-CCAACAAGAAGATGAGGCAT
AGCAGCAGGATGAAGAGG-3
⬘
-PH
As
440–403
aS, sense; As, antisense.
bThe nucleotide position is based on the HBV genotype B sequence (NCBI accession no. AB106884).
c⌬Tmis the difference between the melting temperatures of two groups or genotypes.⌬Tm
BEF/ACDG⫽5.5°C⫾0.3°C,⌬TmB/E⫽3.1°C⫾0.2°C,⌬TmE/F⫽2.0°C⫾
0.05°C,⌬TmB/F⫽5.1°C⫾0.2°C,⌬TmCD/A⫽3.7°C⫾0.3°C,⌬TmA/G⫽4.8°C⫾0.2°C,⌬TmCD/G⫽8.3⫾0.3°C, and⌬TmC/D⫽5.0°C⫾0.2°C.
V
OL. 44, 2006
QUANTIFICATION AND GENOTYPING OF HBV BY REAL-TIME PCR
4493
on May 16, 2020 by guest
http://jcm.asm.org/
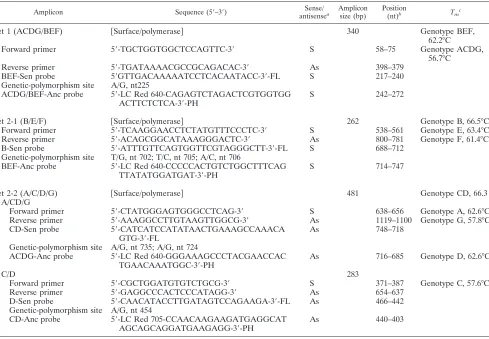
plasmid HBV) was linear in a range from 10
2to 10
13copies/ml
(Fig. 2). Reproducibility as measured by dual testing of
tripli-cates of two serum samples was acceptable, with coefficients of
variation at 7.9% and 12.9%. Analysis of 110 serum samples
showed good correlation between real-time PCR
quantifica-tion and the Amplicor HBV Monitor test (Roche), with an
R
2value of 0.93 and a gamma of
⬎
0.80 (Fig. 2). The correlation
was also good at levels above the range quantification of the
Amplicor test, i.e., when samples had been prediluted prior to
being tested with Amplicor (but not prior to real-time PCR).
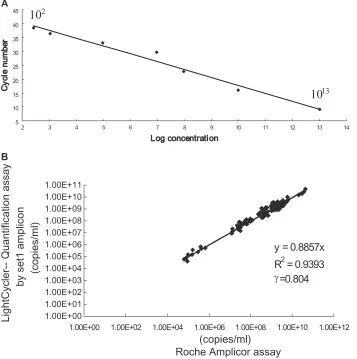
Genotyping by MCA.
In an initial evaluation of the
geno-typing, 62 samples representative of all of the genotypes from
A to G were analyzed. By MCA with the set 1 amplicon, all
seven of the genotypes could be correctly differentiated into
two groups (ACDG/BEF) on the basis of the
T
m, which was
56.7°C for genotypes A, C, D, and G and 62.6°C for genotypes
B, E, and F (Fig. 3A). With the set 2-1 amplicon (the B/E/F
set), samples of genotypes B, E, and F could be further
clas-sified with
T
mcharacteristics of 66.5°C, 63.4°C, and 61.4°C for
genotypes B, E, and F, respectively (Fig. 3B). With the set 2-2
amplicon (the A/CD/G set and the C/D set), using two
chan-nels (F2 and F3), identification of genotypes A, C, D, and G
could be conducted with
T
mcharacteristics of 66.3°C, 62.6°C,
and 57.8°C for genotypes C/D, A, and G, respectively, in the F2
channel and 57.6°C and 62.6°C for genotypes C and D,
respec-tively, in the F3 channel (Fig. 3C). The
T
mdifferences in each
set were significant enough for clear differentiation of these
genotypes (Fig. 1A).
After confirming the reproducibility of the amplifications
and melting point analyses, with few cases showing a
T
mshift,
the accuracy of the genotyping method was further evaluated
by analyzing 441 clinical samples whose genotypes were also
tested by PCR-RFLP for comparison.
When the results by melting point and PCR-RFLP
genotyp-ing were congruent, they were considered accurate. When the
results were conflicting, accuracy was assessed by comparison
with sequencing. Assessed in this way, the overall accuracy of
the melting curve genotyping was 92.3%, compared to 87.0%
for RFLP (Table 2). The melting point typing, however, was
more accurate with the set 1 amplicon and the set 2-1 amplicon
than with the set 2-2 amplicon (99.1% and 97.0% versus
87.9%) because of the higher genotypic specificity of the
poly-FIG. 2. Quantification of the virus by real-time PCR with set 1. (A) Linear regression of the standards ranging from 10
2to 10
13copies/ml was
determined by using the “second derivative maximum” method. The standard curve showed a regression coefficient,
r
, of
⫺
1.00; a mean squared
error of 0.138; an intercept of 47.03; and a slope of
⫺
3.293. (B) Comparison of the quantification assay with the Roche Amplicor assay for HBV
quantification.
on May 16, 2020 by guest
http://jcm.asm.org/
[image:4.585.117.474.71.430.2]morphisms at nt 225 and nt 706.
T
mshift from expected values
was relatively common, particularly in genotype C, and
se-quencing showed that this was due to 1- or 2-nucleotide
vari-ations in the segment targeted by the sensor or the anchor
probes. Accordingly, identification of genotypes B, E, F, and G
was more accurate (98.7%, 100%, 100%, and 100%) than that
of genotypes A, C, and D (88.2%, 80.9%, and 85.7%).
Typing of genotypes A, C, D, and G by multiplex PCR.
A
proportion (12%) of samples identified as A, C, D, or G by the
set 1 amplicon could not be separated by MCA using the set
2-2 amplicon due to
T
mshift. However, the correct genotype
could be identified by type-specific multiplex PCR in the
ma-jority of these cases (94.44%) (Table 2).
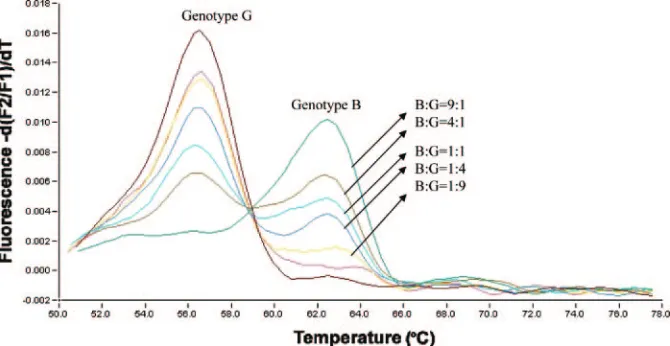
Detection of HBV mixed infections with melting curve
anal-ysis.
Although there were no cases of mixed-genotype infection
among the samples, the power of the set 1 amplicon in
detect-ing mixed viral infections was evaluated. By mixdetect-ing two
plas-mids corresponding to genotypes B and G with various
pro-portions of mixtures ranging from 1:1 to 1:9 and a total
concentration of 10
8copies/ml, the detection sensitivity was
10% for the minor population (Fig. 4).
DISCUSSION
[image:5.585.101.487.70.508.2]Here, we present a new method for large-scale HBV
geno-typing and simultaneous quantification of viremia. The method
FIG. 3. Representative results for melting curve analysis of clinical samples with genotypes A to G. (A) Differentiation into the group of
genotypes (B, E, F) and genotypes (A, C, D, G) with the set 1 amplicon. (B) Differentiating genotypes B, E, and F into single genotypes with the
set 2-1 amplicon. (C) Differentiating genotypes A, C, D, and G into single genotypes with the set 2-2 amplicon. In addition, the representative
results of each genotype (left), and the results of many clinical samples (right) are shown. The melting temperature for each genotype is indicated
with a vertical line.
V
OL. 44, 2006
QUANTIFICATION AND GENOTYPING OF HBV BY REAL-TIME PCR
4495
on May 16, 2020 by guest
http://jcm.asm.org/
is based on real-time PCR in the LightCycler format, with
probes targeting segments of the HBV genome that include
nucleotide polymorphisms strongly linked to the genotype.
The genotype is identified by analyzing probe melting
points, and quantification of HBV DNA is obtained by
first-step real-time PCR.
The accuracy of genotyping was verified by analyzing 441
clinical samples representing genotypes A to G. Overall, the
MCA typing provided an accuracy of 92.3%, which was better
than that observed for RFLP (87%). For differentiating
geno-types B, E, and F by MCA, the accuracy was even higher, up
to 96.1%. Due to the appearance of point mutations that
altered the melting point, differentiation of genotypes A, C,
and D was uncertain in some cases (overall accuracy, 88%).
Therefore, an alternative typing method based on multiplex
PCR was developed and applied to these samples, allowing
correct typing of 99%.
An advantage with this new method is that the genotype is
obtained directly from the PCR without further processing.
Moreover, the method was found to have higher precision in
genotyping and sensitivity for mixed-genotype detection equal
to or higher than that of RFLP. A limitation of the method is
that the genotype is not identified by a single reaction. We
suggest that typing be done in a stepwise manner, the first step
separating genotype ACDE from BFG, and the second
iden-tifying the genotype within the ACDE or BFG group. The
higher cost-effectiveness of this approach is important when
the assay is run on LightCycler instruments with only 32
reac-tion capillaries, particularly if larger sets of samples are
geno-typed, for example, in clinical studies. If amplification is
in-stead run in the 96-well format with three reaction mixtures
(set 1, set 2-1, and set 2-2 amplicons) in parallel, e.g., on a
LightCycler 96 instrument, the genotype may alternatively be
obtained directly. This would require inclusion of a 72°C
ex-tension step (which is otherwise used only in the set 2-2 PCR),
but it would allow genotyping of 32 samples per run.
Genotype H was recently identified in Central America.
After analyzing genotype H isolates from GenBank, we predict
that genotype H will have the same melting point as genotype
F, and would thus be typed as F by MCA. However, in most
regions of the world, this limitation of the method would be of
minor importance.
An additional advantage of the method was the
simulta-neous quantification, performed with the set 1 amplicon
amplification, which targets conserved genomic segments.
Pre-viously, a similar method (16) for simultaneous HBV
quanti-fication and genotyping was described. However, that method
is mainly used for differentiation of genotypes B and C, which
are the major HBV genotypes in Asia. The method described
in this study allows quantification in parallel with typing of all
of the genotypes A to G. The quantification was linear over a
broad range of viremia, and its accuracy was documented by
comparison with the Roche Amplicor assay. Although the
comparison with Amplicor indicated that quantification is
ac-curate for all genotypes, this needs to be confirmed by further
analysis of reproducibility panels and clinical samples. An
ad-TABLE 2. Comparison between HBV genotypic analysis using
two-step melting curve analysis with different amplicons and PCR-RFLP
HBV genotyping method Accuracy (%)
Two-step genotypic analysis
Step 1
Differentiation into two genotype groups (A, C,
D, G) and (B, E, F) with set 1 amplicon
a...99.1 (437/441)
Step 2
Differentiating genotypes B, E, and F with
set 2-1 amplicon
a...97.0 (223/230)
Differentiating genotypes A, C, D, and G
with set 2-2 amplicon
a...87.9 (174/198)
Differentiating genotypes A, C, D, and G with
alternative type-specific multiplex PCR ...94.4 (187/198)
Combination of step 1 and step 2 for
differentiating all genotypes
Two-step melting curve analysis with set 1
and set 2-1/set 2-2 ...92.3 (407/441)
Using alternative type-specific multiplex PCR
instead of melting curve analysis with set 2-2 ...98.4 (434/441)
PCR-RFLP
b...87.0 (369/424)
aThese amplicons were used for melting curve analysis.
[image:6.585.43.284.90.281.2]bThe PCR-RFLP method was designed by Lindh et al. (7).
FIG. 4. Determination of HBV mixed infection by melting curve analysis. Different proportions of mixtures of genotype B and G plasmids are
indicated.
on May 16, 2020 by guest
http://jcm.asm.org/
[image:6.585.125.460.530.703.2]vantage of the Amplicor assay compared to our method is the
inclusion of internal inhibition controls and output in IU (by
calibration to a WHO standard). On the other hand, our
real-time PCR method has a much broader detection range and
lower reagent costs. It should be attractive for monitoring
patients during antiviral treatment and for research projects
when output in the IU format is considered less important.
In summary, this study provides a quick and useful HBV
quantification and large-scale genotyping method for
geno-types A to G suitable for research and clinical diagnostics in all
regions of the world.
ACKNOWLEDGMENT
The study was supported by grants from the National Science
Coun-cil, Taiwan, Republic of China (NCS 95-2314-B-006-030).
REFERENCES
1.Arauz-Ruiz, P., H. Norder, B. H. Robertson, and L. O. Magnius.2002. Genotype H: a new Amerindian genotype of hepatitis B virus revealed in
Central America. J. Gen. Virol.83:2059–2073.
2.Buti, M., M. Cotrina, A. Valdes, R. Jardi, F. Rodriguez-Frias, and R. Es-teban.2002. Is hepatitis B virus subtype testing useful in predicting
virolog-ical response and resistance to lamivudine? J. Hepatol.36:445–446.
3.Ding, X., M. Mizokami, G. Yao, B. Xu, E. Orito, R. Ueda, and M. Nakanishi.
2001. Hepatitis B virus genotype distribution among chronic hepatitis B virus
carriers in Shanghai, China. Intervirology44:43–47.
4.Grandjacques, C., P. Pradat, L. Stuyver, M. Chevallier, P. Chevallier, C. Pichoud, M. Maisonnas, C. Trepo, and F. Zoulim.2000. Rapid detection of genotypes and mutations in the pre-core promoter and the pre-core region of hepatitis B virus genome: correlation with viral persistence and disease
severity. J. Hepatol.33:430–439.
5.Kao, J. H., P. J. Chen, M. Y. Lai, and D. S. Chen. 2000. Hepatitis B genotypes correlate with clinical outcomes in patients with chronic hepatitis
B. Gastroenterology118:554–559.
6.Kobayashi, M., Y. Arase, K. Ikeda, A. Tsubota, Y. Suzuki, S. Saitoh, F. Suzuki, N. Akuta, T. Someya, M. Matsuda, J. Sato, and H. Kumada.2002. Clinical characteristics of patients infected with hepatitis B virus genotypes
A, B, and C. J. Gastroenterol.37:35–39.
7.Lindh, M., J. E. Gonzalez, G. Norkrans, and P. Horal.1998. Genotyping of hepatitis B virus by restriction pattern analysis of a pre-S amplicon. J. Virol.
Methods72:163–174.
8.Mizokami, M., T. Nakano, E. Orito, Y. Tanaka, H. Sakugawa, M. Mukaide, and B. H. Robertson.1999. Hepatitis B virus genotype assignment using
restriction fragment length polymorphism patterns. FEBS Lett.450:66–71.
9.Naito, H., S. Hayashi, and K. Abe.2001. Rapid and specific genotyping system for hepatitis B virus corresponding to six major genotypes by PCR
using type-specific primers. J. Clin. Microbiol.39:362–364.
10.Naumann, H., S. Schaefer, C. F. Yoshida, A. M. Gaspar, R. Repp, and W. H. Gerlich.1993. Identification of a new hepatitis B virus (HBV) genotype from Brazil that expresses HBV surface antigen subtype adw4. J. Gen. Virol.
74:1627–1632.
11.Noborg, U., A. Gusdal, E. K. Pisa, A. Hedrum, and M. Lindh.1999. Auto-mated quantitative analysis of hepatitis B virus DNA by using the Cobas
Amplicor HBV monitor test. J. Clin. Microbiol.37:2793–2797.
12.Norder, H., A. M. Courouce, and L. O. Magnius.1994. Complete genomes, phylogenetic relatedness, and structural proteins of six strains of the hepatitis
B virus, four of which represent two new genotypes. Virology198:489–503.
13.Okamoto, H., F. Tsuda, H. Sakugawa, R. I. Sastrosoewignjo, M. Imai, Y. Miyakawa, and M. Mayumi.1988. Typing hepatitis B virus by homology in nucleotide sequence: comparison of surface antigen subtypes. J. Gen. Virol.
69:2575–2583.
14.Orito, E., T. Ichida, H. Sakugawa, M. Sata, N. Horiike, K. Hino, K. Okita, T. Okanoue, S. Iino, E. Tanaka, K. Suzuki, H. Watanabe, S. Hige, and M. Mizokami.2001. Geographic distribution of hepatitis B virus (HBV)
geno-type in patients with chronic HBV infection in Japan. Hepatology34:590–
594.
15.Orito, E., M. Mizokami, Y. Ina, E. N. Moriyama, N. Kameshima, M. Yamamoto, and T. Gojobori.1989. Host-independent evolution and a ge-netic classification of the hepadnavirus family based on nucleotide
se-quences. Proc. Natl. Acad. Sci. USA86:7059–7062.
16.Payungporn, S., P. Tangkijvanich, P. Jantaradsamee, A. Theamboonlers, and Y. Poovorawan.2004. Simultaneous quantitation and genotyping of hepatitis B virus by real-time PCR and melting curve analysis. J. Virol.
Methods120:131–140.
17.Stuyver, L., S. De Gendt, C. Van Geyt, F. Zoulim, M. Fried, R. F. Schinazi, and R. Rossau.2000. A new genotype of hepatitis B virus: complete genome
and phylogenetic relatedness. J. Gen. Virol.81:67–74.
18.Usuda, S., H. Okamoto, T. Tanaka, K. Kidd-Ljunggren, P. V. Holland, Y. Miyakawa, and M. Mayumi.2000. Differentiation of hepatitis B virus geno-types D and E by ELISA using monoclonal antibodies to epitopes on the
preS2-region product. J. Virol. Methods87:81–89.
19.Yeh, S. H., C. Y. Tsai, J. H. Kao, C. J. Liu, T. J. Kuo, M. W. Lin, W. L. Huang, S. F. Lu, J. Jih, D. S. Chen, and P. J. Chen.2004. Quantification and genotyping of hepatitis B virus in a single reaction by real-time PCR and
melting curve analysis. J. Hepatol.41:659–666.
20.Zollner, B., J. Petersen, M. Schroter, R. Laufs, V. Schoder, and H. H. Feucht.2001. 20-fold increase in risk of lamivudine resistance in hepatitis B
virus subtype adw. Lancet357:934–935.