ISSN 2250-3153
Employee Level Inventory Control by Integrated Coding
Of Raw Materials
Midhun Baby Neerkuzhi*, Jenson Joseph E**
*
Department Of Mechanical Engineering, SCMS School Of Engineering and Technology, Ernakulam
**
Department Of Mechanical Engineering, SCMS School Of Engineering and Technology, Ernakulam
Abstract- Raw materials are commonly stored inventories or work in process inventories. These inventories are handled by employees include engineering team,raw material management team, and bottom level workers. Engineers are doing the technical as well as R&D task of raw materials. Management teammanages the raw materials in an economic way to avoid shortage. Workers employ physical means to get desired properties and desired shapes ofthe raw material. Lack of attention of any ofthe employee will badly affect the company's performance. This paper introduces a raw material management system using employee’s attention. It is an integrated coding method. Three letters are used to represent each raw material, first alphabet is for R and D team, second alphabet is for raw material management team and last alphabet for thebottomlevelworkers. This integrated coding system will give an idea about how much attention is required to be given to each item by each employee.
Index Terms- Raw material control, inventory control, material management,integrated coding
I. INTRODUCTION
or thesuccess of an industry it is important that concerned employeesmust know which raw material requires their utmost attention.In the case of raw material handling, this minute level attention is very important, because raw materials are the building blocks of the product. Most of the money of a short term budget in a production industry is spend for the raw materials.If employee attention is given to all raw materials in the making of a product, thenit may not be economic. Different raw materials require attention from different employee level, for example costly raw materials need care from bottom level workers to avoid wastage,but the same raw material may not need that much care from raw material managers, because the chance for shortage may be less. An integrated coding system will help to develop sophisticated employee level raw material management. This integrated coding is very helpful when large varieties of raw materials are processed in the same industry. Then, it leads to a perfect management. This study is conducted at fabrication department of Kerala Automobiles Limited, Thiruvananthapuram, Kerala, India. This integrated coding system will reduce wastage of items and shortage of raw materials. It also helps to identify the material which requires cost effective Research and Development. Workers can reduce wastage of costly items, material engineers can identify proper raw materialswhich require R&D , and managers can avoid stock outs. This integrated coding will give corresponding information to raw material management team,raw material engineering team, and workers for proper attention during their work.
II. DATA COLLECTION
This work was doneat fabrication department of Kerala Automobiles Limited. Raw materials used in the fabrication department wasselected for this study. Material details are given below
Table2.1:Data collection
SI NO ITEM QUANTITY NEEDED (for one product) UNIT COST(RS)
1 M S SHEET(1mm) 6.25 kg 53.27
2 M S SHEET(1.5mm) 4.4 kg 53.27
3 M S SHEET(2mm) 5.7 kg 53.27
4 M S SHEET(2.5mm) 2 kg 54.52
5 M S SHEET(3mm) 0.6 kg 54.52
6 M S SHEET(4mm) 3 kg 47.85
7 M S SHEET(5mm) 0.2 kg 47.85
8 M S PIPE(40*2.5mm) 11m 189
9 M S PIPE(63.5*3.25mm) 0.643m 394
10 M S PIPE( 46*3mm) 0.39m 261
ISSN 2250-3153
11 M S PIPE(35*6mm) 0.508m 190
12 M S PIPE( 35*2mm) 0.702m 135
13 MS PIPE (38*4mm) 0.534m 289
14 M S PIPE (42*1mm) 0.66m 88
15 M S PIPE( 46*3mm) 0.39m 261
16 M S PIPE( 56*3mm) 1m 322
17 M S PIPE(63.5*4mm) 0.92m 420
18 M S PIPE(42*3.5mm) 0.262m 269
19 M S PIPE(30*1mm) 1.343m 62
20 M S ROD(20mm) 1.343m 104
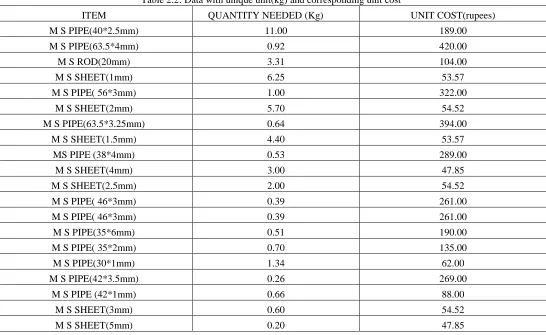
[image:2.612.35.581.262.597.2]For the convenience of further calculations, the unit of quantity needed(initially in m and kg) was converted to a unique unit(kg). The corresponding data is given below
Table 2.2: Data with unique unit(kg) and corresponding unit cost
ITEM QUANTITY NEEDED (Kg) UNIT COST(rupees)
M S PIPE(40*2.5mm) 11.00 189.00
M S PIPE(63.5*4mm) 0.92 420.00
M S ROD(20mm) 3.31 104.00
M S SHEET(1mm) 6.25 53.57
M S PIPE( 56*3mm) 1.00 322.00
M S SHEET(2mm) 5.70 54.52
M S PIPE(63.5*3.25mm) 0.64 394.00
M S SHEET(1.5mm) 4.40 53.57
MS PIPE (38*4mm) 0.53 289.00
M S SHEET(4mm) 3.00 47.85
M S SHEET(2.5mm) 2.00 54.52
M S PIPE( 46*3mm) 0.39 261.00
M S PIPE( 46*3mm) 0.39 261.00
M S PIPE(35*6mm) 0.51 190.00
M S PIPE( 35*2mm) 0.70 135.00
M S PIPE(30*1mm) 1.34 62.00
M S PIPE(42*3.5mm) 0.26 269.00
M S PIPE (42*1mm) 0.66 88.00
M S SHEET(3mm) 0.60 54.52
M S SHEET(5mm) 0.20 47.85
III. WORK DONE
Integration of ABC, FSN, HML classifications are used here. ABC classification is helpful for the Research and Development team to identify the raw materials which need more concentration. FSN is helpful for avoiding shortage and reducing the carrying cost of items. HML classification is helpful for workersin reducing the wastage of costly raw materials.
3.1.ABC CLASSIFICATION
ISSN 2250-3153
is to reduce the production cost. So they try to reduce the usage value of each items. They can spend more time and money in high usage valued items.Reduction in usage value automatically leads to reduction in production cost. This will lead to profit of the company. The procedureis given below
1. Obtain the usage value of each item from the collected data.
Usage value of each item = Quantity demanded for single product * Unit Cost 2. Arranging the data in descending order based on usage values.
3. Classify the top 20% of the parts as A, the next 30% of the parts as B and the remaining parts as C.
Table3.1.1:Calculation of usage value
ITEM NEED FOR SINGLE PRODUCT (Kg) UNIT COST(RS) USAGE VALUE
M S PIPE(40*2.5mm) 11.00 189.00 2079.00
M S PIPE(63.5*4mm) 0.92 420.00 386.40
M S ROD(20mm) 3.31 104.00 344.28
M S SHEET(1mm) 6.25 53.57 334.81
M S PIPE( 56*3mm) 1.00 322.00 322.00
M S SHEET(2mm) 5.70 54.52 310.76
M S PIPE(63.5*3.25mm) 0.64 394.00 253.34
M S SHEET(1.5mm) 4.40 53.57 235.71
MS PIPE (38*4mm) 0.53 289.00 154.33
M S SHEET(4mm) 3.00 47.85 143.55
M S SHEET(2.5mm) 2.00 54.52 109.04
M S PIPE( 46*3mm) 0.39 261.00 101.79
M S PIPE( 46*3mm) 0.39 261.00 101.79
M S PIPE(35*6mm) 0.51 190.00 96.52
M S PIPE( 35*2mm) 0.70 135.00 94.77
M S PIPE(30*1mm) 1.34 62.00 83.27
M S PIPE(42*3.5mm) 0.26 269.00 70.48
M S PIPE (42*1mm) 0.66 88.00 58.08
M S SHEET(3mm) 0.60 54.52 32.71
M S SHEET(5mm) 0.20 47.85 9.57
Table3.1.2: ABC classification based on the usage value
ITEM CLASS
M S PIPE(40*2.5mm) A
M S PIPE(63.5*4mm) A
M S ROD(20mm) A
M S SHEET(1mm) A
M S PIPE( 56*3mm) B
M S SHEET(2mm) B
M S PIPE(63.5*3.25mm) B
M S SHEET(1.5mm) B
MS PIPE (38*4mm) B
M S SHEET(4mm) B
M S SHEET(2.5mm) C
M S PIPE( 46*3mm) C
M S PIPE( 46*3mm) C
ISSN 2250-3153
M S PIPE( 35*2mm) C
M S PIPE(30*1mm) C
M S PIPE(42*3.5mm) C
M S PIPE (42*1mm) C
M S SHEET(3mm) C
M S SHEET(5mm) C
3.2.FSN CLASSIFICATION
FSN classification is used to classify the fastmoving parts from the slow and non-moving parts. The parts having the highest need in the manufacturing process are classified as fast moving and the parts having the least demand are classified as slow-moving. The remaining are classified as non-moving. This will be helpful for the raw material management team. They can arrange items based on theneed for certain period of time, also care can be given for avoiding the shortage of items. Items having more chances for shortage are classified as F.
The FSN classification procedure is given below
1. Obtaining the annual need for each raw material.
2. Arranging the data in descending order based on the annual need.
3. Calculate the first and third limits (H1 and H3) as (n+1)/4 and 3(n+1)/4, where “n” is the number of raw materials 4. Classifying the items using the following criteria:
If annual need >H3 ,Classify as Fast Moving
If annual need <H1 ,Classify as Non-Moving ..Otherwise Classify as Slow Moving. H1 and H3 for this situation (for n=20) is,H1=5.25, H3=15.75
Table3.2.1:Calculation of annual demand
SI NO ITEM QUANTITY NEEDED( in kg) ANNUAL NEED (kg)
1 M S SHEET(1mm) 6.25 37500
2 M S SHEET(1.5mm) 4.4 26400
3 M S SHEET(2mm) 5.7 34200
4 M S SHEET(2.5mm) 2 12000
5 M S SHEET(3mm) 0.6 3600
6 M S SHEET(4mm) 3 18000
7 M S SHEET(5mm) 0.2 1200
8 M S PIPE(40*2.5mm) 27.63 165792
9 M S PIPE(63.5*3.25mm) 3.33 20000
10 M S PIPE( 46*3mm) 1.35 8112
11 M S PIPE(35*6mm) 2.67 16079
12 M S PIPE( 35*2mm) 1.23 7406
13 MS PIPE (38*4mm) 2.03 12234
14 M S PIPE (42*1mm) 0.69 4178
15 M S PIPE( 46*3mm) 1.35 8112
16 M S PIPE( 56*3mm) 4.22 25321
17 M S PIPE(63.5*4mm) 5.87 35220
18 M S PIPE(42*3.5mm) 0.96 5805
19 M S PIPE(30*1mm) 1.01 6073
[image:4.612.196.418.54.150.2]20 M S ROD(20mm) 3.31 19862
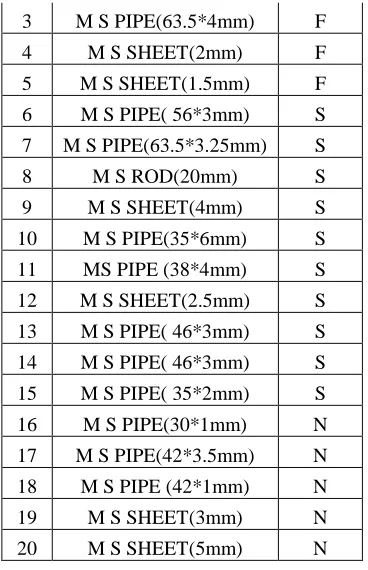
Table 1.2.2Classification based on annual demand
NO ITEM CLASS
1 M S PIPE(40*2.5mm) F
ISSN 2250-3153
3 M S PIPE(63.5*4mm) F
4 M S SHEET(2mm) F
5 M S SHEET(1.5mm) F
6 M S PIPE( 56*3mm) S
7 M S PIPE(63.5*3.25mm) S
8 M S ROD(20mm) S
9 M S SHEET(4mm) S
10 M S PIPE(35*6mm) S
11 MS PIPE (38*4mm) S
12 M S SHEET(2.5mm) S
13 M S PIPE( 46*3mm) S
14 M S PIPE( 46*3mm) S
15 M S PIPE( 35*2mm) S
16 M S PIPE(30*1mm) N
17 M S PIPE(42*3.5mm) N
18 M S PIPE (42*1mm) N
19 M S SHEET(3mm) N
20 M S SHEET(5mm) N
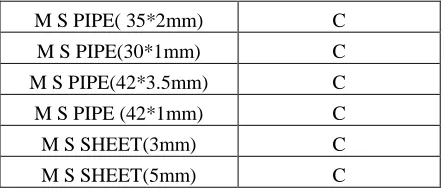
3.3.HML CLASSIFICATION
[image:5.612.215.399.53.338.2]The raw material are listed in the descending order of unit cost. This will help the workers to identify items, whichneed to be processed with minimum wastage. Items that require extra care are classified as H, minimum wastage should be maintained for such items. Since H items are very costly items, even wastage of small a small quantity will lead to a big loss.Items that need moderate care and moderate wastage are classified as M, whereas items that require fast processing are classified as L. For L items wastage is not important.
Table 3.3.1Unit cost of items
SI NO ITEM UNIT COST(RS)
1 M S SHEET(1mm) 53.27
2 M S SHEET(1.5mm) 53.27
3 M S SHEET(2mm) 53.27
4 M S SHEET(2.5mm) 54.52
5 M S SHEET(3mm) 54.52
6 M S SHEET(4mm) 47.85
7 M S SHEET(5mm) 47.85
8 M S PIPE(40*2.5mm) 75.24
9 M S PIPE(63.5*3.25mm) 76.00
10 M S PIPE( 46*3mm) 75.29
11 M S PIPE(35*6mm) 36.02
12 M S PIPE( 35*2mm) 76.77
13 MS PIPE (38*4mm) 75.69
14 M S PIPE (42*1mm) 83.41
15 M S PIPE( 46*3mm) 75.29
16 M S PIPE( 56*3mm) 76.30
17 M S PIPE(63.5*4mm) 65.83
ISSN 2250-3153
19 M S PIPE(30*1mm) 82.27
20 M S ROD(20mm) 109.00
Table 3.3.2. Classification based on unit cost
ITEM COST (for 1kg) CLASS
M S ROD(20mm) 109.00 H
M S PIPE (42*1mm) 83.41 H
M S PIPE(30*1mm) 82.27 H
M S PIPE( 35*2mm) 76.77 M
M S PIPE( 56*3mm) 76.30 M
M S PIPE(63.5*3.25mm) 76.00 M
MS PIPE (38*4mm) 75.69 M
M S PIPE( 46*3mm) 75.29 M
M S PIPE( 46*3mm) 75.29 M
M S PIPE(40*2.5mm) 75.24 M
M S PIPE(42*3.5mm) 72.85 M
M S PIPE(63.5*4mm) 65.83 M
M S SHEET(2.5mm) 54.52 M
M S SHEET(3mm) 54.52 M
M S SHEET(1mm) 53.27 M
M S SHEET(1.5mm) 53.27 M
M S SHEET(2mm) 53.27 M
M S SHEET(4mm) 47.85 M
M S SHEET(5mm) 47.85 M
M S PIPE(35*6mm) 36.02 L
IV. RESULT AND DISCUSSIONS
Each raw material was given a code by combining ABC, FSN and HML classifications. The integration of classificationsare given in the table below
Table4.1.Classification and coding
NO ITEM ABC
CLASSIFICATION
FSN CLASSIFICATION
HML CLASSIFICATION
ITEM CODE
1 M S SHEET(1mm) A F M AFM
2 M S SHEET(1.5mm) B F M BFM
3 M S SHEET(2mm) B F M BFM
4 M S SHEET(2.5mm) C S M CSM
5 M S SHEET(3mm) C N M CNM
6 M S SHEET(4mm) B S M BSM
7 M S SHEET(5mm) C N M CNM
8 M S PIPE(40*2.5mm) A F M AFM
9 M S PIPE(63.5*3.25mm) B S M BSM
10 M S PIPE( 46*3mm) C S M CSM
11 M S PIPE(35*6mm) C S L CSL
ISSN 2250-3153
13 MS PIPE (38*4mm) B S M BSM
14 M S PIPE (42*1mm) C N H CNH
15 M S PIPE( 46*3mm) C S M CSM
16 M S PIPE( 56*3mm) B S M BSM
17 M S PIPE(63.5*4mm) A F M AFM
18 M S PIPE(42*3.5mm) C N M CNM
19 M S PIPE(30*1mm) C N H CNH
20 M S ROD(20mm) A S H ASH
These item codes will help the employees to understand which type of care should be given for each raw material. This will help in storing, processing and ordering of raw materials according to their importance. For example, item with the code AFLhave more usage value. So more care should be givento reduce the usage value.Also F Indicates, it is a fast moving material, so care should be given to avoid stock outs. L indicates that less care is required, and processing time is important.
V. CONCLUSIONS
Wastage of costly items, improper storage of raw materials and shortage of items are the main problems in fabrication department. Till now there was no proper method for controlling inventories at employee level . Proper classification and coding of raw materialshelp to eliminate these problems. After the introduction of this integrated coding system, employees can identify the raw material which needs their care. Workers can identify the costly materials and give their attention to reduce its wastage. Manager can give care to avoid stock outs. If the usage value of anitem reduces, the entire production cost of product get reduced. So this is helpful for R&D to identify where the material research should be done
.
This methodalso has good application in the case of medium and small scale industries. This system will have more applications when this method isincorporated with electronic identification systems.REFERENCES
[1] Siddharth Parekh, Theodore A. Kozman, Jim Lee.a decision support system for inventory management, 2006
[2] Kljajic, M., D. Kofjac, A. Skraba and V. Rejec.. “Warehouse optimization in an uncertain environment,” Proceedings of the 22nd
International Conference of the System Dynamics Society, Oxford, England, 2004 [3] Larson, S.E. Inventory systems and control handbook.,1980,pp 2-16
AUTHORS
First Author – Midhun Baby Neerkuzhi, B tech Mechanical Engineering, SCMSSchool of Engineering and Technology,[email protected]