Biology Dissertations Department of Biology
12-15-2016
Molecular Mechanism of Pseudmonas Aeruginosa
Responses to Spermine Stress
Yu-chih Peng
Follow this and additional works at:https://scholarworks.gsu.edu/biology_diss
This Dissertation is brought to you for free and open access by the Department of Biology at ScholarWorks @ Georgia State University. It has been accepted for inclusion in Biology Dissertations by an authorized administrator of ScholarWorks @ Georgia State University. For more information, please [email protected].
Recommended Citation
Peng, Yu-chih, "Molecular Mechanism of Pseudmonas Aeruginosa Responses to Spermine Stress." Dissertation, Georgia State University, 2016.
RESPONSES TO SPERMINE STRESS
by
Yu-Chih Peng
Under the Direction of Chung-Dar Lu, PhD
ABSTRACT
Pseudomonas aeruginosa can grow efficiently on spermine and other biogenic
polyamines via the γ-glutamylpolyamine synthetase (GPS) pathway. Not only subjected to
growth inhibition by spermine, the pauA2 mutant without a functional γ-glutamylpolyamine
synthetase PauA2 became more sensitive to β-lactam antibiotics in human serum. To explore
PauA2 as a potential target of drug development, the native form of PauA2 protein
overexpressed in E. coli was purified to homogeneity for biochemical characterization. The
specific activity of PauA2 was monitored by spectrophotometric measurements (660 nm) of the
releasing phosphate from ATP in the presence of ammonium molybdate and malachite green.
1.1mM for ATP, L-glutamate, spermidine, and spermine, respectively. The obtained values of
Hill coefficient were 3.4 and 5.4 for spermidine and spermine, respectively.
Although P. aeruginosa can degrade the spermine by PauA2, it seems likely that other
mechanisms may alleviate the spermine toxicity in the absence of pauA2. All the pauA2
suppressors wereisolated from spermine selection plates and shared common changes in various
pathways including delayed growth rate, retarded swarming motility, and pyocyanin
overproduction. Genome resequencing of a representative suppressor revealed a unique C599T
mutation at the phoU gene that results in Ser200Leu substitution and a constitutive expression of
the Pho regulon as evidenced by measurements of promotor activities and transcriptome
analysis. All of the observed phenotypes could be complemented by a recombinant plasmid
carrying the wild-type phoU gene. Also, accumulation of polyphosphate granules and spermine
resistance in the suppressor mutant were reversed concomitantly when exopolyphosphatase PPX
was overexpressed from a recombinant plasmid. Identical phenotypes were also observed in a
ΔpauA2ΔphoU double knockout mutant.
In conclusion, we characterized the γ-glutamylspermine synthetase PauA2 as the
essential enzyme and provide the foundations for PauA2 inhibitors screening as a potential
antibacterial. Furthermore, we identified polyphosphate accumulation as a potential protection
mechanism against spermine toxicity in P. aeruginosa.
RESPONSES TO SPERMINE STRESS
by
Yu-Chih Peng
A Dissertation Submitted in Partial Fulfillment of the Requirements for the Degree of
Doctor of Philosophy
in the College of Arts and Sciences
Georgia State University
Copyright by Yu-Chih Peng
RESPONSES TO SPERMINE STRESS
by
Yu-Chih Peng
Committee Chair: Chung-Dar Lu
Committee: Zehava Eichenbaum
Irene Webber
Electronic Version Approved:
Office of Graduate Studies
College of Arts and Sciences
Georgia State University
DEDICATION
This is dedicated to my family and my girlfriend, Yu-Chien Peng, for the unwavering
ACKNOWLEDGEMENTS
Over the past six years, I have received so many support and encouragement from my
committee members and friends. My advisor, Dr. Chung-Dar Lu, always encourage me to pursue
this academic goal of a Ph.D. degree. By his guidance, I can complete this thoughtful and
rewarding journey. I would like to thank my committee members of Dr. Zehava Eichenbaum and
Dr. Irene Weber for their support and insightful suggestions over four years. Finally, I also want
to thank all the friends, who supported, inspired, and encouraged me by their valuable advice and
TABLE OF CONTENTS
ACKNOWLEDGEMENTS ... ii
LIST OF TABLES ... viii
LIST OF FIGURES ... ix
1 GENERAL INTRODUCTION ... 1
1.1 Physiology functions of polyamines ... 2
1.2 Polyamines Metabolism ... 4
1.2.1 Polyamines transport system ... 4
1.2.2 Polyamine biosynthesis ... 4
1.2.3 Polyamine catabolism ... 7
1.3 The γ-glutamylation pathway... 9
1.4 Polyamine/spermine effects on β-lactam antibiotics ... 11
1.5 Research overview ... 12
2 CHAPTER ONE: FUNCTIONAL CHARACTERIZATIONS OF γ-GLUTAMYLPOLYAMINE SYNTHETASES PAUA1 AND PAUA2 IN POLYAMINE UTILIZATION PATHWAY OF PSEUDMONOAS AERUGINOSA ... 13
2.1 Introduction ... 13
2.2 Experiments ... 15
2.2.1 Bacterial, plasmid strain, and growth condition ... 15
2.2.3 Protein purification of γ-glutamylpolyamine synthetase PauA1 and PauA2
... 16
2.2.4 Malachite green ATPase assay for PauA1 and PauA2 ... 17
2.2.5 Optimal pH and temperature ... 18
2.2.6 Substrate and cofactor specificity ... 18
2.2.7 Gel filtration analysis ... 19
2.2.8 PauA2 inhibitor screening ... 19
2.2.9 Multiple sequences alignment of GS and GPS in E. coli and P. aeruginosa ... 20
2.2.10 Computational prediction of structure and substrate binding sites ... 20
2.3 Results ... 21
2.3.1 Malachite green ATPase assay for PauA1 and PauA2 activity ... 21
2.3.2 Divalent cation is required for the specific activity of PauA1 and PauA2 25 2.3.3 Optimal pH and temperature ... 28
2.3.4 Substrate specificity for polyamines ... 31
2.3.5 Steady-state kinetics of PauA1 and PauA2 ... 34
2.3.6 Gel filtration analysis ... 38
2.3.7 PauA2 inhibitor screening ... 40
2.3.9 Computational prediction of structure and substrate binding sites ... 48
2.4 Discussion ... 49
2.4.1 Kinetic studies of γ-glutamylpolyamine synthetase PauA1 and PauA2... 49
2.4.2 PauA2 inhibitors screening ... 50
2.4.3 Multiple sequences alignment of GS and GPS ... 51
3 CHAPTER TWO: INDUCTION OF THE PHO REGULON AND POLYPHOSPHATE SYNTHESIS AGAINST SPERMINE STRESS IN PSEUDOMONAS AERUGINOSA ... 53
3.1 INTRODUCTION ... 53
3.2 EXPERIMENTS ... 56
3.2.1 Bacterial strain and growth media ... 56
3.2.2 Construction of pauA2 and phoU mutants ... 56
3.2.3 Spermine and acetylspermine susceptibility test ... 57
3.2.4 Pyocyanin quantitation assay ... 57
3.2.5 Genome resequencing ... 58
3.2.6 Swimming, swarming and twitching motility assays ... 58
3.2.7 Rhamnolipid production assay ... 58
3.2.8 Biofilm quantitation assay ... 59
3.2.9 Measurements of promoter activities ... 59
3.2.11 Neisser stain ... 60
3.3 RESULTS ... 62
3.3.1 Isolation of spermine-resistant mutants in P. aeruginosa devoid of the glutamylpolyamine synthetase PauA2 ... 62
3.3.2 Genome resequencing revealed a single substitution at the phoU gene .... 64
3.3.3 Phenotypic analyses ... 67
3.3.4 Measurements of pstS and pstC promoter activities ... 74
3.3.5 Constitutively active pstS promoter as a common trait in spermine-resistant suppressors ... 76
3.3.6 Detection of polyphosphate overproduction in phoU mutants ... 77
3.3.7 Hydrolysis of polyphosphate by PPX reverses the spermine-resistant phenotype ... 79
3.3.8 Transcriptome analysis of H103, H298, and H300 ... 82
3.3.9 AphA and AphB converted acetylspermine to spermine ... 86
3.4 DISCUSSION ... 88
3.4.1 Selection against spermine toxicity results predominantly in loss-of-function phoU mutations ... 88
3.4.2 Polyphosphate accumulation antagonizes spermine toxicity ... 88
3.4.3 Activation of the Pho regulon in the phoU mutant ... 89
3.4.5 The working model... 90
REFERENCES ... 92
4 APPEDEX ... 99
LIST OF TABLES
Table 2.3.1 Polyamine specificity of PauA2 ... 33
Table 2.3.2 Summary of kinetic parameters for PauA1 ... 36
Table 2.3.3 Summary of kinetic parameters for PauA2 ... 37
Table 2.3.4 Summary of MW, Ve, and Kav of the standard proteins in gel filtration analysis ... 39
Table 2.3.5 PauA2 inhibitor screening ... 41
Table 2.3.6 Summary of molecular weight, chemical structure, and IC50 of PauA2 inhibitors ... 43
Table 3.3.1 Spermine susceptibility and doubling time measurements of P. aeruginosa wild-type and ΔpauA2 mutants ... 63
Table 3.3.2 Spermine susceptibility of P. aeruginosa wild-type and mutants. ... 66
Table 3.3.3 Doubling time measurements of P. aeruginosa wild-type and mutants ... 67
Table 3.3.4 Spermine susceptibility of P. aeruginosa wild-type and mutants ... 80
Table S1 Primers used in this study ... 99
Table S2 The strains and plasmids used in the chapter one ... 100
Table S3 The strains and plasmids used in the chapter two ... 101
Table S4 Transcriptome analysis: H103 (WT) vs H298 (ΔpauA2) vs H300 (ΔpauA2 phoU599) ... 103
Table S5 Transcriptome analysis: sorted against gene function ... 115
LIST OF FIGURES
Figure 1.1.1 The chemical structures of common polyamines ... 3
Figure 1.2.1 A schematic diagram depicting the polyamines biosynthesis in E. coli ... 6
Figure 1.3.1 The glutamylation pathway for putrescine in E.coli ... 10
Figure 1.3.2 The putative glutamylation pathway in P. aeruginosa ... 10
Figure 2.3.1 Standard curve of malachite green ATPase assay ... 22
Figure 2.3.2 Efficacy of stop agents in ATPase assay ... 23
Figure 2.3.3 Effects of ATP concentration on ATP autohydrolysis ... 23
Figure 2.3.4 Effect of pH on ATP autohydrolysis ... 24
Figure 2.3.5 Effect of temperature on ATP autohydrolysis ... 24
Figure 2.3.6 Divalent cation preference of PauA1 activity... 26
Figure 2.3.7 Specific activities of PauA1 with a titration of manganese ions ... 26
Figure 2.3.8 Divalent cation preference of PauA2 activity... 27
Figure 2.3.9 Specific activities of PauA2 with titrations of manganese, magnesium, and cobalt ions ... 27
Figure 2.3.10 Effect of pH on PauA1 activity ... 28
Figure 2.3.11 Effect of temperature on PauA1 activity ... 29
Figure 2.3.12 Effect of pH on PauA2 activity ... 29
Figure 2.3.13 Effect of temperature on PauA2 activity ... 30
Figure 2.3.14 Heat stability of PauA2 ... 30
Figure 2.3.15 Polyamine specificity of PauA1 with 1mM manganese ... 32
Figure 2.3.17 Concentration-velocity curves of PauA1 under two divalent cation condition
... 35
Figure 2.3.18 Concentration-velocity curves of PauA2 ... 37
Figure 2.3.19 Calibration curve of standard proteins on Superose 12 10/300GL column ... 39
Figure 2.3.20 IC50 determination of PauA2 activity ... 43
Figure 2.3.21 Alignment of GS and GPS of E. coli and P. aeruginosa ... 47
Figure 2.3.22 3D model of PauA2 protein with predicted substrate binding sites... 48
Figure 3.3.1 Schematic presentation of gene clusters in phosphate transport and its regulatory system in P. aeruginosa... 66
Figure 3.3.2 Pyocyanin quantitation assays for P. aeruginosa H103 and its derivatives ... 69
Figure 3.3.3 Biofilm quantitation assay of P. aeruginosa H103 and its derivatives ... 71
Figure 3.3.4 Motility phenotype analysis of P. aeruginosa H103 and its derivatives ... 73
Figure 3.3.5 Analysis of the pstS and pstC promoter activities in P. aeruginosa H103 and its derivatives ... 75
Figure 3.3.6 Bright-field micrographs of Neisser-stained P. aeruginosa H103 and its derivatives ... 78
Figure 3.3.7 Bright-field micrographs of Neisser-stained P. aeruginosa H303 and H307 ... 80
Figure 3.3.8 Swarming motility of P. aeruginosa H300 and H304 ... 81
Figure 3.3.9 Pyocyanin quantitation assays for P. aeruginosa H300 and H304 ... 81
Figure 3.3.10 Heat map representation of differential expression profiling in P. aeruginosa H103 (WT), H298 (ΔpauA2), and H300 (ΔpauA2 phoU599) ... 85
Figure 3.4.1 Schematic representations of a working model for polyphosphate
accumulation against spermine toxicity. ... 91
1 GENERAL INTRODUCTION
Polyamines are a group of organic compounds with a long-chain carbon backbone and
multiple amine groups and are widely distributed in all three domains of life. Due to the
positively charged amine groups, polyamines can interact with polyanionic macromolecules, e.g.
DNA and RNA. Spermine, one of the polyamines, has been studied for its functional and
regulatory roles in the DNA/RNA binding (Bryson & Greenall, 2000), the activation of Ca2+
-sensing receptor (Rocha et al., 2015), and the ROS production (Gobert & Wilson, 2016;
Setyawan et al., 2016). In human, spermine is essential for cell proliferation, and is overproduced
in cancer cells (Amendola et al., 2009) and cells infected by RNA viruses (Mounce, Cesaro, et
al., 2016; Mounce, Poirier, et al., 2016). Also, spermine released from the damaged cell can
inhibit the activation of macrophage at the site of inflammation (Zhang, Wang, & Tracey, 2000).
On the contrary, most bacteria, in general, do not synthesize spermine. When in excess, spermine
exerts a strong adverse effect on cell growth (Rosenthal, Fisher, & Stohlman, 1952). Thus, it is
essential for the cell to maintain the homeostasis of spermine through a tight control of
catabolism and biosynthesis. In P. aeruginosa, spermine toxicity is reduced by the
γ-glutamylation pathway (Yao, He, & Lu, 2011). Therefore, my dissertation focused on the
spermine metabolism and the responses to spermine stress in the model pathogen P. aeruginosa.
In chapter one, I characterized two of γ-glutamylpolyamine synthetases, PauA1 and PauA2, in P.
aeruginosa. These results can provide the foundation of knowledge for the inhibitor development
of a potential antimicrobial target PauA2. In chapter two, we elucidated how P. aeruginosa
responds the spermine stress by an alternative defensive mechanism in the absence of the
1.1 Physiology functions of polyamines
Polyamines are a group of aliphatic compounds with multiple amine groups. Although
putrescine, spermidine, and spermine are the most common biogenic polyamines found in all
three domains of life (Fig. 1.1.1), the distribution of polyamines varies between prokaryotes and
eukaryotes. In general, putrescine and spermidine are the most dominant polyamines in bacteria,
while spermidine and spermine exist in eukaryotes, e.g. humans. Because of the positively
charged amine groups, polyamines can serve as the ubiquitous structural components with
polyanionic macromolecules, DNA & RNA, by the charge interaction (Cohen, 1997).
Many studies reported that the intracellular level of polyamines is significantly elevated
in the cancer cells (Woolridge, Martinez, Stringer, & Gerner, 1999). Thus, polyamine
metabolism is considered as a therapeutic target for the cancer therapy (Gupta, Pachauri, Ghosh,
& Rajam, 2016; Nakanishi & Cleveland, 2016). Many compounds are designed to target the
polyamine uptake and biosynthesis for the disruption of the cellular polyamine homeostasis.
Also, it was reported that polyamines can facilitate the infection by RNA viruses, including
chikungunya virus, Zika virus, and Ebola virus (Mounce, Cesaro, et al., 2016). Several studies
demonstrated that the inhibition of polyamine biosynthesis can restrict the viral translation and
replication (Mounce, Poirier, et al., 2016; Olsen et al., 2016). Furthermore, spermine plays a
regulatory role in the innate immunity. Spermine inhibits the pro-inflammatory gene expression
to prevent the activation of macrophage at the infection site during the pre-inflammation (Zhang
In bacteria, the polyamine depletion caused by the defective polyamine biosynthesis
results in a growth retardation phenotype (Lu, Itoh, Nakada, & Jiang, 2002; Nakada & Itoh,
2003). Also, polyamines play a regulatory role in the bacterial physiology, including swarming
motility (Dela Vega & Delcour, 1996), biofilm formation (Karatan, Duncan, & Watnick, 2005),
resistance to nitrosative stress (Bower & Mulvey, 2006) and reactive oxygen species (Gobert &
Wilson, 2016), response to DNA damage (Kim & Oh, 2000), and bacterial virulence (Leuzzi et
al., 2015). In E. coli, a concept of polyamines modulon was proposed suggesting polyamines can
increase a group of genes at the level of translation by enhancing the translational initiation
(Igarashi & Kashiwagi, 2006, 2011). However, more molecular mechanisms of the polyamine
effects on bacterial physiology remain to be elucidated.
1.2 Polyamines Metabolism
Although polyamine are required for cell growth, they also exerts a strong adverse effect
on cell growth when in excess (Rosenthal et al., 1952). To avoid a potentially adverse effect of
spermine, the cells maintain the spermine homeostasis through a tight control of uptake,
biosynthesis, and catabolism.
1.2.1 Polyamines transport system
Most bacteria possess a polyamine transport system to uptake polyamines into cells. The
polyamine transport system in general consists of a polyamine-binding protein and an ABC
transporter (two channel-forming proteins and a membrane-associated ATPase). In E. coli,
PotABCD and PotGHIF have been reported to form a spermidine-preferential and a
putrescine-specific of ABC transporter systems, respectively (Igarashi & Kashiwagi, 1999). In P.
aeruginosa, the spermine/spermidine transporter system is comprised of SpuDEFGH (Lu et al.,
2002). Also, our group reported a putative spermine/spermidine transporter PotABCD in
gram-positive bacteria S. aureus (Yao & Lu, 2014b).
1.2.2 Polyamine biosynthesis
Polyamines are essential for cell growth, and the biosynthesis of polyamines is controlled
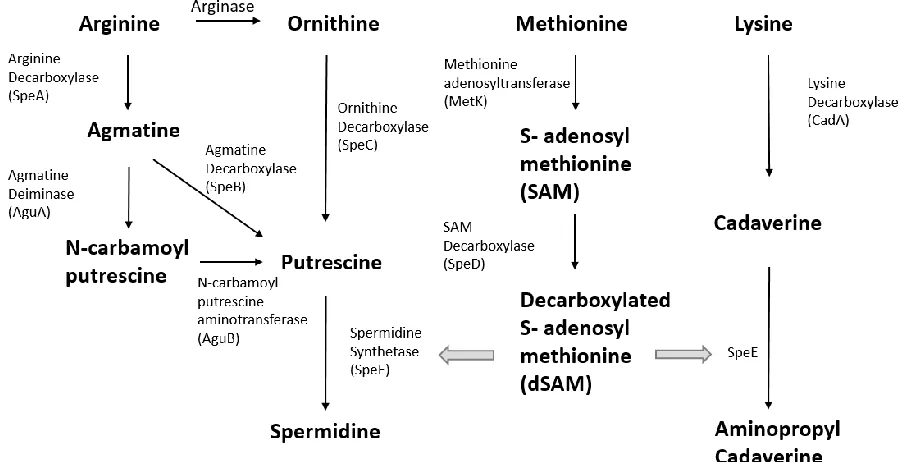
by multiple enzymes and feedback regulation (Fig. 1.2.1). Diamine putrescine, cadaverine,
triamine spermidine, and tetraamine spermine are the most common polyamines in the
prokaryotes and eukaryotes (Cohen, 1997). In the polyamine biosynthesis, putrescine is
decarboxylated from the precursor of amino acid via either ODC or ADC pathways: (1) In ODC
ADC pathway, L-arginine is first decarboxylated to agmatine by SpeA (arginine decarboxylase),
and agmatine is hydrolyzed to putrescine and urea by SpeB (arginine ureohydrolase) (Tabor &
Tabor, 1985). In P. aeruginosa, an additional pathway has been reported that agmatine is
converted to putrescine via N-carbamoyl putrescine by AguAB, which are encoded the agmatine
deiminase and N-carbamoyl putrescine aminotransferase, respectively (Nakada & Itoh, 2003).
On the other hand, another diamine cadaverine is only synthesized from L-lysine by lysine
decarboxylase CadA during putrescine deficiency (Cohen, 1997).
In E. coli, spermidine synthesis requires decarboxylated S-adenosylmethionine (dSAM)
as a cofactor. Methionine adenosyltransferase MetK converts L-methionine to SAM, which is
decarboxylated to decarboxylated SAM by SpeD. The decarboxylated SAM allows the
conversion of putrescine to spermidine by spermidine synthetase SpeE (Tabor, Tabor, & Xie,
1986). E. coli and most of the bacteria do not synthesize spermine. In general, spermine only
1.2.3 Polyamine catabolism
Due to the lethal effect of polyamines, cells can quickly reduce the polyamine toxicity by
enzyme modification. As Fig. 1.2.2 shown, spermine/spermidine acetyltransferase (SSAT)
converts spermine/spermidine to acetyl-spermine/spermidine (Fukuchi, Kashiwagi, Takio, &
Igarashi, 1994). AcSpm and AcSpd can be either excreted or converted into spermidine or
putrescine, respectively, by the FAD-dependent polyamine oxidase (PAO) (Casero & Pegg,
2009; Igarashi, 2006). SSAT is highly conserved in human and many bacteria, including
gram-negative E. coli (speG), V. paraheamolyticus (bltD), gram-positive S. pneumoniae (bltD), B.
cereus (bltD) and a lineage of S. aureus (speG). However, no SSAT orthologue has been
reported in P. aeruginosa or pseudomonads. Instead of acetylation pathway, polyamines can be
γ-glutamylated by γ-glutamylpolyamine synthetase (GPS) for degradation and utilization. Also,
our data indicated that a redundant and complex glutamylation pathway exists for the polyamine
1.3 The γ-glutamylation pathway
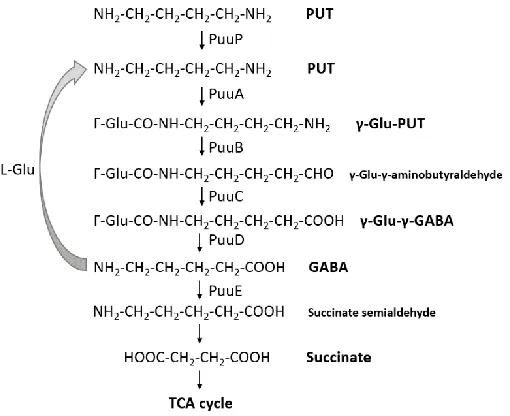
The first γ-glutamylation pathway for putrescine has been reported in E. coli (Kurihara et
al., 2005). In Fig. 1.3.1, the putrescine utilization pathway is depicted. Cell acquires putrescine
by the putrescine importer PuuP, and putrescine was catabolized by the PuuABCDE, which are
regulated by a regulator PuuR. In the first step of γ-glutamylation, PuuA can catalyze the
glutamyl linkage between L-glutamate and putrescine, resulting in a product of
γ-glutamylputrescine. This compounds further oxidized by PuuBC, hydrolyzed by PuuD, and
deaminated by PuuE to a final product of γ-aminobutyrate (GABA) (Kurihara et al., 2005). The
product of putrescine γ-glutamylation pathway becomes a precursor of TCA cycle. Therefore,
cells can utilize putrescine as the sole carbon and nitrogen sources.
By the sequence annotation of puu genes in E. coli, our group reported that there are six
pauA genes (pauA1-pauA6), four pauB genes (pauB1-pauB4), one pauC, and two pauD genes
(pauD1-pauD2) in the polyamine utilization pathway of P. aeruginosa (Yao et al., 2011) (Fig.
1.3.2). This result indicated that a redundant and complex polyamine γ-glutamylation pathway
exists in P. aeruginosa. By the mutation analysis of pauA genes, a single mutant of pauA2 gene
was found sufficient to block the spermine catabolism, resulting in extreme sensitivity to
exogenous spermine (Yao, Li, Zhang, & Lu, 2012). Therefore, we proposed that the
γ-glutamylation pathway is a major pathway for spermine catabolism via the γ-glutamylspermine
Figure 1.3.1 The glutamylation pathway for putrescine in E.coli
Figure 1.3.2 The putative glutamylation pathway in P. aeruginosa
1.4 Polyamine/spermine effects on β-lactam antibiotics
Our group has reported that polyamines, particularly spermine, can influence the
antibiotics efficacy in the different ways (Kwon & Lu, 2007). In the presence of spermine, the
MICs of cationic peptides, aminoglycosides, and quinolone antibiotics are increased while the
MICs of β-lactams and chloramphenicol were decreased (Kwon & Lu, 2007). Although the
molecular mechanism of spermine effects on antibiotics remains unknown, this strong
synergistic effect with β-lactams may relieve the demand for new antibiotics by increasing the
efficacy of existing antibiotics. This synergistic effect on β-lactams was tested and observed in
many bacteria, including Gram-negative P. aeruginosa, E. coli, S. typhimurium, A. baumannii
and Gram-positive methicillin-resistant Staphylococcus aureus (MRSA) (Kwon & Lu, 2007;
Malone & Kwon, 2013).
Bacteria possess several potential mechanisms to confer β-lactams resistance, including
decreasing permeability of the outer membrane, the efflux pumps, the β-lactamase, or the
penicillin-binding proteins with lower affinity to β-lactams. Studies from our group have ruled
out the sensitization effect by spermine through β-lactamase, outer membrane permeability, and
efflux pumps in P. aeruginosa (Kwon & Lu, 2006). Also, a pbpB mutant was reported to exhibit
the reduced β-lactam susceptibility with exogenous spermine in MRSA (Yao & Lu, 2012), and
the transcriptome analysis indicated that the iron acquisition and SigB regulons may has a
1.5 Research overview
My dissertation research is focused on (1) characterizing the γ-glutamylpolyamine PauA
proteins in the primary polyamine utilization pathways in P. aeruginosa, and (2) elucidating the
molecular mechanism of an alternative defense against spermine stress in P. aeruginosa. In
Chapter one, I characterized γ-glutamylspermine synthetases PauA2 in the polyamine utilization
pathways and screened the spermine analogs as the potential PauA2 inhibitors. These results
provided the foundational knowledge for antimicrobial agent development. In Chapter two, I
conducted experiments directed to identify the genetic nature of ΔpauA2 suppressors that grew
on agar plates with spermine and concluded that spermine toxicity could be attenuated by
increasing the intracellular concentration of polyphosphate. The results of these projects help us
gain a better understanding of how spermine influences the bacterial physiology and how genetic
2 CHAPTER ONE: FUNCTIONAL CHARACTERIZATIONS OF
Γ-GLUTAMYLPOLYAMINE SYNTHETASES PAUA1 AND PAUA2 IN POLYAMINE
UTILIZATION PATHWAY OF PSEUDMONOAS AERUGINOSA
2.1 Introduction
Polyamines are a group of organic compounds with a long-chain carbon backbone and
multiple amine groups and are widely distributed in the prokaryotic and eukaryotic system
(Casero & Pegg, 2009; Seiler, 2004). Due to their property of positive charge at
physiological pH, polyamines can interact with the polyanionic macromolecules, e.g. DNA
and RNA (Bryson & Greenall, 2000). When in excess, polyamines are lethal for cell
(Chattopadhyay, Tabor, & Tabor, 2003; Nakada & Itoh, 2003). Therefore, it is essential for
the cell to maintain the homeostasis of polyamines by polyamine biosynthesis and
degradation. A γ-glutamylation pathway for putrescine catabolism was first reported in E.
coli, and the first enzyme of γ-glutamyl putrescine synthetase PuuA in this pathway can
catalyze the γ-glutamylation linkage between L-glutamate and putrescine (Kurihara et al.,
2008). According to sequence annotation in Pseudomonas Genome Database
(www.pseudomonas.com), we reported that there are six homologs of γ-glutamyl polyamine
synthetase (pauA1-pauA6) in P. aeruginosa, and the ΔpauA2 mutant cannot grow on
spermine/spermidine as the sole carbon and nitrogen source (Yao et al., 2011). Furthermore,
the amino acid sequences of PauA1 and PauA4 share over 44% identity to the γ-glutamyl
putrescine synthetase PuuA of E. coli, and the growth rate of ΔpauA2 ΔpauA4 double
mutant was severely reduced in the presence of putrescine (Yao et al., 2011). Thus, we
proposed that PauA1/PauA4 (97% sequence identity) may utilize putrescine as a substrate,
In this study, we cloned and expressed the pauA1 and pauA2 genes into the His-tag removed
expression vectors, pET20b and pBAD-HisD, respectively, and purified the native form of
PauA1 and PauA2 protein by ammonium sulfate precipitation, ion-exchange column, and
gel filtration column. Malachite green ATPase assay was used to determine the kinetic
parameters of PauA1 and PauA2. PauA1 and PauA2 exhibited sigmoid curves on
Michaelis-Menten plot by automatic curve fitting using GraphPad Prism 7, and the obtained values of
Hill coefficient (n) were significantly greater than one, indicating positively cooperative
substrate binding for polyamines. Also, our results indicated that PauA1 can catalyze the
γ-glutamylation reaction between L-Glu and diamines, including putrescine, cadaverine, and
diaminopropane. PauA2, by contrary, only exhibited specific activities with triamine
(spermidine) and tetra-amine (spermine) as substrate. This study supported the previous
mutation analysis of pauA genes, and also provided a completed enzymological
characterization of PauA1 and PauA2 that can be used for future inhibitor screening as
2.2 Experiments
2.2.1 Bacterial, plasmid strain, and growth condition
Bacterial strains and plasmid used in this study are listed in Table S2 LB (Luria-Bertani)
medium (1% tryptone; 0.5% yeast extract; 0.5% NaCl) was used for E. coli transformation and
overexpression. When required, LB medium was supplemented with 100µl ml-1 of ampicillin.
2.2.2 Construction of PauA1 and PauA2 expression plasmid
The pauA1 (PA0296) gene encoded by 1377 nucleotides was amplified from PAO1
chromosome by a specific pair of oligonucleotide primers. Forward primer: 5’-ATC ATA TGT
CGG TAC CCC AGC GTG C-3’; Reverse primer: 5’-CGC AAG CTT TCA GAC AGG TAT
GCA GGT ACC-3’. The amplified DNA fragments were digested with NdeI and HindIII, and
cloned into pET-20b expression vector digested with the same restriction enzymes to get pPauA1
protein. This plasmid was introduced into E. coli Rosetta (DE3)/pLysS strain for overexpression
of PauA1 protein. This recombinant strain of E. coli was grown in LB medium supplemented
with ampicillin (100µg/ml) at 37°C until the optical density at 600nm reached 0.6 and the PauA1
protein overexpression was induced by the addition of 0.5mM IPTG (Isopropyl
β-D-1-thiogalactopyranoside). After 4 hours of induction, the cells were harvested by centrifugation.
The DNA fragments carrying the full-length (1359bp) pauA2 (PA0298) gene was
amplified from PAO1 chromosome with a specific pair of oligonucleotide primers that carry
NcoI and HindIII site in the forward (5’-CCC CCA TGG CCA TGA CTA CCA AGT TAG ACC
A-3’) and reverse (5’-CCC CAA GCT TAT CAA ACG GAA AGC AGG AGG A-3’) primers,
obtain the pPauA2 plasmid. The pPauA2 plasmid was transformed into E. coli TOP10 strain. To
express PauA2 protein, this recombinant strain of E. coli was grown in LB medium
supplemented with ampicillin (100µg/ml) at 37°C until the optical density at 600nm reached 0.6.
Protein overexpression was induced by the addition of 0.2% arabinose (wt/vol; final
concentration). After 4 hours of induction, the cells were harvested by centrifugation.
2.2.3 Protein purification of γ-glutamylpolyamine synthetase PauA1 and PauA2
The cell pellet of the recombinant PauA1 was suspended in the buffer A (20 mM Tris-HCl
buffer, pH 8.0). EDTA-free protease inhibitor cocktail (cOmplete™; Sigma-Aldrich) was added,
and the cells were ruptured by an Aminco French pressure cell at 16,000 lb/in2. Cell debris was
removed by centrifugation at 20,000×g for 30 min. The cell-free crude was precipitated by
30-45% ammonium sulfate. The precipitated protein was collected by centrifugation and dissolved in
the buffer A. The dissolved protein mixture was desalted and concentrated by Amicon Ultra-4ml
centrifugal filters unit (100 kDa; Millipore). The concentrated product was subjected to
anion-exchange chromatography using a Hitrap Q HP column (GE Healthcare) equilibrated with buffer
A. After washing away of the unbound proteins with equilibration buffer, PauA1 was eluted with
a linear gradient of 0 to 1 M NaCl in the buffer B (20 mM Tris-HCl buffer; 1M NaCl, pH 8.0) over
20 column volumes. The active fractions (0.30-0.4M of NaCl) were combined and concentrated
by Amicon Ultra-4ml centrifugal filters unit (100 kDa; Millipore). The concentrated fractions were
subjected to gel-filtration column using a Superose 12 10/300 GL (GE Healthcare) equilibrated
The same strategy was applied for PauA2 purification, including ammonium sulfate
precipitation, ion exchange column (Hitrap Q HP), and gel filtration column (Superose 12 10/300
GL). The cell-free crude extract was precipitated by 30% ammonium sulfate. The protein pellet
was suspended in the buffer A (20mM Tris-HCl, pH 8.0), and then subjected to Hitrap Q HP
column (GE Healthcare). After washing away of the unbound protein with the equilibration buffer
A, PauA2 was eluted with a linear gradient of 0 to 1 M NaCl in the buffer B (20mM Tris-HCl, 1M
NaCl, pH 8.0) over 20 column volumes. The active fractions were collected and determined the
specific activity at the concentration of 0.3-0.4M NaCl. The fractions were concentrated by
Amicon Ultra-4ml centrifugal filters unit (100 kDa; Millipore) and were subjected to gel-filtration
column using a Superose 12 10/300 GL (GE Healthcare) equilibrated with buffer A. PauA2 was
eluted at the volume of 12.86 ml from the injection.
Aliquots of PauA1/PauA2, mixed with 50% glycerol, were stored at -80°C before use for
enzyme assays.
2.2.4 Malachite green ATPase assay for PauA1 and PauA2
The specific activity of γ-glutamylpolyamine synthetase PauA1 and PauA2 was
determined by malachite Green ATPase assay (Chan, Delfert, & Junger, 1986). The reaction
mixture (50µl) was composed of L-glutamate, polyamines, ATP, divalent ion (MgCl2/MnCl2), in
50mM imidazole-HCl buffer (pH 7.0). The reaction was initiated by adding 10µl of the enzyme
sample. After the 10-minute reaction, 800µl of Reagent A was added for color development,
which was incubated in water bath at 30oC. After 3 minutes of incubation, the color development
was terminated by 100µl of Reagent B and determined the absorbance at 660nm. The blank
background control samples included the reaction mixture and the enzyme but excluded a
specific substrate when determined the kinetic study for this substrate. One unit (U) is defined as
the amount of enzyme which produces one µmole of phosphate from ATP per min at pH7.5 and
30˚C. The preparation for Reagent A: Malachite Green (MG): 0.045% Malachite Green in MQ
water; Ammonium Molybdate (AM): 4.2% ammonium molybdate in 4N HCl. Mix MG and AM
in 3:1 ratio with 0.025% Triton X-100. Reagent A was stirred overnight and then filtered.
Reagent B: 34% Citrate acid. The standard curve for this ATPase assay was equilibrated with the
phosphate buffer with a series of dilutions. The protein concentration was determined by
Bradford assay (Bradford, 1976) using Bio-Rad Protein Assay Kit, with bovine serum albumin
as the standard.
2.2.5 Optimal pH and temperature
For pH studies, 50mM imidazole buffers at pH6.0 to 9.0 was used to determine the
enzyme activity by the ATPase assay described above. Same as temperature studies, the
temperature dependence of PauAs activities was determined by incubating the reaction mixture
in the water bath for 10 minutes at 25 to 50°C. All experiments were performed in triplicate and
error bars represent standard deviation.
2.2.6 Substrate and cofactor specificity
Substrate specificity was determined by malachite green ATPase assay with the
following six polyamines, ethylene diamine(EDA), diaminopropane (DAP), putrescine Put),
cadaverine (CAD), spermidine (SPD), and spermine (SPM) as amine group donor and
cations (manganese, magnesium, calcium, cobalt, nickel, and zinc) were used in ATPase assay.
For comparison, the values of the highest specific activity were defined as 100%. All
experiments were performed in triplicate and error bars represent standard deviation.
2.2.7 Gel filtration analysis
The low- and high-molecular- weight calibration kits (GE Healthcare) were subjected to a
Superose 12 10/300 GL column (GE Healthcare) equilibrated with 20mM Tris-HCl, 0.2M NaCl
buffer at pH 7.0. The flow rate was set at 1ml/min, and the sample volume was 200µl for each
injection. Blue dextran (2000kDa) was used to determine the void volume of the Superose 12
column. The molecular mass standard included ferritin (440kDa), aldolase (158kDa), albumin
(67kDa), ovalbumin (43kDa), chymotrypsinogen A (25kDa), and Ribonuclease A (13.7kDa).
2.2.8 PauA2 inhibitor screening
A total of 49 chemical compounds was synthesized and kindly provided by Dr. David W.
Boykin, Department of Chemistry at Georgia State University. The chemical structure and
molecular weight of the tested compound are listed in Table 2.3.6. Malachite green ATPase
assay was used for the PauA2 inhibitor screening. The substrates were pre-mixed with an
inhibitor, and the reaction initiated by PauA2 addition. The half maximal inhibitory
concentration (IC50) of the dose-response curve was calculated and fitted by SigmaPlot. IC50 is
2.2.9 Multiple sequences alignment of GS and GPS in E. coli and P. aeruginosa
The sequences of glutamine synthetase (GlnA) and glutamylpolyamine synthetase
(PuuA/PauA1-A6) from E. coli K12 and P. aeruginosa PAO1 were used for multiple sequences
alignment by Clustal Omega (EMBL-EBI) (Sievers et al., 2011). The gap penalty was 6.0, and
the extended penalty was 1.0.
2.2.10 Computational prediction of structure and substrate binding sites
The computational protein structure of PauA2 was constructed by AMMP protein
structure prediction server, which was established by Dr. Robert Harrison, Department of
Computer Science at Georgia State University. The predicted protein structure prediction of
PauA2 was based on the glutamine synthetase (GS) of Salmonella typhimurium (2GLS) as a
template (Yamashita, Almassy, Janson, Cascio, & Eisenberg, 1989). The conserved substrate
binding sites of PauA2, predicted by multiple sequences alignment, were highlighted with colors
2.3 Results
2.3.1 Malachite green ATPase assay for PauA1 and PauA2 activity
The GPS in E. coli, PuuA, has been reported to catalyze the γ-glutamyl linkage between
glutamate and putrescine (Kurihara et al., 2008). The genetic and biochemical evidence led us to
propose that PauA1 and PauA2 also possess
the activity of glutamylpolyamine synthetase.
The net reaction of GPS was described in
Scheme 1 (Kurihara et al., 2008).
In the reaction of γ-glutamylation, L-glutamate and polyamine served as the amine group
acceptor and donor, respectively, to synthesize glutamylpolyamine driven by ATP. The reaction
was monitored by the releasing phosphate ions from ATP, which was quantitated by the
malachite green ATPase assay as described in MATERIALS and METHODS. Phosphate buffer
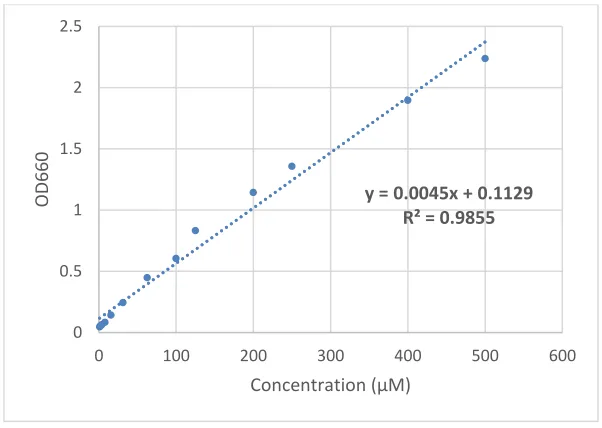
(KH2PO4) at pH 6.0 was used to calibrate the standard curve, and the linear relationship between
absorbance and phosphate concentration was up to 2.2 at 660nm (Fig. 2.3.1). To improve the
stability of color development, the stop reagent of sodium citrate was replaced by citrate acid. As
Fig. 2.3.2 shown, the absorbance at 660nm was increased from 0.2 to 0.9 due to the
autohydrolysis of ATP in the absence of the stop reagent. Comparing to sodium citrate as the
stop reagent, citrate acid can constantly inhibit the color development and maintain the OD
reading under 0.05 after 30 minutes of incubation. Also, the phosphate buffer (KH2PO4) at pH
6.0 cannot react with malachite green in the presence of citrate acid, indicating that citrate acid is
a better stop reagent than sodium citrate. As Fig. 2.3.3 shown, ATP autohydrolysis is
ATP autohydrolysis were also tested as shown Fig. 2.3.4 and 2.3.5. Temperature slightly
influenced the ATP autohydrolysis, but pH did not significantly affect it at a range of 6.0 to 9.0.
These backgrounds of ATP autohydrolysis were taken into consideration with the inclusion of
proper controls for the PauA1 and PauA2 kinetic studies in the later section. Taken together,
these results indicated that malachite green ATPase assay is a stable and reliable method for
[image:39.612.106.407.263.477.2]PauA1 and PauA2 kinetic studies.
Figure 2.3.1 Standard curve of malachite green ATPase assay
The standard curve of malachite green ATPase assay was calibrated with a two-fold serial dilution of phosphate buffer (KH2PO4) at pH 6.0 from 500µM to 1µM.
y = 0.0045x + 0.1129 R² = 0.9855
0 0.5 1 1.5 2 2.5
0 100 200 300 400 500 600
OD660
Figure 2.3.2 Efficacy of stop agents in ATPase assay
The OD measurement was monitored every minute after the stop reagent was added. SC: sodium citrate, CA: citrate acid.
Figure 2.3.3 Effects of ATP concentration on ATP autohydrolysis
The ATP autohydrolysis was determined by ATPase assay at concentration 10mM to 0.0625mM. 0 0.1 0.2 0.3 0.4 0.5 0.6 0.7 0.8 0.9 1
0 10 20 30
OD660
Time (minutes)
2mM ATP
2mM ATP+S.C.
2mM ATP+ C.A.
100uM KH2PO4+C.A.
y = 0.0892x + 0.0129 R² = 0.999
0 0.1 0.2 0.3 0.4 0.5 0.6 0.7 0.8 0.9 1
0 2 4 6 8 10
OD660
[image:40.612.107.432.417.634.2]Figure 2.3.4 Effect of pH on ATP autohydrolysis
With 2mM ATP, the ATP autohydrolysis was determined with 50mM of imidazole buffer at pH6.0 to 9.0 and 30oC.
Figure 2.3.5 Effect of temperature on ATP autohydrolysis
With 2mM ATP, the ATP autohydrolysis was determined with 50mM of imidazole buffer at pH7.5 from 10oC to 50oC.
0 0.1 0.2 0.3 0.4 0.5
pH6.0 pH6.5 pH7.0 pH7.5 pH8.0 pH8.5 pH9.0
OD660
0 0.1 0.2 0.3 0.4 0.5
10°C 15°C 20°C 25°C 30°C 37°C 42°C 50°C
2.3.2 Divalent cation is required for the specific activity of PauA1 and PauA2
In the absence of divalent ions, only a negligible level of free phosphate ions can be
released from the reactions catalyzed by PauA1 and PauA2. Since many enzymes of ATPase
activities require the presence of divalent cations, experiments were conducted independently
with the following six cations: Ca2+, Co2+, Ni2+, Mg2+, Mn2+, and Zn2+. As Fig. 2.3.6, with 20mM
of a divalent cation, PauA1 preferred manganese ion than other divalent cations by an order of
preference of manganese (100%) > magnesium (16%) > other divalent ions (less than 3%).
When the concentration is reduced to 1mM, the specific activity of PauA1 can only be observed
with manganese as the cofactor. The PauA1 activity was further measured with a titration of
manganese ions, and the results indicated a bell-shaped curve with the peak at 1mM (Fig. 2.3.7).
Similar experiments were also conducted with PauA2 to determine its preference of
divalent cations. With a concentration of 20mM, PauA2 exhibited the highest activity with
magnesium among six divalent cations by an order of preference of magnesium (100%) > cobalt
(27%) > manganese (3%) > other divalent cations (0%) at 20mM concentration (Fig. 2.3.8).
However, when the concentration of divalent cation was reduced to 5mM, the specific activity of
PauA2 was relatively increased with cobalt (92%), or manganese (27%) compared to with
magnesium (100%) (Fig. 2.3.8). Therefore, we monitored the enzyme activity of PauA2 with a
two-fold serial dilution of cobalt, manganese, and magnesium ions from 20mM to 0.16mM (Fig.
2.3.9). Interestingly, the titration curves of PauA2 with these three cations display very different
patterns. With magnesium, PauA2 reached its saturated activity at 5mM concentration and
above. With cobalt, the PauA2 activity reached its peak around 10mM and decreased
Figure 2.3.6 Divalent cation preference of PauA1 activity
The specific activities of PauA1 with six divalent cations at 1mM or 20mM were determined by ATPase assay. The PauA1 specific activities toward 1mM and 20mM manganese are defined as 100%.
Figure 2.3.7 Specific activities of PauA1 with a titration of manganese ions
The PauA1 activities with a titration of manganese ions from 5mM to 0.16mM were determined, and PauA1 activity toward 1.25mM of manganese was defined as 100%.
0% 20% 40% 60% 80% 100% 120%
Mn Mg Co Ni Ca Zn
Re lat iv e Activ ity (% ) 1mM 20mM 0% 20% 40% 60% 80% 100% 120%
0 1 2 3 4 5
Re lat iv e Activ ity (% )
Figure 2.3.8 Divalent cation preference of PauA2 activity
The specific activities of PauA2 with six divalent cations at 5mM or 20mM were determined by ATPase assay. The PauA2 specific activities toward 5mM and 20mM of manganese are defined as 100%.
Figure 2.3.9 Specific activities of PauA2 with titrations of manganese, magnesium, and cobalt ions
The PauA2 activities with the titrations of manganese, magnesium, and cobalt ions from 20mM to 0.16mM were determined by ATPase assay.
0% 20% 40% 60% 80% 100% 120%
Mg Mn Co Zn Ni Ca
Re lat iv e act iv ity (% ) 5mM 20mM 0 10 20 30 40 50 60 70 80 90 100
0 5 10 15 20
2.3.3 Optimal pH and temperature
PauA1 had a narrow pH tolerance in the reaction, and the optimal pH for PauA1 enzyme
activity was 7.5 with 50mM imidazole buffer (Fig. 2.3.10). The optimal temperature for PauA1
enzyme activity was 30˚C (Fig. 2.3.11). PauA2 exhibited a very broad range of pH tolerance, and
the optimal pH for PauA2 enzyme activity were 7.0 to 9.0 with 50mM imidazole buffer (Fig.
2.3.12). The optimal temperature for PauA2 enzyme activity was 50 ˚C (Fig. 2.3.13). However,
PauA2 was less stable at 50 ˚C, and can totally lose its enzyme activity after 1-hour incubation at
50 ˚C (Fig. 2.3.14).
Figure 2.3.10 Effect of pH on PauA1 activity
The specific activities of PauA1 were determined at pH6.0 to 8.0 and 30oC. The reaction mixture contained 10mM L-glutamate, 10mM putrescine, and 2mM ATP in the 50mM imidazole buffer.
0% 20% 40% 60% 80% 100% 120%
pH6.0 pH6.5 pH7.0 pH7.5 pH8.0
R
el
at
iv
e
A
ct
iv
it
y
Figure 2.3.11 Effect of temperature on PauA1 activity
The specific activities of PauA1 were determined at 25 oC to 50oC. The reaction mixture contained 10mM L-glutamate, 10mM spermine, 2mM ATP, and 50mM imidazole buffer at pH 7.5.
Figure 2.3.12 Effect of pH on PauA2 activity
The specific activities of PauA2 were determined at pH6.0 to 9.0 and 30oC as described in Materials and Methods. The reaction mixture contained 10mM L-glutamate, 5mM spermine, and 2mM ATP in the 50mM imidazole buffer.
0% 20% 40% 60% 80% 100% 120%
25°C 30°C 37°C 42°C 50°C
R el at iv e ac ti vi ty ( %) 0% 20% 40% 60% 80% 100% 120%
pH6.0 pH6.5 pH7.0 pH7.5 pH8.0 pH8.5 pH9.0
Figure 2.3.13 Effect of temperature on PauA2 activity
The specific activities of PauA2 were determined at 25 oC to 50oC. The reaction mixture contained 10mM L-glutamate, 5mM spermine, 2mM ATP, and 50mM imidazole buffer at pH 7.5.
Figure 2.3.14 Heat stability of PauA2
PauA2 was incubated in a thermocycler at 37oC and 50 oC, and the PauA2 activity was determined every 10 minutes. The PauA2 activity at time point 0 was defined as 100%.
0% 20% 40% 60% 80% 100% 120%
25°C 30°C 37°C 42°C 50°C
R el at iv e ac ti vi ty ( %) 0% 20% 40% 60% 80% 100% 120%
0 10 20 30 40 50
2.3.4 Substrate specificity for polyamines
To test the substrate specificities for PauA1 and PauA2, the following six polyamines
were used in the reactions: ethylene diamine (EDA), diaminopropane (DAP), putrescine (PUT),
cadaverine (CAD), spermidine (SPD), and spermine (SPM). Because the specific activity of
PauA1 was greatly influenced by the different divalent cations, the experiments were conducted
in two conditions – (a) 1mM manganese, and (b) 1mM manganese and 10mM magnesium. As
shown in Fig. 2.3.15 and Fig. 2.3.16, PauA1 is capable of taking diamines but not triamine and
tetramine as substrates. In general, PauA1 exhibited the highest activity for PUT by an order of
preference of PUT> CAD> DAP> EDA.
On the contrary, PauA2 exhibited enzyme activity toward tetramine (SPM; 100%) and
triamine (SPD; 83.3%), but not with diamines (EDA, DAP, and PUT; <1%) at 10mM
concentration (Table 2.3.1). When the concentration was reduced to 1mM, a significant PauA2
Figure 2.3.15 Polyamine specificity of PauA1 with 1mM manganese
With 1mM manganese, the PauA1 specific activities with the 5mM, 10mM, and 50mM of polyamines were determined and compared, and the highest values of PauA1 specific activity were defined as 100%.
Figure 2.3.16 Polyamine specificity of PauA1 with 1mM manganese and 10mM magnesium With 1mM manganese and 10mM magnesium, the PauA1 specific activities with 10mM, 25mM, and 50mM of polyamines were determined and compared, and the highest values of PauA1 specific activity were defined as 100%.
0% 20% 40% 60% 80% 100% 120%
EDA DAP PUT CAD SPD SPM
R el ai ve ac ti vi ty ( %)
50mM 10mM 5mM
0% 20% 40% 60% 80% 100% 120%
EDA DAP PUT CAD SPD SPM
R el at iv e ac ti vi ty ( %)
Table 2.3.1 Polyamine specificity of PauA2 Relative Activity (%)
Polyamines 1mM 10mM
EDA ND ND
DAP ND ND
PUT ND ND
SPD ND 83.3 ± 0.25%
SPM 100.0 ± 2.64% 100.0 ± 1.93%
2.3.5 Steady-state kinetics of PauA1 and PauA2
A series of substrate saturation curves were obtained to study kinetics properties of
PauA1 and PauA2. For PauA1, the experiments were conducted in two sets, with either 1mM
manganese alone or in combination with 10mM magnesium. Measurements for PauA2 were
done with 20mM magnesium alone. As shown in Fig. 2.3.17, PauA1 exhibits curves for all
substrates tested. As expected the Lineweaver-Burk plots are non-linear, indicating cooperative
substrate binding during the reaction. The kinetics parameters and the Hill coefficient (n) of
PauA1 were obtained by GraphPad Prism 7 and listed in Table 2.3.2. Comparing these
parameters from the reactions in different divalent cations conditions, the values of Vmax and Kcat
were comparable while the values for catalytic efficiency (Kcat/Km) and the Hill coefficient vary
significantly. The Hill coefficient (n) for ATP, PUT, and CAD, except L-Glu, was significantly
greater than 1, suggesting that PauA1 exerted a positive allosteric modulation in the
γ-glutamylation reaction. Together, these results also confirmed that the divalent cations have a
great impact on the PauA1 specific activity.
Similar experiments were conducted with PauA2 to determine the kinetic parameters. As
Fig. 2.3.18 shown, PauA2 also exhibits the non-linear curves on Michaelis-Menten plot for ATP,
SPD, and SPM, except L-Glu. The obtained kinetic parameters were listed in Table 2.3.3.
Although PauA2 can exert specific activity with SPD and SPM in vitro, Khalf of SPM is 5-fold
lower than that of SPD, indicting PauA2 had a better affinity and specificity for SPM. Also, the
Hill coefficient (n) for ATP, SPD, and SPM were greater than 1, indicating that PauA2 also
regression (ATP, Glu, Put, and Cat) and the Michaelis–Menten equation (only Glu) by GraphPad Prism 7. All experiments were performed in triplicate.
Table 2.3.2 Summary of kinetic parameters for PauA1
Cofactor Substrate Khalf (mM) Vmax (nmole/min) n
1m
M
M
n
ATP 0.95 ± 0.034 3.55 ± 0.15 3.5 ± 0.33
L-Glutamate 5.19 ± 0.205 2.75 ± 0.08 2.8 ± 0.29
Putrescine 6.73 ± 0.091 3.60 ± 0.06 7.4 ± 0.67
Cadaverine 9.09 ± 0.151 3.36 ± 0.05 5.0 ± 0.40
1m
M
M
n
&
10 m
M
M
g
ATP 0.61 ± 0.065 2.99 ± 0.11 1.1 ± 0.09
L-Glutamate 2.76 ± 0.218 3.75 ± 0.13 1.7 ± 0.17
Putrescine 21.12 ± 0.224 2.57 ± 0.04 5.6 ± 0.30
Cadaverine 27.83 ± 0.269 2.78 ± 0.03 4.7 ± 0.19
Khalf: the concentration of substrate reached to a half-maximal enzyme velocity. Vmax: the maximal velocity of the enzyme reaction.
Figure 2.3.18 Concentration-velocity curves of PauA2
The curves were automatically fitted using non-linear regression (ATP, Glu, Spd, and Spm) and the Michaelis–Menten equation (ATP, and Glu) by GraphPad Prism 7. All experiments were performed in triplicate.
Table 2.3.3 Summary of kinetic parameters for PauA2
Substrate Khalf (mM) Vmax (nmole/min) n
ATP 0.2 ± 0.01 2.05 ± 0.033 2.0 ± 0.17
L-Glutamate 2.1 ± 0.53 1.63 ± 0.133 0.8 ± 0.11
Spermidine 6.0 ± 0.26 1.34 ± 0.047 3.4 ± 0.29
Spermine 1.1 ± 0.04 1.70 ± 0.056 5.4 ±0.48
Khalf: the concentration of substrate reached to a half-maximal enzyme velocity. Vmax: the maximal velocity of the enzyme reaction.
2.3.6 Gel filtration analysis
A value of 51kDa for the molecular mass of PauA1 and PauA2 monomer was estimated
from SDS-PAGE against the known protein ladder (ThermoFisher Spectra™), which is
consistent with the calculated molecular mass from amino acid sequences. To determine the
subunit configuration for the native PauA1 and PauA2, the purified PauA1 and PauA2 proteins
were subjected to a Superose 12 10/300GL (GE Healthcare) for the estimation of molecular
weight. As Fig. 2.3.19 shown, the calibration curve was established by high-molecular- weight
calibration kits (GE Healthcare), including ferritin (440kDa), aldolase (158kDa), albumin
(67kDa), and ovalbumin (43kDa). The results of gel filtration column chromatography revealed
the apparent molecular mass of 139kDa for PauA1 and 99kDa for PauA2, suggesting that the
Figure 2.3.19 Calibration curve of standard proteins on Superose 12 10/300GL column
[image:56.612.107.427.68.277.2]The high molecular weight standard proteins were subjected to a Superose 12 10/300GL column, including ferritin, aldolase, albumin, and ovalbumin. Sample volume: 200µl, buffer: 50mM Tris-Cl buffer at pH7.5, flow rate: 0.5ml/min, and temperature: 4oC.
Table 2.3.4 Summary of MW, Ve, and Kav of the standard proteins in gel filtration analysis
Protein M.W. Vo Ve Vc Kav
Blue Dextran 2000000 8.25 24
Ferritin 440000 8.38 0.0812
Aldolase 158000 12.4 0.3176
Albumin 67000 13.03 0.3547
Ovalbumin 43000 13.73 0.3959
PauA1 139309 12.31 0.3124
PauA2 98868 12.86 0.3447
Vo: Void volume, Ve: Elution volume, Vc: Column volume, and Kav: partition coefficient. Kav= (Ve-Vo)/(Vc-Vo)
y = -8E-07x + 0.4238 R² = 0.9902
0 0.05 0.1 0.15 0.2 0.25 0.3 0.35 0.4 0.45
0 100000 200000 300000 400000 500000
2.3.7 PauA2 inhibitor screening
Our group has reported that PauA2 is a potential antimicrobial target against P.
aeruginosa (Yao et al., 2012). To search for potential inhibitors of PauA2, the chemical structure
of spermine analogs was considered as the competitors in the reaction. A total of 49 compounds
were synthesized and kindly provided by Dr. David Boykin, Department of Chemistry at
Georgia State University. As shown in Table 2.3.5, 10 out of 49 compounds can inhibit over
90% of the PauA2 catalytic activity at 250µM in the screening test. For these ten potential
PauA2 inhibitors, we continued to determine the half maximal inhibitory concentration (IC50).
As Fig. 2.3.20 shown, the inhibition curves of IC50 were automatically fitted by non-linear
regression (SigmaPlot), and the IC50 values of inhibitors were obtained and summarized in
Table 2.3.6. DB1812 and DB2114 are the most effective inhibitors of PauA2 activity among
Table 2.3.5 PauA2 inhibitor screening
DB#
Relative activity
(%)
DB#
Relative activity
(%)
DB#
Relative activity
(%)
75 91.0 877A 97.1 1750 14.8
103 78.9 921 48.1 1809 71.8
186 83.5 1044A 103.6 1812 7.3
188 12.8 1055D 86.5 1840 88.7
208 80.3 1197 80.0 1854 84.4
212 38.9 1210B 90.5 1883 8.3
242 75.5 1213A 73.3 1884 7.1
351 93.8 1237 86.4 1933 56.2
417 102.2 1246 94.4 1944 34.8
555 83.4 1247 10.7 1946 77.9
556 94.6 1255 9.7 1963 10.7
558 111.0 1282 10.0 2114 10.3
569B 100.8 1392 75.9 2243 95.2
607 101.8 1653 10.3 2272 106.4
686 99.2 1688 62.7 2291 15.5
700 81.4 1703 7.3
818A 27.2 1736 22.4
DB#1247
Conc (mM)
0 20 40 60
Inh ibit ion r at e -0.2 0.0 0.2 0.4 0.6 0.8 DB#1255 Conc (mM)
0 20 40 60
Inhibit ion rate 0.0 0.2 0.4 0.6 0.8 1.0 DB#1282 Conc (mM)
0 20 40 60
Inhibit ion rate 0.0 0.2 0.4 0.6 0.8 1.0 DB#1653 Conc (mM)
0 20 40 60
Inh ibit ion r at e -0.2 0.0 0.2 0.4 0.6 0.8 1.0 DB#1703 Conc (mM)
0 20 40 60
Inhibit ion rate 0.0 0.2 0.4 0.6 0.8 1.0 1.2 DB#1812 Conc (mM)
0 20 40 60
Inhibit ion rate 0.0 0.2 0.4 0.6 0.8 1.0 1.2 DB#1883 Conc (mM)
0 20 40 60
Inhibit ion rate 0.0 0.2 0.4 0.6 0.8 1.0 DB#1884 Conc (mM)
0 20 40 60
DB#1963
Conc (mM)
0 20 40 60
Inhibit
ion rate
0.0 0.2 0.4 0.6 0.8 1.0
DB#2114
Conc (mM)
0 20 40 60
Inhibit
ion rate
[image:60.612.73.248.311.642.2]0.0 0.2 0.4 0.6 0.8 1.0
Figure 2.3.20 IC50 determination of PauA2 activity
Six different concentrations (from 0.94 to 60μM) were tested for inhibition of PauA2 activity. Each reaction was performed in triplicate. The inhibition curves were automatically fitted by non-linear regression (SigmaPlot).
2.3.8 Multiple sequence alignment of GS and GSP in E. coli and P. aeruginosa.
In E.coli, sequence and biochemical similarities between glutamine synthetase (GS) and
glutamyl putrescine synthetase (PuuA) have been reported (Kurihara et al., 2008). By the
sequence annotation, we have reported that there are six putative glutamylpolyamine synthetases
(PauA1-A6), which can catalyze the γ-glutamylation of polyamines, in P. aeruginosa (Yao et al.,
2011). Therefore, we proposed that the substrate binding sites of all γ-glutamylpolyamine
synthetases may be highly conserved among GS and GPS of E. coli and P. aeruginosa. The
multiple sequences alignment for GS (GlnA) and GPS (PuuA/PauA) in E. coli K12 and P.
aeruginosa PAO1 were performed by Clustal Omega (EMBL-EBI) (Sievers et al., 2011). The
binding sites of GS for divalent cation, glutamate, ammonium ion, and ATP has been identified
in E. coli (Eisenberg, Gill, Pfluegl, & Rotstein, 2000). As Fig. 2.3.21 shown, the amino acid
residues involved in substrate binding were highlighted by colors. For divalent cation binding
sites of N1 and N2, all six amino acid residues in GS were conserved in PauA proteins (N1:
E118, E181, and E188 for PauA1, E142, E212, and E205 for PauA2; N2: E116, H238, and E325
for PauA1, E140, H261, E349 for PauA2). In addition, an ATP-binding signature
(K-P-[LIVMFYA]-x(3,5)-[NPAT]-[GA]-[GSTAN]-[GA]-x-H-x(3)-S) is highly conserved in the
ATP-cassette protein superfamily, including GS and GPS. The two ATP binding sites (H240 & R313
for PauA1, H263 & R337 for PauA2) and the consensus ATP motif (K227-S242 for PauA1,
K250-S265 for PauA2) were highly conserved in PauA proteins. Three out of four amino acid
residues in glutamate binding site of GS were relatively conserved in PauA proteins (E118,
A233, G234, and R290 for PauA1, E142, P256, G257, and R314 for PauA2). As expected, the
amino acid residues of ammonium ion binding sites in GS were not well conserved in PauA
Only one of three amino acid residues of ammonium ion binding sites in GS was conserved in
the PauAs (E72, Y149, and E181 for PauA1, E64, F173, and E205 for PauA2); however, the
amino acid residues with similar physicochemical properties can be found in the adjacent
residues of PauA proteins. Together, the substrate binding sites in GS are well conserved in
PauA proteins except for the ammonium ion binding site. This result provided some educated
EC_GlnA ---SAEHVLTMLNEHEVKFVDLRFTDTKGKEQHVTIPAHQ 37 PA_GlnA ---MSYKSHQLIKDHDVKWVDLRFTDTKGKQQHVTMPARD 37 PauA5 ---MTGEG 5
PauA2 ---MT-TKLDQLTSWL-KERKITEVECLISDLTGIARGKISPTNK 40
PauA6 ---MHFADPREAREFLAAHPEVRSIELFLIDANGVPRGKLLHRDE 42 PauA3 ---MNFACEQEAQDFLAANPDIELFELFILDANGVPRGKLLHRDE 42 PuuA METNIVEVENFVQQSEERRGSAFTQEVKRYLERYPNTQYVDVLLTDLNGCFRGKRIPVSS 60 PauA4 ---MSVPL-RAVQLTEPSLFLQEHPEVQFVDLLISDMNGVVRGKRIERNS 46
PauA1 ---MSVPQ-RAVQLTEPSEFLKEHPEVQFVDLLIADMNGVVRGKRIERNS 46
EC_GlnA -VNAEFFEEGKM---FDGSSIGGWKGINESDMVLMPDASTAVIDPFFAD 82 PA_GlnA ALDDEFFEAGKM---FDGSSIAGWKGIEASDMILMPDDSTAVLDPFTEE 83 PauA5 FL----SGRRLQLARGVLLQCIMGGYPPARFYGS--DDGDLALV--AEPTQVHRLPWSNT 57
PauA2 FI----AEKGMRLPESVLLQTVTGDYVEDDIYYDLLDPADIDMVCRPDENAVFLVPWAIE 96
PauA6 LL--AVYESGRPLPSTILGLTINGDDVEETGLV--WDVGDADCWTFPLPGSLTLQPWRQS 98 PauA3 LL--AVYRSGRPLPSTILGLTMNGEDVEDSGLV--WDVGDIDCRAYPLSGSLVRLPWRQI 98 PuuA LK---KLEKGCYFPASVFAMDILGNVVEEAGLG--QEMGEPDRTCVPVLGSLTPSAADPE 115 PauA4 LP--KVFEKGINLPASLFALDITGSTVESTGLG--LDIGDADRICYPIPGTLSMEPWQKR 102
PauA1 LN--KVFEKGINLPASLFALDITGSTVESTGLG--LDIGDADRICYPIPGTLSMEPWQKR 102
EC_GlnA STLIIRCDILEPGTLQGYDRDPRSIAKRAEDYLRSTGIADTVLFGPEPEFFLFDDIRFGS 142 PA_GlnA PTLILVCDIIEPSTMQGYERDPRNIAKRAEEYLKSTGIGDTVFVGPEPEFFIFDEVKFKS 143 PauA5 PRAFAICDAQELDGTPSG-LSTRGLLKQVVARYAAHGLQ--PVVATELEFFVFAPNTDPN 114
PauA2 PTAMVIHDTFDKLGNPIE-LSPRNILKRVLKMYADKGWR--PIVAPEMEFYLTKRSDDPD 153
PauA6 PTGQVQVSMHPELGLPAAAGDPRHVLQRVIHSLQAEGFH--PVMAVELEFYLLDRERDSD 156 PauA3 PTAAVQVSMHPSEGLPASVADPRHLLVRTIDALKSEGYH--PVMAAELEFYLLDRERDAN 156 PuuA FIGQMLLTMVDEDGAPFD-VEPRNVLNRLWQQLRQRGLF--PVVAVELEFYLLDRQRDAE 172 PauA4 PTAQLLMTMHELEGEPFF-ADPREVLRQVVARFTEMELT--IVAAFELEFYLIDQE-NVN 158
PauA1 PTAQLLMTMHELEGEPFF-ADPREVLRQVVARFTEMELT--IVAAFELEFYLIDQE-NVN 128
. * : : . . * **:: .
EC_GlnA SISGSHVAIDDIEGAWNSSTQYEGG-NKGHRPAVKGGYFPVPPVDSAQDIRSEMCLVMEQ 201 PA_GlnA DISGSMFKIFSEQASWNTDADIESG-NKGHRPGVKGGYFPVPPVDHDHEIRTAMCNALEE 202 PauA5 EP---FQAPLG-PDGRRELG-YSAFSVSSNNGLRPFFEDVYRCMDA 155
PauA2 YP---LQAPVG-RSGRQETG-RQSFSIDAANEFDPLFEDMYDWCEA 194
PauA6 GR---PLPALQ-MNGQRPRA-TQVYGVYELEQLQPFLDDLYAACEA 197 PauA3 GR---PQPARD-ADGGRPRA-TQVYGLRELEQIEPFLADLYAACKA 197 PuuA GY---LQPPCAPGTDDRNTQ-SQVYSVDNLNHFADVLNDIDELAQL 214 PauA4 GR---PQPPRSPISGKRPQS-VQVYSIDDLDEYVECLQDIIDGARA 200
PauA1 GR---PQPPRSPISGKRPQS-VQVYSIDDLDEYVECLQDIIDGARA 170
: : : : :
EC_GlnA MGLVVEAHHHEVATAGQNEVATRFN-TMTKKADEIQIYKYVVHNVAHRFGKTATFMPKPM 260
PA_GlnA MGLVVEVHHHEVATAGQNEIGVKFN-TLVAKADEVQTLKYCVHNVADAYGKTVTFMPKPL 261
PauA5 LGLVRDTFMHEMGT-SQFEINFLHG-DPVLLADQTFLFKHLLKEVALKHGLIVVCMAKPL 213
PauA2 QGLDLDTLIHEEGT-AQMEINFRHG-DALDLADQILVFKRTMREAALKHNVAATFMAKPM 252
PauA6 QGLPARTAISEYAP-GQVEITLQHRFDTLQAIDEGVRYKRLVKGVANRHGLQACFMAKPF 256
PauA3 QGLPARTAISEYAP-GQVEITLDHG-DALAAMDQAIRYKRLVKGIAHKHGMLACFMAKPF 255
PuuA QLIPADGAVAEASP-GQFEINLYHTDNVLEACDDALALKRLVRLMAEKHKMHATFMAKPY 273
PauA4 QGIPADAIVAESAP-AQFEVNLHHVADPMKACDYAVLLKRLIKNIAYDHEMDTTFMAKPY 259
PauA1 QGIPADAIVAESAP-AQFEVNLNHVNDALKACDHAVLLKRLVKNIAYDHEMDTTFMAKPY 229