Essays in Applied Econometrics
Cristian Huse
A thesis submitted to the Department of Economics
of the London School of Economics and Political Science
for the degree of Doctor of Philosophy
UMI Number: U615279
All rights reserved
INFORMATION TO ALL USERS
The quality of this reproduction is dependent upon the quality of the copy submitted.
In the unlikely event that the author did not send a complete manuscript and there are missing pages, these will be noted. Also, if material had to be removed,
a note will indicate the deletion.
Dissertation Publishing
UMI U615279
Published by ProQuest LLC 2014. Copyright in the Dissertation held by the Author. Microform Edition © ProQuest LLC.
All rights reserved. This work is protected against unauthorized copying under Title 17, United States Code.
ProQuest LLC
789 East Eisenhower Parkway P.O. Box 1346
Contents
1 H ow D o In cu m b en ts R e a c t to E ntry: E v id e n c e from D iffer en tia te d P r o d u c t M ar
k ets 16
1.1 In tro d u c tio n ... 16
1.2 T he Brazilian Domestic Airline M a r k e t... 17
1.2.1 Industry O v e r v ie w ... 17
1.2.2 The E ntry P a tte rn of G o l ... 18
1.3 How Incum bents React to E n t r y ... 20
1.3.1 Preem ptive and P o st-E ntry R e a c t i o n s ... 20
1.3.2 P roduct Differentiation and Asymmetric R esponses... 21
1.3.3 Further P articulars and D ata A v a ila b ility ... 22
1.4 T he D a t a ... 22
1.5 Empirical S t r a t e g y ... 23
1.6 Estim ation Results and A n a l y s i s ... 28
1.6.1 Incum bents Do React Preem ptively Using P r i c e s ... 28
1.6.2 P roduct Differentiation Might Soften Price R e s p o n s e s ... 31
1.6.3 Price Responses Are Not C o s t- D r iv e n ... 32
1.6.4 Excess C a p a c ity ? ... 33
1.6.5 Network A djustm ent and P ro du ct R e p o s itio n in g ... 34
1.7 Conclusion ... 34
l.A Appendix: Variable D e s c rip tio n ... 36
l.B .l Id e n tific a tio n ... 40
l.B .2 D ata Sources and Construction of I n s t r u m e n t s ... 44
1.B.3 Estim ation Strategy and R e s u l t s ... 46
R eferences... 51
R efe ren ce s 51 2 T erm S tru ctu re M o d ellin g w ith O b servab le S ta te V ariab les 56 2.1 In tro d u c tio n ... 56
2.2 Yield Curve E s t i m a t i o n ... 59
2.2.1 Static M e th o d s ... 59
2.2.2 Nelson-Siegel and B e y o n d ... 61
2.3 Term Structure M o d e llin g ... 62
2.3.1 A Model with S tate V a ria b le s ... 63
2.3.2 Im p lem en tatio n ... 65
2.4 Finite-Sample P e r f o r m a n c e ... 67
2.5 A p p lic a tio n ... 6 8 2.5.1 The D a t a ... 6 8 2.5.2 On The Economic D eterm inants of th e Yield Curve ... 71
2.5.3 In-Sample A n a ly sis ... 72
2.5.4 Incorporating Economic R e l a t i o n s ... 74
2.5.5 Out-of-Sample A n a ly s is ... 77
2.A Appendix A: Covariance M atrix D e r iv a t io n ... 81
2.B Appendix B: Robustness Check Using the CRSP D a t a ... 83
2.B.1 The D a t a ... 84
2.B.2 In-Sample A n a ly sis ... 8 6 2.B.3 Out-of-Sample A n a ly s is ... 91
R eferences... 98
R eferen ces 98 3 E stim a tin g T h e ‘C o o rd in a ted E ffects’ o f M erg ers 105 3.1 In tro d u c tio n ... 105
3.2 The Network Server I n d u s t r y ... 108
Contents 3
3.2.2 Consolidation in the Network Server I n d u s tr y ... 109
3.2.3 The HP-Com paq M erg er... I l l 3.3 Evaluating the Incentives to C o ll u d e ... 112
3.3.1 Q ualitative Analysis of Coordinated Effects in th e HP-Com paq M e rg e r... 112
3.3.2 The Benchmark M o d e l... 115
3.3.3 Extensions ... 119
3.4 D a t a ... 123
3.5 Model Im p le m e n ta tio n ... 124
3.5.1 Demand E s t i m a t i o n ... 125
3.5.2 Identification S tr a t e g y ... 127
3.5.3 Estim ating Discount Factors... 128
3.6 R e s u lts ... 130
3.6.1 Demand E s t i m a t i o n ... 130
3.6.2 Discount F a c t o r s ... 132
3.6.3 Evaluating the Incentives to C o llu d e ... 134
R eferences... 166
1.1 O perational Inform ation of th e M ain Airlines in the Brazilian Domestic M arket - 2002 36
1.2 Evolution of Gol’s A ctual Presence in the S a m p le ... 36
1.3 Baseline Specification Results: Price and Demand Responses ... 37
1.4 Preem ptive Specification Results: Price and Dem and R e sp o n se s... 38
1.5 PU Specification Results: Price and Demand R e s p o n s e s ... 39
1.6 PUD Specification Results: Price and Demand Responses - Distance V a r ia b le ... 40
1.7 PUD Specification Results: Price and Demand Responses - Distance-M etric Variables 41 1.8 PUD Specification Results: Price Responses - Cost C o n tro ls ... 42
1.9 Incum bents’ Response in A ircraft Utilization and Number of F l i g h t s ... 43
1.10 Incum bents’ Response in the Share of Seats Supplied - W eek d ay s... 44
1.11 Incum bents’ Response in the Share of Seats Supplied - W eekend s... 45
1.12 Tests of Exogeneity and Overidentifying R e s tric tio n s ... 48
1.13 PUD Specification Results: IV Estim ation of Price Responses - Distance Variable and Cost C o n tr o ls ... 49
1.14 IV Estim ation of Responses in Aircraft U t i l i z a t i o n ... 50
2.1 Simulation Results for Single-Variable Factor S p ecification... 6 8 2.2 Simulation Results for Single-Variable Factor Specification cont’d ... 69
2.3 Simulation Results for Single-Variable Factor Specification cont’d d ... 69
2.4 Macroeconomic Variables by G ro u p ... 81
List of Tables 5
2.6 Prelim inary Results for Single-Variable S pecifications... 82
2.7 F urther Results for Single-Variable Factor S p e c ific a tio n s... 83
2.8 Results for Best Single-Variable Factor S p e c ific a tio n ... 83
2.9 Results for Multi-Variable Factor S p ecificatio n s... 84
2.10 Results for Multi-Variable Factor Specification ... 84
2.11 Specifications Nested within the Interest R ate Feedback R u l e ... 84
2.12 P aram eter Estim ates for Forward-Looking Interest R ate R u l e ... 85
2.13 P aram eter Estim ates for Backward-Looking Interest R ate R u l e ... 85
2.14 N BER -D ated Recessions C o n s id e r e d ... 8 6 2.15 Overall Accuracy of A lternative Specifications - Recessions 1 - 3 ... 87
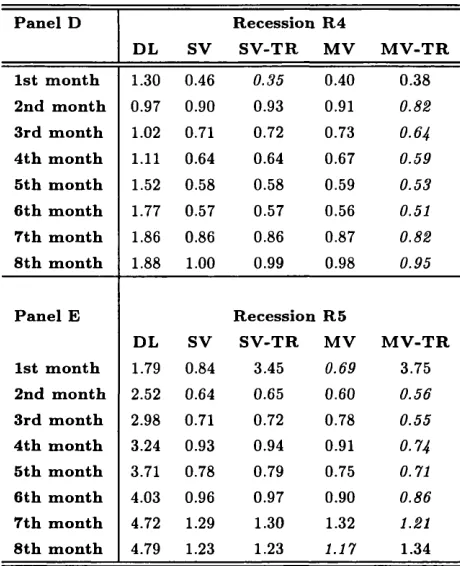
2.16 Overall Accuracy of A lternative Specifications - Recessions 4 - 5 ... 8 8 2.17 M aturity-Disaggregated Accuracy - Recessions 1 and 2 ... 89
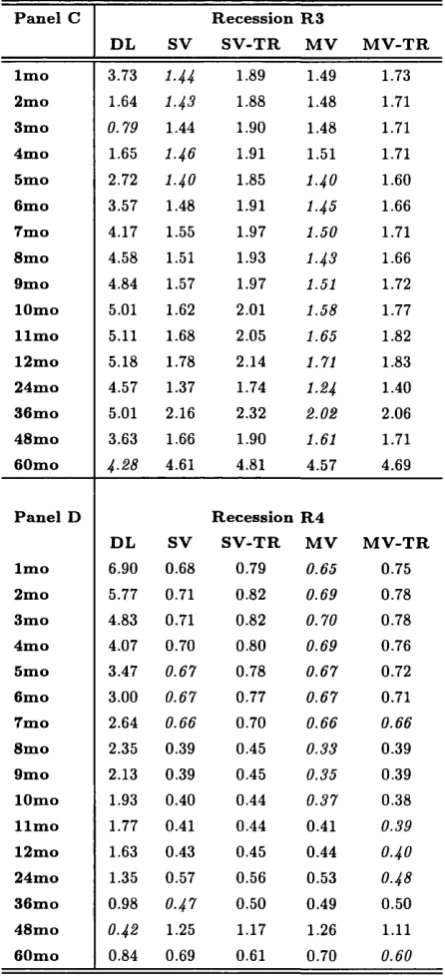
2.18 M aturity-Disaggregated Accuracy - Recessions 3 and 4 ... 90
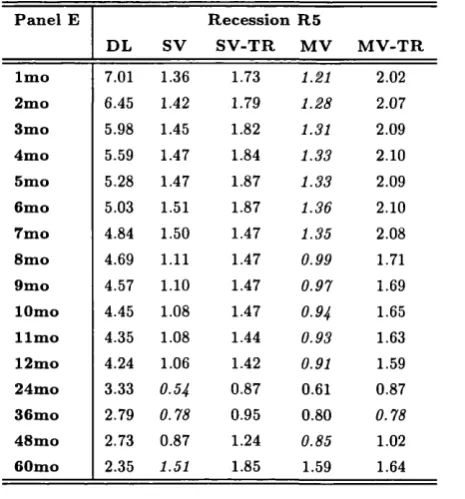
2.19 M aturity-Disaggregated Accuracy - Recession 5 ... 91
2.20 Basic Statistics of Y ie ld s ... 91
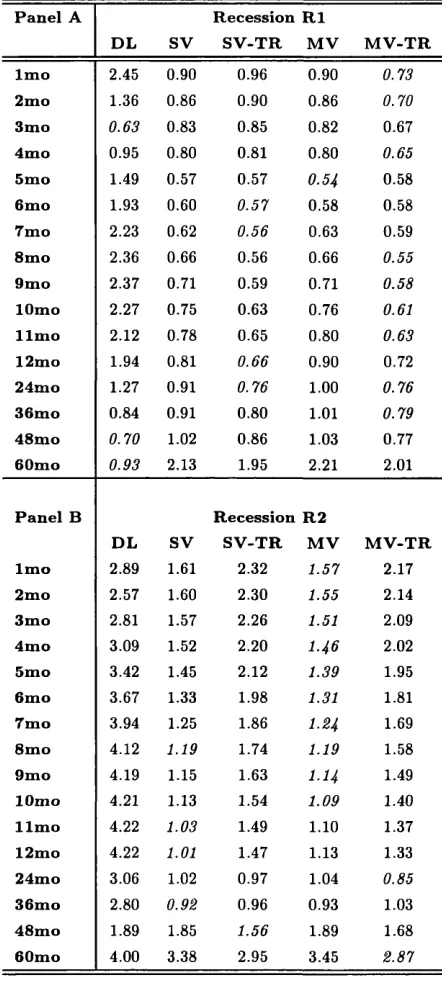
2.21 Results for A lternative Single-Variable Factor S p ecificatio n s... 92
2.22 Results for A lternative Multi-Variable Factor S p e c ific a tio n s ... 93
2.23 Results for A lternative Multi-Variable Factor Specifications cont’d ... 94
2.24 Goodness-of-Fit of A lternative M o d e ls ... 94
2.25 Average MAEs P e rio d -b y -P e rio d ... 95
2.26 MAEs of A lternative S p ecificatio ns... 96
2.27 MAEs of A lternative Specifications cont’d ... 97
3.1 M arket Shares in the World Server M a rk e t... 109
3.2 Key Events in the Network Server Industry 1996-2002 ... 110
3.3 Results for A lternative Demand Specifications for the 0-4 Price Segment - World M arket 133 3.4 Discount Factors for Firms in the Server I n d u s tr y ... 134
3.5 Price-Cost Margins by Firm and Geographical M a r k e t ... 136
3.6 Model-Implied Average Percentual Price Changes Following H P-Com paq Merger . . . 137
3.7 Pre- and Post-M erger Static Profits - 0-4 Price S e g m e n t... 138
3.8 Pre- and Post-M erger Static Profits - 4-10 Price S e g m e n t ... 139
3.9 Pre- and Post-M erger Value Functions - 0-4 Price S e g m e n t ... 152
3.10 Pre- and Post-M erger Value Functions - 4-10 Price S e g m e n t... 153
3.12 M ultim arket Value F u n c ti o n s ... 155
3.13 M ultim arket Critical Discount F a c t o r s ... 156
3.14 M ultim arket Value Functions and Critical Discount Factors - Aggregation Across Re gions and Price S e g m e n ts ... 157
3.15 Com petitive Fringe Model Value Functions - 0-4 and 4-10 Price S e g m e n ts ... 158
3.16 Com petitive Fringe Model Critical Discount Factors - 0-4 and 4-10 Price Segments . . 159
3.17 M ultim arket Value Functions and Critical Discount Factors in the Com petitive Fringe Model - 0-4 and 4-10 Price S eg m en ts... 160
3.18 M ultim arket Value Functions and Critical Discount Factors in the Competitive Fringe Model - Aggregated Across Price Segments and R e g io n s ... 161
3.19 Value Functions for the Compaq-HP-IBM C a r t e l ... 162
3.20 Value Functions for th e Compaq-HP-Dell C artel ... 163
3.21 Side Paym ents to Sustain Uniform Critical Discount Factors Across F i r m s ... 164
Abstract
This thesis is divided in three essays.
T he first essay examines the reactions by incumbent airlines to the th rea t and actual entry of the
low-cost carrier Gol in the Brazilian domestic air tran sp o rt m arket. By estim ating th e reactions in
prices, quantities and supply variables, it investigates the plausibility of theories of entry deterrence
and accommodation.
The second essay proposes and implements a parsimonious three-factor model of the term structure
whose dynamics is driven uniquely by observable state variables. The m ethod allows comparing alter
native views on th e way state variables - macroeconomic variables, in particular - influence th e yield
curve dynamics, avoids curse of dimensionality problems commonly appearing in traditional models,
and provides more reliable inference by using both the cross-sectional and th e tim e series dimension
of the data. I conduct in- and out-of-sample studies using a comprehensive set of US data. I show
th a t even a parsimonious model where the level, slope and curvature factors of th e term structure are
driven by, respectively, measures of inflation, m onetary policy and economic activity consistently out
performs th e (latent-variable) benchm ark model out-of-sample, when considering the five N BER -dated
recessions of the last three decades.
In the th ird essay I empirically evaluate the incentives to tacitly collude in differentiated product
markets. Tacit collusion plays an im portant role in merger policy: com petition agencies sometimes
block mergers on the grounds th a t they will generate ‘coordinated effects’, an increased likelihood
of collusion. I thus propose an approach to coordinated effects merger simulation in m arkets where
multi-product firms operate in differentiated product markets. To the best of my knowledge, this is the
first full empirical im plem entation of a coordinated effects merger simulation model in a differentiated
of the merger between H P and Compaq on their and their rivals’ collective incentives and ability to
sustain ta cit collusion. The results suggest th a t th e incentives to collude in the network server m arket
are substantial, b ut actively decreased following th e merger between H P and Compaq. In addition
to exploring the incentives for collusion on one m arket I also examine th e im pact of (i) m ulti-m arket
contact on firms’ incentive and ability to sustain ta cit coordination and (ii) a com petitive fringe of
smaller players who co-exist w ith a subset of th e larger players in an industry who tacitly collude.
By taking the economic theory of ta cit collusion seriously in an empirical example, I show th a t the
intuition m any economists have for th e effect of mergers on the incentives to tacitly collude is actually
Myself
"Jamais desviaremos nossos olhos dos elevados picos que almejamos conquistar."
Lema, P atru lh a Urso
"The journey is the destination. "
Acknowledgments
The first thing th a t comes to my mind when subm itting the last piece of work as p art of my education,
is how badly behaved I was in kindergarten: how I would sta rt fights, kick the nuns who took care of
me and, as an obvious result of a num ber of other acts, how I was almost expelled from there. Thanks
to their generosity, I was allowed to stay and followed an ‘alternative’ program according to which I
would help picking the vegetables they planted over there, among other activities which were part of
an unusually early youth recovery programme.
But things started much earlier than th a t, and since then I have been privileged to have such special
parents raising me, stim ulating me, giving me the best they could afford - if not more - and leading
by example. Even if during most of my life I disagreed w ith them when it comes to actions, I am proud
to have agreed about the principles. For th a t very reason, they are th e first and most special ones
deserving a word of appraisal. And, by transitivity, this goes back to grandparents, grand-grandparents,
grand-grandparents...
After kindergarten came school, bu t for some reason I really started to get interested in w hat
was being taught at 8th grade, thanks to an outstanding M aths teacher - he was broad, deep and charismatic.
A couple of years later, in one of my Summer holidays during high school, I was convinced to work
as an intern and lived another defining moment. After suffering for one m onth in the heat of Rio, I
didn’t need to be told about the joys of studying anymore. A fter th a t, high school, was great, and
to those teachers I owe much more th an a couple of lines. I was genuinely impressed w ith those guys
and, became really enthusiastic about studying more and more. They made me think, they gave me
T h e initial college years were - to say the least - disappointing, and I had to persuade a lot to keep
on track. To s ta rt with, I wasn’t even sure about which career to follow, so I started two courses a t
once. A t some point I had to learn Calculus, and I still remember how tough it was - w hat exactly
was th e aim of all those f ’s, x ’s and y ’s after all ? But I started to like those things, and was lucky
enough to have another set of inspiring people teaching me Statistics and Econometrics, and this p artly
explains why I am here today. Before heading to London I had another stop, and there this interest
in Econom etrics not only grew, bu t got also broader.
Initially, London was hell. No money, no known faces, darkness, a cold room in student accommo
dation (the heater was made in Norway) and I found myself getting lost in th e middle of th e crowd
again. Thanks to a number of people, I started to regain confidence in myself; in particular, M arcia,
my MSc tu to r, and M argaret, thanks to whom I landed in the FMG.
“T he PhD is a skin thickening process” . This was something I remember repeating hundreds of
tim es when talking to Alberto. Man, i t ’s over, I am about to be able to say th a t I have also m ade it !
T hanks !
Thanks are also due to a number of people ‘gravitating’ around me during all these years, in one way
or another. Especially to Sridhar, Paolo, Beatriz, Moacir, Carsten, Sarquis, X uew en... - Gee, how I
miss those people telling me not to leave late for the airport (over the years, I became a specialist in
missing flights), to call me to go for lunch or to help me w ith some spreadsheet, database or even this
very file ? Thanks are due also to the younger generation, especially Carlao and Cldudia.
Thanks are also due to David for providing me “housing” , and also to a number of faculty whom I
learned to admire during the tim e spent here. Thanks are due to P eter for the am ount of tim e spent
with me in front of a com puter screen and all I ’ve learnt from him (which means so little to him, b u t
is such a massive am ount of info for me !), to John for giving me the opportunity to work for - and
w ith - him. Finally, I should thank Marcelo for so carefully reading early bits of w hat is now being
subm itted as my dissertation.
A special word goes to the IT staff th a t has always assisted me so well. Kuldip, Alex and, especially,
Louise, your help in the moments of desperation is so appreciated. Same holds for the support staff at
the LSE: Maria, Sooraya, Polly, Olivia, P at, Linda, E m m a...
I should also not forget Oliver, John and for David, who also helped me with financial support, and
here goes my appreciation to them.
My junior coauthors have also been so im portant in making me a b etter researcher ! A lberto (again)
Acknowledgments 13
My teaching experience - also outside the LSE - makes me feel lucky to have given me th e op portu
nity to m eet a num ber of persons th a t made me thin k I am not too bad as a person after all. Bernardo,
Flavio, Leonardo, Luiz, A nnette, Hans, Ona and 0 y stein and others did more for me keeping in touch
th an I ever did for you.
T here are also many friends made during this journey th a t have always been around, despite th e
distance, ranging from th e one I met in kindergarten to so many others I made over the years. Being
far away has been tough, and I wish I could be more present, w rite more emails, show up for birthd ay
parties and so on. You know who you are, and you know how special you are, despite th e distance. T he
friends I made here - outside school - deserve a special word of appreciation due to their wonderful
company, their kindness and generosity: Pilar, Anson, Bee, Crison, Ovi, Wendy and so m any others,
it has been m y honour to share so many wonderful moments w ith y o u ...
My last word goes to someone who has been w ith me in spirit and thought for a long tim e, b u t only
recently in locus. Patricia, thank you so much for helping me carry such a heavy load and still be able
This thesis proposes empirical strategies to answer three empirically m otivated questions.
The first essay investigates the reactions by incumbents to the th rea t of entry and to actual entry of
a new com petitor. I estim ate the response in prices, quantities, and a num ber of supply variables for a
panel of routes disaggregated at the airline-route level. Besides examining the existence of preem ptive
responses, I investigate whether I can detect entry deterrence and accommodation by th e incumbents
using inform ation on aircraft utilization, number of flights and measures of flight schedule, accounting
for the asym m etry in responses arising due to product differentiation, and controlling for time-varying
unobservables at bo th the market and the carrier level. The results show evidence of preem ptive
behaviour by th e incumbents in the form of fare cuts. The incum bents do respond to b o th potential
and actual entry, and the former is at least as im portant as the latter. Following the entry of Gol,
the incumbents do not however sustain these responses, suggesting accommodation. There is also
evidence of network adjustm ents in the form of a rescheduling of flights, in w hat can be interpreted
as an attem p t by the incumbents to avoid head-to-head com petition w ith the entrant by redesigning
th e flight schedules.
The second essay proposes and implements a parsimonious three-factor model of the term structure
whose dynamics is driven uniquely by observable state variables. The m otivation behind the paper
is th a t latent variables are well-suited when one is mostly concerned about fitting models to data,
bu t they lack an economic interpretation which is of interest when, for instance, conducting policy
experiments. Following this reasoning, the model can be thought of as ‘Sim s-structural’, since despite
Introduction 15
T he m ethod I propose in C hapter 2 allows comparing alternative views on the way state variables
(macroeconomic variables in the paper) influence the yield curve dynamics. Moreover, it is parsimo
nious, avoiding curse of dimensionality issues commonly arising in traditional models. Finally, it is
in a position to provide more reliable inference by using both th e cross-sectional and th e tim e series
dimension of th e data. In the empirical im plem entation of the m ethod, I conduct in- and out-of-sample
studies using a comprehensive set of US data. There I show th a t even a parsimonious model where the
level, slope and curvature factors of the term structure are driven by, respectively, measures of infla
tion, m onetary policy and economic activity consistently outperform s th e (latent-variable) benchm ark
model out-of-sample, when considering the five NBER-dated recessions of the last three decades.
T he th ird essay empirically evaluate the incentives to tacitly collude in differentiated product m ar
kets. T he idea I follow is to estim ate the incentive-compatibility constraint for collusion vis-d,-vis
defection for each firm in a given market w ithin a repeated game where firms act strategically on
prices. The questions I address are w hether there are incentives to collude prior to a merger and
w hether these incentives change as a result of a merger, given th e repeated interaction between a
smaller num ber of players. I show in the paper th a t the intuition m any economists have for th e effect
of mergers on the incentives to tacitly collude is actually wrong, since they do not necessarily increase
w ith less players.
Following Friedm an (1971), I consider the feasibility of sustaining a candidate collusive equilibrium
using ‘grim ’ strategies. To examine the incentives to collude using grim strategies, one needs to consider
the returns achieved by each firm in the three pricing scenarios - ‘Collusion’, ‘Nash equilibrium pricing’
and ‘Defection’. Fundam ental ingredients for this com putation are a dem and model to com pute profits
of the stage game, an asset pricing model to estim ate the discount factor of the firms, and an algorithm
to com pute the value functions of th e firms in each of the above scenarios. In addition to exploring the
incentives for collusion in one market I also examine the im pact of (i) m ulti-m arket contact on firms’
incentive and ability to sustain tacit coordination and (ii) a com petitive fringe of smaller players who
co-exist w ith a subset of the larger players in an industry who ta citly collude. I apply th e techniques
using d ata from the market for network servers prior to the m erger between Compaq and Hewlett-
Packard. I find on th e incentives for firms in th e server industry to tacitly collude. The results suggest
th a t the incentives to collude in the network server m arket are substantial, bu t actively decreased
Differentiated Product Markets
1.1 Introduction
This paper investigates how incumbents respond to the th rea t of entry of a new com petitor. To do
so, I estim ate th e reactions to route entry of a low-cost carrier (LCC) in the Brazilian domestic air
tran sp o rt market.
The Brazilian domestic air tran sp o rt market is not only interesting due to the dimensions of the
country and its emergence in economic term s, resulting in increased dem and for air tran spo rt, b u t also
for providing a case study of a low-cost carrier which entered the m arket following its liberalization
after a number of failed attem p ts to take on the big players in th e industry before its establishm ent. In
fact, in 2008, seven years after entering th e Brazilian market w ith six aircraft, Gol Airlines commands
some 45% of the market, w ith close to $3bn in net revenues in 2007 and over $3bn in m arket value. 1 The industry has also been closely watched by the an titrust authorities given a number of mergers,
acquisitions and associations (such as code-sharing agreements) between players.
To estim ate the reactions to Gol’s entry, I estim ate the response in prices, quantities, and a number
of supply variables for a panel of routes disaggregated at the airline-route level. Besides examining
the existence of preem ptive responses, I investigate w hether I can find evidence of entry deterrence
or accommodation using inform ation on aircraft utilization, num ber of flights and measures of flight
schedule, accounting for th e asym m etry in responses arising due to product differentiation, and con
trolling for time-varying unobservables at both th e market and the carrier level.
1.2. The Brazilian Domestic Airline M arket 17
Based on th e entry p attern of Gol Airlines, I define a route as being threatened by Gol whenever it
is not flying th e route b u t operating w ithin an area of influence of th a t route (namely of th e endpoint
airports). This relates to an extensive literature on airline competition, in particular th a t related to
th e debate of airport presence vs route presence as sources of competitive advantage and m arket power
(see, for instance, Borenstein, 1989, and Evans and Kessides, 1993 for the opposing views). In contrast
w ith m ost of th e papers on the airline industry, which tend to focus on w hat happens after entry (as
Berry, 1990, 1992), I follow the more recent literature and concentrate on w hat happens prior to entry
(as Goolsbee and Syverson, 2008).
By using an empirical framework to estim ate preemptive actions I can also te st for entry deterrence
and accommodation. In particular, I focus on th e plausibility of limit pricing in th e spirit of Milgrom
and R oberts (1982) and excess capacity a la Dixit (1980).
T he results show evidence of preem ptive behaviour by the incumbents in th e form of fare cuts. The
incum bents do respond to both potential and actual entry, and the former is at least as im portant
as th e latter. Following th e entry of Gol, the incumbents do not sustain these responses, suggesting
accommodation. There is also evidence of a repositioning or rescheduling of flights, as th e share of
weekday peak tim e flights increase at the expense of th e share of weekday off-peak tim e flights, in
w hat can be interpreted as an attem p t to avoid head-to-head com petition w ith the entrant.
T he paper is organized as follows. Section 2 presents the Brazilian domestic air tran sp o rt market.
Section 3 discusses w hat the literature tells us about how incumbents respond to entry and to which
extent we can take th e implications of the models to data. The Brazilian dataset collected by DAC
used in this study is discussed in Section 4, whereas the empirical strategy is presented in Section 5.
Section 6 presents the results and the final section concludes.
1.2
The Brazilian Domestic Airline Market
1.2.1 Industry Overview
The process of liberalization of the Brazilian domestic air tran sp o rt m arket initiated in the early
1990s had a crucial role in attractin g newcomers to the industry. As opposed to the early entrants,
which lacked the financial resources and the infrastructure to succeed in the m arket, and eventually
went burst, Gol Airlines, whose operations started in January 2001, was p a rt of one of th e biggest
Brazilian transportation groups (Grupo Aurea) . 2 Moreover, Gol’s internal organization tried to adapt
to th e Brazilian context some key aspects of the internal organization of Southwest Airlines, a low-cost
carrier operating in the US.
By early 2001, th e process of liberalization of the market, supervised by the D epartm ent of Civil
A viation (DAC) was in a stage where, in stark contrast w ith th e th irty or so years of strict control over
key variables, airlines had substantial freedom to operate, in the sense th a t fares and flight frequencies
were alm ost entirely liberalized. In particular, by th a t time airlines were free to enter and exit markets
as quick as allowed by technical regulations, so th a t it would take no longer th an one m onth for a firm
to have a proposed new flight authorized by the regulator. As a result, the market grew steadily over
time, reaching 60mn and 83mn travellers in 2003 and 2005, respectively.
T he new regulatory framework made it easier for b oth newcomers and incumbents to adjust their
whole network in response to changing market conditions. In such a setting, entry th reats may arise
and m ight have significant - even if short-lived - im pact on fares.
This very process which a ttracted Gol Airlines, the player I focus in this paper, saw the incumbent
airlines in a fragile financial situation and having to struggle against a com petitor w ith deep pockets
but, m ore im portantly, w ith a business strategy unknown to them, since Gol was the first scheduled
LCC in L atin America.
Table 1 compares some characteristics of Gol to those of the main incumbents (VARIG, TAM and VASP), for year 2002. A lthough its yields (price normalized by passenger and kilometers, the price
m easure used in the industry) were some 30% lower than those of th e incumbents, the load factors
(fraction of seats sold) were on average at least 1 0% higher which, coupled w ith costs estim ated to be some 40% lower th an those of th e com petitors, resulted in Gol being th e only profitable airline among
th e m ajor ones.
1.2.2 The Entry P attern of Gol
In contrast with a num ber of well-known LCCs such as Ryanair and Southwest, which operate using
the point-to-point transit model, Gol follows most of the m ajor carriers in the use of a hub-and-spoke
network of routes. W hereas th e former essentially means th a t an aircraft will fly between airports A
and B w ithout any connecting flights and the endpoint airports, the latter results in a more complex
network structure, usually com pared to a chariot wheel, in which all traffic moves between the (pe
ripheral) spokes and the (central) hub. The main benefits of the hub-and-spoke over th e poin-to-point
model are the fewer num ber of routes needed to connect all airports and th e easiness w ith which new
1.2. The Brazilian Domestic Airline M arket 19
carrier, and the model is less flexible, needing a substantial am ount of time to be redesigned. Moreover,
delays can affect the whole network, as often experienced by the common airline traveller.
W hen coupled w ith th e characteristics of th e Brazilian m arket, a vast country whose population
is concentrated along th e A tlantic coast, especially in the Southeastern region, the p a tte rn of entry
followed by Gol differs substantially from the p attern of pointwise entry of most LCCs, being more
closely related to th a t of W al-M art.3 In practice, this means th a t, starting from its m ain hub in Sao Paulo (the economic powerhouse of the country), Gol’s operation would radiate from th e inside out,
first towards Rio de Janeiro and Belo Horizonte, respectively second and th ird cities of th e country,
also located in the Southeastern region, and would then quickly expand through three m ain corridors.
The first corridor goes Southwards until Porto Alegre, the second goes towards the N ortheast (in
cluding cities such as Salvador, Recife and Fortaleza), whereas th e th ird corridor goes towards Brasilia,
the country’s capital (and, a t a later stage, from there towards the “inner-N orth” , including Manaus,
the capital of the Amazon state). As a result, the choice of routes starting from an airport Gol entered
was rath er straightforward: one from th e hub outwards, and another from outwards tow ard the hub,
w ith a num ber of connections in between in both cases. This feature explains why whenever it entered
an airport, Gol immediately started flying “all” routes.
A nother aspect of Gol’s entry p attern th a t resembles th a t of W al-M art is th a t Gol did not jum p
to far-off locations to later fill-in the area in-between. Before flying from Sao Paulo towards Porto
Alegre, th e state capital located furthest to the South, for instance, Gol would first s ta rt flying to the
capitals located in between, C uritiba and Florianopolis. After the routes along the main corridor were
established, it was tim e to consider entering medium-sized cities relatively close to the corridor.
The economic justification the literature gives for this entry p a tte rn are economies of density.4 An economy of density is a type of economy of scale, which arises when an airline increases th e frequency
of flights on a given route structure/region instead of expanding the route network. Economies of
density can be potentially enjoyed through channels such as management (it is easier for upper-level
m anagement to oversee a set of locations if they are closer together), m arketing and advertising, but
especially maintenance in th e case of Gol: given th a t its aircraft operate for more th an 12 hours on
a daily basis, maintenance needs to be done overnight in a num ber of different locations, so having a
dense route network minimizes the number of maintenance centres.
1.3
How Incumbents React to Entry
1.3.1 Preemptive and Post-E ntry Reactions
Most of th e empirical literature focuses at the strategic behavior of incumbents after entry occurs.5 Exceptions to this line of research are Morrison (2001) and Goolsbee and Syverson (2008). W hile the
former investigates the im pact on prices of actual, adjacent and potential route presence, the later
focuses on how far back prior to entry do incumbents react, following airport presence of the newcomer
in the two endpoints (airports) of a route.
Studies of the effects of (potential and actual) entry on the strategic behaviour of incumbents go
back at least to the work of Bain (1956). A lthough there is some evidence documenting the existence
of preem ptive price-cutting by incumbent airlines (W indle and Dresner, 1999; Morrison 2001), there
is no agreement about the underlying reasoning leading to it. Since there is limited inform ation in the
DAC d ataset I use, I describe alternative theories and try to provide suggestive pieces of evidence th a t
favour some of the theories in th e sequel.
On th e one hand, Dixit (1979, 1980) puts forth the idea th a t incumbents may invest in excess
capacity in order to make entry less attractive. In our setting, this would mean th a t incum bents add
either bigger aircraft or increase the num ber of flights in a given route prior to entry of the incumbent in
order to make it less attractive. On the other hand, Kreps and Wilson (1982) argue th a t incumbents
might use a limit pricing strategy, according to which pre-entry prices are set so as to discourage
potential entrants (in particular, prices generating zero profits for th e entrant). A particular way to
react in capacity in the airline market is by rearranging th e network, so th a t the incumbent can offer
more flights leaving at specific times.
A lternative preemptive stories th a t depend on the micro-level content of a dataset include switching
costs, as in Klemperer (1987) and long-term contracting, as in Aghion and Bolton (1987). A lthough
all of them are extremely interesting avenues of research, they would require micro-level information
about th e ticket (price, fare class etc) and about bo th who bought th e ticket and the purpose of the
trip (frequent-flyer membership, business or leisure trip, company discounts etc), which unfortunately
is unavailable in most cases.
1.3. How Incum bents React to E ntry 21
1.3.2 Product Differentiation and A sym m etric Responses
“P roduct differentiation is pervasive in markets. It is at th e heart of structural em
piricism and it smoothes jagged behavior th a t causes paradoxical outcomes in several
theoretical models.” , Anderson (2008)
W hen compared to th e product offered by the m ajor airlines, the LCC product is quite differen
tiated, in th e sense th a t it is a ‘no-frills’ product: buying a ticket from a LCC might mean using
airports far from city centres, having fewer flights to choose from, arriving and departing at times not
necessarily the most convenient (as associated costs such as airport fares tend to be lower at these
times), sometimes having to pay extra charges for dispatched luggage, not having the convenience of
in-flight service and very often having to struggle w ith little legroom and seats th a t will not recline.
Typical examples of airlines operating in the low-cost segment are Ryanair (in Europe) and Southwest
(in th e US).
Although not all of these factors might bite for short-haul flights, they become more and more im
po rtan t as th e flight distance increases. In other words, product differentiation increases as a function
of flight distance, as it becomes increasingly difficult to cope with, for instance, little legroom, no
in-flight service, and to carry only hand-luggage as flight lenght increases. An im mediate consequence
of this fact is th a t incum bents’ responses to entry might also differ according to product differentia
tion, so th a t they tend to soften in routes where th e LCC product is more distant (in the space of
characteristics, see Lancaster, 1966) from the product offered by m ajor airlines.
In the Brazilian m arket, th e main sources of product differentiation (besides flight distance) are
flight frequency and flight scheduling. This happens because Gol’s in-flight service and general cabin
comfort have always been comparable to those offered by the incumbents. Besides not having to pay
for in-flight drinks or snacks, there were no extra charges to baggage handling. W hat is more, most
Brazilian cities have only one airport; those w ith more th an one airport do not usually have flights
leaving for the same airport. For instance, in the case of Rio de Janeiro, the Santos Dumont airport,
located in the city centre, operates only scheduled flights to Sao Paulo or regional and unscheduled
flights to smaller cities, which are too small to be included in th e DAC dataset.
It then follows th a t, in a m arket where the business travellers are estim ated to command some 70%
of the m arket (Evangelho, 2002) flight distance (which increases th e contrast between full-service and
low-cost carriers), flight frequency and flight schedules are the m ain sources of differentiation of the
LCC product. I thus investigate to which extent product differentiation softens the reactions from
the incum bents’ one in the space of characteristics will result in softer reactions by the incumbents ie.
I allow price responses to be asymm etric.
1.3.3 Farther Particulars and D ata Availability
Price information is quite tran sp aren t in the Brazilian m arket, since these can be learned from the
companies’ websites for a t least th e last eight years. The num ber of tickets sold (ie. realized demand)
and the number of seats supplied by the airlines is however sensitive inform ation — although both are
known by the authorities, only ticket sales are usually made available to researchers; instead of the
number of seats supplied, authorities usually make available inform ation on average aircraft size and
th e fraction of seats offered in different periods (weekdays vs weekends, peak-tim e vs off-peak-time).
Although airline quality is not exactly observable, it is quite stable over tim e and can be controlled for
with th e use of fixed-effects, as discussed in Section 1.5. P roduct differentiation in other dimensions
(for instance, baggage allowance or extra costs for dispatching baggage, use of different airports etc)
is non-existent in the Brazilian m arket during the sample period.
As a result, one can study price reactions in a quite detailed way, whereas th e study of quantity
reactions is more limited — I thus resort to the study of proxies to quantity reactions taking the forms
of (i) aircraft size; (ii) (an estim ate of) number of flights; (iii) m arket shares.
1.4
The Data
The dataset used in this study was collected and made available by th e then Brazilian regulator, the
D epartm ent of Civil Aviation (DAC). Inform ation of the panel of routes comes from the report entitled
“Average Yield of Monitored A irport P airs” . D ata is observed at th e m onthly frequency and consists
of airline-specific d ata for up to 94 origin-destination pairs from September 2001 to M arch 2004.
The dataset is aggregated at the city-pair level, meaning to say th a t a flight going from A to B is
different from one going from B to A, something usual in air tran sp o rt datasets and studies. As a result,
we have observations over 31 m onths and up to four airlines operating in each city-pair. According to
the DAC report, this amounts to 98% of the passenger-weighted kilometers flown w ithin th e sample
period, not including small regional an d /o r non-scheduled airlines operating in the Brazilian market.
Following the expansion of th e m arket in the period, the dataset begins reporting Gol operating in 51
routes serving 11 cities to reach 76 routes serving 25 cities in th e final period.
The variables I observe include, for every route (origin-destination pair), th e average yield (which is
1.5. Empirical Strategy 23
of th e incumbents flying a route; the tim ing of the entry of Gol; a dum m y variable indicating a code
share agreement between the incum bents TAM and VARIG; the share of non-stop seats during peak
tim e of the i-th incumbent on the od-th city-pair at m onth t; the share of non-stop seats linking
central airports of th e i-th incumbent on the od-th city-pair at m onth t; th e share peak and off-peak
tim e flights operating on weekdays and weekends for the i-th incum bent on th e od-th city-pair at
m onth t; average aircraft size; the average operating costs. The A ppendix contains detailed variable
descriptions.
A ctual entries of th e LCC are concentrated in the first half of th e dataset. This will constrain the
use of lagged variables for lags above four in the empirical exercise, since th e first entry of Gol in the
d a ta occurs at period four, but I show evidence th a t this does not im pact th e final results.
Using the geographic coordinates of each airport, I also com pute th e distance between all airports in
th e sample. Following these calculations, I obtain th a t twelve of th e airports have at least one airport
located less than 250km away, twenty two airports have at least one airport located less th a n 500km
away, and twenty four airports have at least one airport located less th a n 1,0 0 0km away (approxim ately 155, 310 and 620 miles, respectively). These variables will be used when investigating th e th reat of
entry using alternative definitions of th e neighbourhood (area of influence) of a route.
As opposed to the US D epartm ent of Transport (DOT) DB1A files, th e dataset I use is not a 10%
random sample of all domestic tickets in a given quarter. On the low side, this means th a t there is no
detail such as in a micro-level dataset w ith detailed inform ation on, say, fares, ju st average fares. On
the other hand, the DAC d ataset has m onthly observations, thus supplying more detailed inform ation
in th e tim e series aspect th a n its US counterpart. Information th a t would be useful to take a number of
theoretical models to d ata but which th e DAC dataset lacks include fare class, w hether the passenger
is a frequent flyer, the place of residence, the purpose of th e trip.6
1.5 Empirical Strategy
The empirical strategy I follow can be cast as a version of an event-study, since I investigate an event
of interest looking at w hat happened prior to it, during its occurrence and after it had occurred. In
w hat follows I propose four main specifications to study the reactions to entry of Gol, which I then
take to data. The first — or Baseline — specification only allows for responses of the incumbents to
Gol’s entry after Gol has actually entered a route.
T he second specification — which I refer to as the P specification — allows for preemptive responses
whenever a route is under th rea t. More precisely, whenever the LCC is operating w ithin a neighbour
hood (or area of influence, to be defined below) of one of the endpoints of a route, but not a t the
route itself, this route is considered to be under th reat. To estim ate this effect, I consider alternative
measures of neighbourhood and take all of them to data. This generalizes the approaches of Berry
(1992), W indle and D resner (1999), Morrison (2001), Goolsbee and Syverson (2008) and others since,
instead of focusing on com petition a t th e airport (and then route) level, I am considering com petition
prior to airport entry.
The th ird specification — which I refer to as the P U specification — builds on th e P specification
b u t differs from it by controlling for time-varying market unobservables. By doing so, it accounts for
time-varying variables such as income changes in a given m arket, national advertising and changes in
the cost structure of a given m arket.
Finally, I account for product differentiation as a determ inant of reactions to entry in w hat I refer
to as th e P U D specification. This specification accounts for the fact th a t product differentiation can
soften reactions to entry in a significant way, thus allowing these reactions to be asymmetric.
B a selin e Specification (B )
I define y i r j as be th e outcome of interest, such as the logarithm of either prices or quantities for
incum bent i flying route r at tim e t. The baseline specification is given by
K
V ir,t = 7 t r + p T L C C P r e s r,t * +t + X i r j O t + £ i r , t
T = 0
where 7ir and p t are, respectively, carrier-route and time fixed effects, t* is the period when Gol starts
operating a route, L C C p resrjt*+T are dummy variables indicating th a t Gol is operating route r at
tim e t* 4- r , r > 0 (I let K = 5 in the empirical im plem entation), and X irj is a vector of controls
which might also be included, such as cost shifters in the case of a pricing equation. The coefficients
measure the im pact of LCC presence on the variable of interest.
P reem p tive Specification (P )
The baseline specification does not capture the effects of the th rea t of entry posed on th e variable of
interest when Gol operates w ithin a neighbourhood of the endpoints of a route w ithout actually flying
the route. I thus define th e variable L C C th re a tr^ * -T,T > 1 taking value one whenever th e LCC Gol
is present in a neighbourhood (area of influence) of at least one of the endpoints of route r, b u t not
1.5. Em pirical Strategy 25
specification thus consists on the baseline specification augm ented w ith th e indicators m easuring the
th rea t of entry, viz.
K L
V ir,t ~ 'Kir "b f i t “1“ ^ ^ P TL C C p T C S r ^*^.T “I- ^ ^ d - T - L C C t h r e a t - f ^ * —j- “I- X i r ^OL “f" £ ir ,t
r = 0 t— 1
where the coefficients ST measure th e im pact of the LCC th reat on th e variable of interest.
A lthough a particular case of the L C C th re a t variable consists on th e case where Gol operates at
the airport b ut not at a given route, the neighbourhood definition I adopt is more general than the
airport one, since it allows defining an area of influence of a route (such as a circle centered at the
endpoint airports and radius d). It is worth noting th a t in the Brazilian dataset, th e th reats I observe
are outside the airport, meaning to say th a t once Gol enters an airport, it will immediately operate
all the routes originating or ending a t th e airp o rt. 7
P re e m p tiv e Specification C on trollin g f o r T im e-V a ryin g U nobservables (P U )
The fixed-effects in specification P are unable to capture time-varying m arket unobservables. To illus
tra te the im portance of controlling for this effect, assume th a t LCC presence in a route is correlated
w ith time-varying unobservables th a t are carrier- and market-specific, such as (i) income changes in a
given market; (ii) nationwide advertising to stim ulate LCC demand; (ii) a change in the cost structure
in a given market, following the redesign of the network and resulting LCC increased presence in this
market.
As the carrier-route and tim e fixed-effects are unable to adequately control for these unobservables,
I adopt an error-component decomposition of the tim e fixed-effects th a t uses a fact specific to airline
m arkets which allows to group routes into endpoint cities to control for city-time effects. As a result,
the tim e fixed-effects can be decomposed into carrier-tim e fixed effects and city-time fixed effects, thus
allowing for modelling time-varying observables at both the m arket and th e carrier level. To perform
this, note th a t a route r can be w ritten as a combination of cities of origin o and destination d and
th a t routes can be grouped into cities of origin and destination (thus markets, which appear in a much
smaller number in the data). I thus replace the time- and carrier-route- fixed-effects w ith carrier-tim e
and city-time fixed-effects. W hile the former are able to capture time-varying unobservables related to
general strategic variables of the carriers, such as nationwide advertising and network decisions, the
la tte r capture market-specific changes. The PU specification then reads
K L
Viod,t = lio d “b L^it ~b Vo,t "b Vd,t “b ^ ^ (3TL C C p r e S od t*+T “I- ^ ^ 5TL C C t h r e a t odt*_ T -(- X iod,t a -I- £iod,t
T = 0 T —l
where yiodj measures th e variable of interest of incum bent i flying from origin o to destination d at
tim e t, 7iod, fiit, u0)t, vdj are respectively carrier-route, carrier-tim e, origin-time and destination tim e fixed-effects.
P re e m p tiv e Specification C on trollin g f o r T im e- V arying U nobservables and P ro d u ct D iffe re n tia tio n (P U D )
The specifications proposed so far do not account for product differentiation. As a result, given two
routes entered (or threatened) by the entrant in a given period and origin, the incumbent reactions will
differ only by the destination-tim e fixed effect. If, however, there are variables th a t shift the intensity
of th e reactions, such as flight distance, one can generalize the PU model by defining th e PUD model
as follows:
K L
yiod,t = liod + A4it + vo,t + Vd,t + f3TL C C p resodj*+T
+ E
5TL C C th re a todf * - T +T = 0 T = 1
“I~ Z io d ,tL C C p r e S od t p -j- X i od tOi £iod,t
where, Z iodj is a vector of shifters of th e intensity of reactions and p is a param eter to be estim ated.
In the case of price reactions to entry, one would expect at least some of th e 6 and coefficients to
be negative and statistically significant, indicating fare cuts given the th rea t of actual entry of Gol.
If product differentiation issues play a role in price responses, the p coefficients would be expected to
have a positive sign, softening these reactions for routes where the rivalry between th e incumbents
and the entry is less intense.
D iscu ssio n : Iden tifica tio n , F ixed-E ffects
T hroughout my analysis I assume th a t network decisions made by th e LCC Gol (in particular, entry
decisions) are exogenous. More precisely, I assume th a t its network decisions are m ade in advance
(ie. are predetermined) of pricing decisions and th a t the fixed-effects can control for (time-varying)
unobservables, so th a t my least squares estimates are consistently estim ated. In w hat follows I justify
this assumption economically, leaving a thorough set of robustness tests (which give additional support
1.5. Em pirical Strategy 27
As discussed above (Section 1.2.2), network-related decisions have to be made well in advance of
reactions for a num ber of reasons.8 First, in th e case of a start-up , as was Gol in 2001, one needs a detailed business plan before starting operations, not only to present to potential investors, but
also serve as guidance when establishing branches and m aintenance centres at airports or hiring and
training staff.
Second, one needs to plan (and order) well in advance a num ber of aircraft, choose their specifications
and delivery times; typically, these decisions are made years in advance and impose extra restrictions
on the company regarding network adjustm ent, since specific types of aircraft are designed for specific
route lenghts.9
Third, th e redesign of hub-and-spoke networks as the one of Gol also involves dealing w ith passengers
who bought tickets in advance, in case of routes to be exited, and selling tickets for a new route before
entry.
Fourth, while the response variables (be it a price or a quantity measure) are measured a t the route
level for a given incum bent, L C C th re a t and L C C p res are the consequence of the complex network
design of th e entrant, so rejecting th e exogeneity assum ption in this specific case would am ount to
saying th a t the responses of a single route would lead to a network redefinition by th e entrant.
Fifth, exogeneity is consistent with Gol’s entry p attern described in Section 1.2.2 — the underlying
behavioural assum ption is th a t the “radial” entry p attern of Gol starting from Sao Paulo, is not
influenced by the reactions to entry. In other words, Gol has to enter the key m arkets (starting from
Sao Paulo) if it is to succeed.
A nother argument th a t needs to be addressed is the fact th a t route profitability is an unobserved
variable (at least to the econometrician), implying th a t least squares renders inconsistent estim ates. To
account for th a t, previous studies since at least W indle and Dresner (1999) and Morrison (2001) have
invested in careful modelling of fixed-effects. More recently, Gooslbee and Syverson (2005) p u t forth a
model similar to my P (Preem ptive) specification, whereas their 2008 paper is a particular case of my
PU specification, with route fixed-effects 7iod and incum bent-tim e fixed effects, p it. The way I specify my general model (PUD, b u t also PU) generalizes these earlier contributions by controlling also for
time-varying m arket effects (profitability, in particular) using time-origin and tim e-destination fixed-
effects, vQ)t and Vd,t, respectively. All in all, my final specification thus captures time-varying market
unobservables and time-varying carrier unobservables (unobserved quality, for instance). If th e route
fixed-effects 7iod capture m arket heterogeneity constant over tim e (such as the fact th a t a given route connects two state capitals), th e carrier-tim e fixed-efects p it capture, for instance, varying financial
conditions of an airline (bankruptcy, in particular), where the time-varying origin and destination
fixed-effects capture changes in economic conditions (such as economic growth in the countryside due
to the commodities boom ), seasonality patterns (or tourism effects during holidays), and profitability.
One im portant variable not observed but which can be controlled for by the above fixed-effects is
airline quality (one can think about leg room, or comfort in general to fix ideas). If quality is time-
varying, but homogeneous across routes of a given carrier, then it is controlled for by p,it. In practice,
quality tends to be quite stable over tim e for a given route, since fleets tend to be standardized to
minimize costs and ordered well in advance (at least 2-3 years). W h at might vary is the difference
in quality between an incum bent and the LCC, and this will be accounted for by using alternative
variables in the interaction term Zi0d:tL C C p res0d,t• In particular, I use flight distance as a control,
since the difference in quality tends to increase in longer flights.
1.6
Estimation Results and Analysis
This section reports results on price and quantity reactions of th e incumbents given the th rea t of
entry and the actual presence of the LCC Gol. I sta rt by estim ating price reactions and the associated
responses in demand (ticket sales), controlling for costs and alternative measures of product differ
entiation. Next I focus on different measures of quantity responses (responses in the supply of seats
by each incumbent at every route): first, I investigate excess capacity by estim ating the responses in
aircraft size and (a lower bound on) the number of flights; second, I investigate product reposition
ing by estim ating the responses in the share of seats supplied in weekdays/weekends and peak- and
off-peak-time flights.
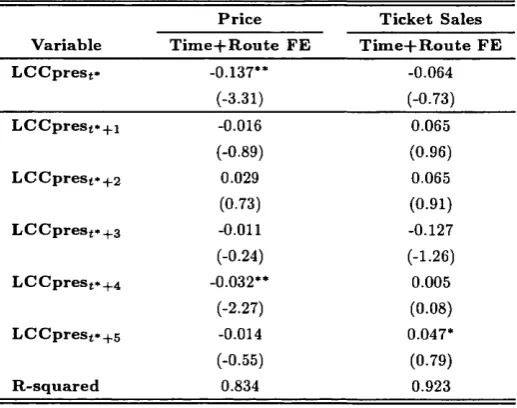
1.6.1 Incumbents Do React Preemptively Using Prices
B aseline Specification (B )
The estimates from th e baseline specification are hard to justify in economic terms: they show a 14%
fare reduction at the period Gol starts flying a route with no response in th e num ber of tickets sold
for five months, as reported in Table 1.3. 10
1.6. Estim ation Results and Analysis 29
P reem ptive Specification (P )
W hen investigating preem ptive effects, I consider a number of measures of neighbourhood or area of
influence. F irst, I assume a route to be threatened whenever Gol entered the geographic region in either
of th e endpoint airports of a route, bu t not the route itself. Brazil is divided into five geographic regions
(South, Southeast, N ortheast, N orth and Midwest), so this is a very broad concept of neighbourhood. I
also consider an alternative definition of regions by defining the coastal area into three regions and the
inner p art of th e country into two regions (inner-North and inner-South), b u t the results were identical
to th a t of geographic regions. 11 I then focused on more localized measures of area of influence: after obtaining th e geographic coordinates of each airport and com puting th e distance between them , I
defined an area of influence (or neighbourhood) to be a circle centered at a given airport and with
radius d.12 Following this reasoning, whenever Gol operates w ithin an area of influence, bu t not at
a given route, this route is considered to be under th reat. To this end, I define radii of 500km and
1,000km . Overall, the results for the d^ooo criterion do not differ significantly from th a t of region,
bu t those for d$oo tend to show stronger yet sometimes more unstable reactions to entry; this can be
partly attrib u ted to th e fact th a t by considering a smaller neighbourhood one is effectively using a
smaller sample, but th e increasing reactions to an ever approaching th re a t by a com petitor also makes
economic sense. 13 So, for every route, we investigate whether there were reactions to th e th rea t of entry going back up to four months using four alternative measures of area of influence.
Although one might argue th a t four months is not a long enough window, I choose to do so for
a number of reasons. F irst, I am constrained by the data, since th e first period an entry occurs in
the dataset is period four; by increasing the number of lags, I am at risk of dropping im portant
inform ation and reducing the sample, a critical issue especially for th e g^oo area of influence. 14 Second, given the historically high Brazilian (real) interest rates, it would be surprising to see significant
fare reductions many periods before entry, since an incumbent following this strategy would forego a
substantial amount of revenues. 15 Third, the tim e it takes between Gol requiring to operate a route
11 W hen the area of influence is defined as the geographic region, there are 5 airports in th e Southern region, 11 in the southeast, 4 in the N ortheast, 3 in the North and 2 in the M idwest. W hen considering the alternative criterion o f zones of influence, I divide the coastal cities into three regions (w ith 5 airports in the Southern region, 3 in the Southeast and 5 in th e N ortheast) and divided th e inner part of the country into 2 regions, “inner-North” , w ith 7 airports, and “inner-South” , w ith 5 airports. T he results are robust to these definitions.
12 T he use of areas of influence or neighbourhoods is by no m eans new — see for instan ce D avis (2006), who stu dies dem and for m ovie theathres in the US accou nting for their location.
13Of the 12, 22 and 24 airports w hich have neighbourhoods w ithin, respectively, 250km , 500km and 1,000km, only 5, 11 and 12 are threatened by Gol.
14T he results of a larger num ber o f lags for the di,ooo and region neighbourhood definitions shows th at, by and large, fare cuts and quantity increases occur th e sam e way as for the specifications whose results we report.
and th e regulator authorizing it is roughly one month, as discussed above. Finally, the state of financial
fragility of the incumbents makes it hard for them to sustain aggressive fare cuts for long periods.
W hen allowing for preem ption one obtains a fare reduction of about 21% at the m onth before Gol
starts flying a route, as reported in Table 1.4. At the period entry occurs, th e incumbents reduce
fares again by 16-20%, which is followed by another reduction of about 6% four periods after entry, suggesting th a t demand is indeed price-sensitive.
Together with the fare reduction prior to actual entry, there is an associated increase in ticket sales
ranging from 31-52%, depending on th e area of influence criterion considered. There is no significant
effect at th e month Gol enters a route, b u t further (marginally significant) increases occur two and
five periods after entry.
Overall, the results for both price and ticket sales are robust to th e choice of area of influence.
Im portantly, the preem ption-related coefficients of the price equations are not only significant, but
are also larger than those measuring fare reduction at entry, and the reaction in dem and responds
accordingly.
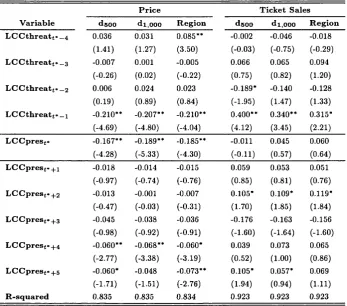
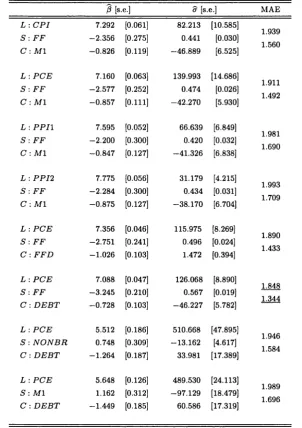
P re e m p tiv e Specification C on trolling f o r T im e-V a ryin g U nobservables (P U )
The PU estimates suggest a significant fare reduction at the m onth prior to entry (24-36%), followed
by more moderate reactions at the period of entry (18-12%) and four and five periods after the actual
entry of Gol (3-5% and 6-9%, respectively), as reported in Table 1.5. As in the case of the Preemptive
model, th e effect of preemption on fares dominates th a t of post-entry reaction.
The response in ticket sales occurs only for the models with a wider area of influence (di,ooo and
region), being insignificant whenever g^oo- Although no model identifies reactions in quantity at the
period Gol actually starts operating a route, all of them measure increases two and five periods after
actual entry (25-28% and 15-21%, respectively). As opposed to w hat happens with price, the post
entry responses in demand seem to dom inate the preemptive effects, suggesting th a t they are somewhat
sluggish.
By controlling for time-varying market unobservables, the results for the PU specification suggest
th a t the P specification tends to underestim ate preem ptive reactions in prices and overestimate reac
tions to actual entry at time t*. On th e other hand, when it comes to