ISSN Online: 2327-5960 ISSN Print: 2327-5952
The Limits of the Balanced Scorecard
Ivo Hristov, Antonio Chirico
Department of Management and Law, University of Roma Tor Vergata, Rome, Italy
Abstract
Our research focuses on the limits of the Balanced Scorecard. The aim of the work is to provide a basis for in-depth study on the limits of the balanced scorecard. Ac-cording to Tranfield et al. (2003) [1] we are tackling the topic through a systematic review of the literature. We reviewed articles published in 48 journals, in 3 different subject area of Academic Journal Guide (ABS) 2015: 27 Accounting journals, 17 General Management and Employment Study journals and 4 Strategy journals. This ensured an academic quality of these articles and for each subject area we chose amongst some of the 3, 4 and 4* journals. The contributions of research to the field and the lessons learned from these studies are discussed. Knowledge gaps in existing balanced scorecard research are identified, leading to consideration of several ideas for future research.
Keywords
Balanced Scorecard, BSC, Performance Management, Performance Measurement
1. Introduction
The Balanced Scorecard is a strategic management tool that aims to clarify strategy and to translate it into action. It thus aims to contribute to reducing the problems involved in using only financial measures. The Balanced Scorecard was born mainly in response to two major problems: the growing difficulties of companies to translate strategy into action and to link the operational management to the strategy; the proven inability of traditional economic and financial measures in monitoring the companies performance (and this is even more evident when companies are characterized by assets in which the intangible component assumes an important place).While financial measures were in wide use for many years, new frameworks emerged in recent years extend organiza-tional perspectives beyond tradiorganiza-tional financial measures: the Balanced Scorecard is one of the most popular new frameworks that has received considerable attention since Kaplan and Norton’s (1992) [2] first article on this topic. After its introduction in the
How to cite this paper: Hristov, I. and Chirico, A. (2016) The Limits of the Ba-lanced Scorecard. Open Journal of Socia Sciences, 4, 53-58.
http://dx.doi.org/10.4236/jss.2016.411004
early 90s, it has attracted considerable interest among companies in recent years, and he has also generated enormous interest in academic and industrial communities (Bar-nabe & Busco, 2012; Kraus & Lind, 2010; Malina, Norreklit & Selto, 2007, Norreklit, Mitchell, & Bjomenak, 2012; Salterio, 2012) [3] [4] [5] [6] [7]. With the increase in popularity, the BSC has evolved from a simple performance measurement system to a strategic management system (Kaplan & Norton, 2001a) [8]. The BSC has also received much criticism over the years. This includes its a-theoretical approach and its detach-ment from accounting numbers. These criticisms indicate that the application of the BSC might not be as easy as Kaplan and Norton postulate, thereby giving us another good reason to survey the literature for evidence from the field.
Our goal is to expand upon these previous reviews and to provide a basis for in- depth study on the limits of the balanced scorecard. Only limited systematic research has been done on BSC limits. First of all we selected studies related to the balanced sco-recard published in Accounting, General Management and Strategy journals. In the second step, papers are analysed to see if show limits about BSC. Then we identify only the paper that highlights the limits related to the BSC. In the final section, we present our conclusion and discuss how to analyze papers. Finally we identify research gaps and suggest further ideas for future research.
2. Methodology
2.1. Systematic Literature Review
According to Tranfield et al. (2003) [1] we are tackling the topic through a systematic review of the literature. (Denyer & Tranfield, 2009; Lueg & Schäffer, 2010; Rousseau, Manning, & Denyer, 2008; Tranfield, Denyer, & Smart, 2003) [1] [9] [10] [11]. Syste-matic reviews differ from traditional narrative reviews by adopting a replicable, scien-tific and transparent process. In other words a detailed technology, that aims to mi-nimize bias through exhaustive literature searches of published and unpublished stu-dies and by providing an audit trail of the reviewers decisions, procedures and conclu-sions (Cook, Mulrow and Haynes, 1997) [12]. First of all, we can find the answer in the understanding of the complex meaning of findings and researches when conduct when we write on this kind of topic. The usage of the findings we provide is important for promote research, support practice and contribute to the construction of a solid theory. It provides a strong reference context and legitimizes our research questions.
2.2. The Steps of the Work
In order to obtain a complete and exhaustive review, this work will be realised by en-closing all the main elements that have been the subjects of the main discussions and researches. Our literature search comprised three steps: areas chosen for the source, choice of electronic sources, literature search procedure.
2.3. Areas Chosen
ranked by Academic Journal Guide-2015 (ABS), thanks to its outstanding, reliability and appreciation in the European scientific community. For each subject area we en-sured an academic quality and only considered journals that were ranked with 3 and 4 stars on the ranking of the Association of Business Schools. The choice was guided by a panel of expert on the field. This criterion afforded also a selection which aimed at conducting our study through leading sources and, at the same time, at being not strictly bounded to a very limited number of journals. Eventually, we countervailed the good level of quality of the sources selected, with a comfortable but quite heterogeneous set of information to be handled.
2.4. Choice of Sources
First of all it is suitable to explain the usefulness of the main databases that we used to find all the articles concerning our topic and, if they were not exhaustive we went on Google to find more in order to have a greater range of choice. The main important sources considered were: ScienceDirect, AAA (the digital library), Wiley online Library, Taylor and Francis online, Springer Link, Cambridge Journal, Oxford Journal, Emerald Insight, American Economic Association and Land Economics. There are bibliographic databases containing a broad range of full text, abstracts and citations designed for re-search and academic journal articles. In some cases no sources were founded.
3. Literature Search Procedure
In this work we reviewed articles published in 48 journals, in 3 different subject area of Academic Journal Guide (ABS)-2015: 27 Accounting journals, 17 General Management and Employment Study journals and 4 Strategy journals. The focus of our review was on publications that explicitly concentrated on the balanced scorecard. Our literature search began using the terms “Balanced Scorecard, “BSC”, “Performance Management” and “Performance Measurement” and was based on articles published by an individual journal and available on its web homepage. We entered the above exposed keywords in the search bar and we set the filters. We applied some subjective criteria in our selection of journal. After putting the keywords on the search bar, the output of the search had an further step, which was that of select all the journal that contained in Title, Abstract or Keywords the following words: “Balanced Scorecard’’ ‘’BSC’’ and “Scorecard”. This yielded 122 articles. We focus on the 122papers selected in order to identify only the paper facing the limits of BSC.
Limit Definition
effec-tive or useful” allowed me to select the articles in which this negaeffec-tive connotation was present with its shades (weaknesses, failure, limitation…) defined and delimited the borders met by the balanced scorecard. This is the criterion for inclusion paper in the sample. Then we selected only the paper that highlight the limits connected to the BSC. We got 69 papers and only those papers are the subject of our analysis.
4. Findings Review
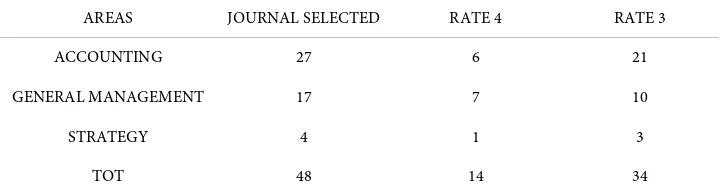
In the following, we categorize the findings of the identified articles according to our framework. We examined 5625 papers, limited to title, abstract and keywords. This yelded 122 articles. We focused on the 122 papers selected in order to identify only the paper facing the limits of BSC. We analyzed 48 journals, 14 four stars and 34 three stars. Table 1 summarizes these results.
The area with the highest number of selected papers is ACCOUNTING, which has contributed with 97 papers, in percentage terms 2.75 compared to the total of found paper, General Management has contributed with 10 papers and finally Strategy which has contributed with 15 papers. Table 2 highlights areas frequency distribution.
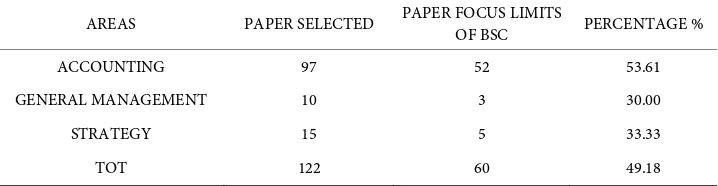
In the second step, papers are analysed to see if they show limits about BSC. We se-lected only papers that highlight the limits connected to the BSC. We got 60 papers and only those papers are the subject of our analysis. The criterion that allowed the inclusion of papers in the sample is the definition of limits generating the inclusion area. These were physically analysed to understand if to highlight the limits of the scorecard, and then selected. The analysis procedure was as follows: title, keywords, abstract, conclusion, in-troduction and in the end reading individual paragraphs. At the end of this phase 60 pa-pers were included in the sample. Table 3 highlights limits frequency distribution.
Table 1.Data on Subject Areas (ABS Academic Journal Guide 2015).
AREAS JOURNAL SELECTED RATE 4 RATE 3
ACCOUNTING 27 6 21
GENERAL MANAGEMENT 17 7 10
STRATEGY 4 1 3
[image:4.595.193.554.474.572.2]TOT 48 14 34
Table 2. Areas frequency distribution.
AREAS PAPER FOUND PAPER SELECTED PERCENTAGE %
ACCOUNTING 3533 97 2.75
GENERAL MANAGEMENT 1442 10 6.73
STRATEGY 650 15 14.92
Table 3. Limits frequency distribution.
AREAS PAPER SELECTED PAPER FOCUS LIMITS OF BSC PERCENTAGE %
ACCOUNTING 97 52 53.61
GENERAL MANAGEMENT 10 3 30.00
STRATEGY 15 5 33.33
TOT 122 60 49.18
5. Conclusions and Discussion
The need for a comprehensive view of performance management has been widely dis- cussed in the popular and scholastic press. Results provide a basis for further research for eliminating or reducing the existing gaps in performance management. The goal is to understand what are the causes that may lead to performance management tools failures and therefore the implication of such a failure on the systemic management of business performance. This through evidence on BSC, as a systematic management tool of business performance. It will be interesting to analyze papers to investigate about limits and to categorize them. The analysis could be carried out through Nvivo soft-ware, qualitative data analysis. After the collection of qualitative data, empirical evi-dence show us that it is possible to evaluate and clarify the main causes that lead to the failure of the balanced scorecard. I am also interested in measuring impact of that fail-ure on company performance. The most frequent negative phenomenon are: exclusive focus on direct and programmed effects, time-related inconsistency of assessments, neglected trade-off, failure risk assessment and strong attention to the company’s value in the company owned by financial investors. Atkinson, Waterhouse and Wells note that the Balanced Scorecard model was incomplete because it fails to: (1) adequately highlight the contributions that employees and suppliers make to help the company achieve its objectives, (2) identify the role of the community in defining the environ-ment within which the company works, and (3) identify performance measures to as-sess stakeholders’ contributions. Smith noted that The Balanced Scorecard fails to ac-count for the role of “motivated employees”, a critical issue specially in the service sec-tor. Finally, while the Balanced Scorecard framework provides constructs for multiple measures and overcoming the limitations of single measures, there is no clear provision for very long-term measures; the distinction between means and ends is not well de-fined and the model probably needs additional empirical validation. Altogether, these reasons show what is the range of measurement dysfunction and weaknesses perfor-mance effects caused by non-holistic perforperfor-mance.
searched. Moreover this study focuses exclusively on balanced scorecard. It would be also appropriate to apply this approach to other performance management tools to un-derstand the relationship between performance management failure and business per-formance. Future research might use alternative tools to validate our results.
Acknowledgements
The authors gratefully acknowledge the research supports received from Department of Management and Law, University of Roma Tor Vergata, Italy.
References
[1] Tranfield, D., Denyer, D. and Smart, P. (2003) Towards a Methodology for Developing Evidence: Informed Management Knowledge by Means of Systematic Review. British Jour-nal of Management, 14, 207-222. http://dx.doi.org/10.1111/1467-8551.00375
[2] Kaplan, R. and Norton, D. (1992) The Balanced Scorecard—Measures That Drive Perfor-mance. Harvard Business Review, 79.
[3] Barnabe, F. and Busco, C. (2012) The Causal Relationships between Performance Drivers and Outcomes: Reinforcing Balanced Scorecards’ Implementation through System Dynam-ics Models. Journal of Accounting & Organizational Change, 8, 528-538.
http://dx.doi.org/10.1108/18325911211273518
[4] Kraus, K. and Lind, J. (2010) The Impact of the Corporate Balanced Scorecard on Corpo-rate control—A Research Note. Management Accounting Research, 21, 265-277.
http://dx.doi.org/10.1016/j.mar.2010.08.001
[5] Malina, M.A., Norreklit, H.S.O. and Selto, F.H. (2007) Relations among Measures, Climate Control, and Performance Measurement Models. Contemporary Accounting Research, 24, 935-982. http://dx.doi.org/10.1506/car.24.3.10
[6] Norreklit, H., Norreklit, L., Mitchell, F. and Bjomenak, T. (2012) The Rise of the Balanced Scorecard! Relevance Gained? Journal of Accounting & Organizational Change, 8, 490-510. http://dx.doi.org/10.1108/18325911211273491
[7] Salterio, S. (2012) Balancing the Scorecard through Academic Accounting Research: Op-portunity Lost? Journal of Accounting & Organizational Change, 8, 458-476.
http://dx.doi.org/10.1108/18325911211273473 [8] Kaplan & Norton, 2001a.
[9] Denyer, D. and Tranfield, D. (2009) Producing a Systematic Review. In: Buchanan; D. and Bryman, A., Eds., The Sage Handbook of Organizational Research Methods, Sage, London, 671-689.
[10] Lueg, R. and Schäffer, U. (2010) Assessing Empirical Research on Value-Based Manage-ment: Guidelines for Improved Hypothesis Testing. Journal für Betriebswirtschaft, 60, 1-47. http://dx.doi.org/10.1506/car.24.3.10
[11] Rousseau, D.M., Manning, J. and Denyer, D. (2008) Evidence in Management and Organi-zational Science: Assembling the Field’s Full Weight of Scientific knowledge through Syn-theses. Academy of Management Annals, 2, 475-515.
Submit or recommend next manuscript to SCIRP and we will provide best service for you:
Accepting pre-submission inquiries through Email, Facebook, LinkedIn, Twitter, etc. A wide selection of journals (inclusive of 9 subjects, more than 200 journals)
Providing 24-hour high-quality service User-friendly online submission system Fair and swift peer-review system
Efficient typesetting and proofreading procedure
Display of the result of downloads and visits, as well as the number of cited articles Maximum dissemination of your research work