Munich Personal RePEc Archive
Application of various count models:
Sahiwal demand from Naivasha
Mailu, Stephen and Lukibisi, Barasa and Waithaka, Michael
Kenya Agricultural Research Institute
20 May 2011
Online at
https://mpra.ub.uni-muenchen.de/32074/
Applicat ion of various count
models: Sahiw al demand from
Naivasha
M ailu S.K.
Kenya Agricult ural Research Inst it ut e Nat ional Anim al Husbandry Research Cent re
P.O. Box 25, 20117 Naivasha, KENYA em ail: km ailu@gm ail.com
1
Lukibisi F.B.
Kenya Agricult ural Research Inst it ut e Nat ional Anim al Husbandry Research Cent re P.O. Box 25, 20117 Naivasha, KENYA
Wait haka M .
P.O. Box, 45 Gat ukuyu, KENYA em ail: m iw aw [email protected]
1 The surviving authors, dedicate this paper to the memory of our friend and colleague, Mr. F.B. Lukibisi who passed away before the
Abstract:
Sahiwal bulls have been bred at the National Sahiwal Stud (NSS) in Naivasha since the late 1960s. The breed is credited for its ability to withstand conditions which other introduced cattle breeds find it difficult, especially those in the ASALs. The sahiwal will produce milk with little supplementation and can let down milk without calf on foot. Farmers interested in acquiring this germplasm to upgrade their local cattle do so either through use of AI with semen from CAIS or alternatively purchase live breeding stock directly from the NSS or other breeding farms. Over the years, this demand for the latter has been recorded through written requests to the farm management for bulls. Recently however, the NSS management has raised concern over its inability to service all the requests for breeding stock. A total of 802 letters were isolated from archived records which represented requests for a total of 5,531 animals from the NSS yielding a rough estimate of 6-7 animals per request where majority of the requests (42%) were for 1-2 animals and an additional 20% are composed of requests for between 3-5 animals. Graphical examination of count of requests for breeding stock for 1971-2007 shows a possible decline in these requests, which is at variance with what management is experiencing. We hypothesize that since the mobile phone boom starting in the early 2000s, demand may have been expressed differently rather than in written form. It would also be expected that as milk prices improve, farmers would increase their demand for breeding stock and conversely, as prices for the animals rise, their demand would decline. Rainfall improves pasture availability and we also hypothesize that this way, farmers are encouraged to increase their stock.
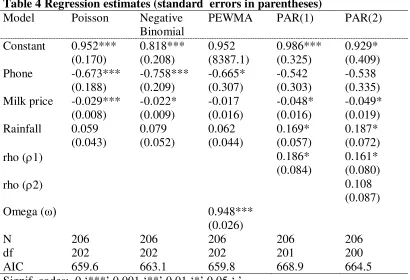
To explore these issues more systematically, we fit these monthly count data to Poisson Exponentially Weighted Moving Average (PEWMA), Poisson Autoregressive PAR(p) and poisson models with phone use, milk prices and rainfall as explanatory variables. These models are implemented in R and we use data for the period November 1990 to December 2007. In these models, we use real prices and the price of milk is used in place of the price for breeding animals. We do this for two reasons (i) to avoid multicollinearity since there is a high (+0.98) correlation between sahiwal prices and the price of milk and (ii) we believe that since breeding animals are acquired by farmers to upgrade their local cattle to produce more milk, the price of milk provides more information about the decision to invest in a breeding animal. We begin by examining the ACF plot to identify the presence of dynamics in the data. In addition, zero inflation is negligible and the zero inflation versions of these models are not necessary. The chi-square statistic used to compare the PAR(1) and PAR(2) is not large enough to reject the PAR(1) over the latter. Further, results show that phone use and prices led to reduced number written of requests for sahiwal animals while the contribution of rainfall is positive. The PAR(p) short run multipliers for phone use are computed as -0.77 and -0.67 for the PAR(1) and PAR(2) respectively while the long run multipliers are -0.95 and -0.91. We conclude that phone use may have changed the way demand for breeding animals is expressed.
Introduction:
The Sahiwal was introduced into Kenya in 1939 and the National Sahiwal Stud (NSS) set up in 1963 to develop the breed for use as a dualpurpose animal (beef and milk) suitable for the semi-arid environments of Kenya and to develop appropriate management systems for the breed (Mpofu et.al., 2002). The breed was imported from Pakistan and India. The breeding stock, mainly from bulls were imported, maintained and used for upgrading zebu cattle at thirteen livestock improvement centres and by 1962, there were 2,500 sahiwal cattle in the thirteen livestock improvement centres (Muhuyi, Lokwaleput and Sinkeet, 1999). After 1945, 60 Sahiwal bulls and 10 Sahiwal cows were imported from Pakistan with another importation in 1964 from India. The latest ‘importation’ in 1991 comprised of 1,000 doses of semen from six proven Sahiwal bulls from Pakistan. Following the Swynnerton plan of 1954, commercial dairy production was opened up to indigenous people and part of the idea was to introduce high milk producing breeds and as a result, smallholder herds in medium potential areas were upgraded with the Sahiwal while European breeds such as the Fresian were used in high potential areas (Ngigi 2005).
At the NSS, young bulls averaging 9-24 months are weighed monthly up to 24 months after which they are selected for progeny testing on the basis of an index computed from the breeding values of the sire, dam and growth rate of the young bull. Out of 75 bulls from the elite herd, 15 bulls are selected to form a team for progeny testing. Semen is collected and stored at the Central Artificial Insemination Service (CAIS). Bulls are further selected for semen quality and the results used to choose about 10 bulls for progeny testing. Bulls over 24 months are maintained for 6-7 years when progeny test results are available and from the ten bulls, the best two in terms of milk production from their daughters are selected and eventually relocated to CAIS for semen production. Semen from proven Sahiwal bulls is sold locally and surplus exported.
Among traits considered important by breeders include milk production per lactation, reproductive efficiency, growth potential, adaptability, udder conformation and temperament which are traits that the Sahiwal is credited for (Muhuyi et.al., 1999). Discussions with pastoralists in Kajiado report substantial tradeoffs between local cattle (zebu) and exotic breeds e.g. Sahiwal which are comparatively less resistant to drought, travel shorter distances, require more forage and can be more susceptible to disease while being more expensive to purchase and these tradeoffs are well understood by the pastoral farmers (Boone et.al., 2006). The Pastoral production system in Kenya occupies 62% of the country with agro-pastoral taking up 20.5% and mixed systems taking up most of the remainder (Cecci et.al., 2009). The animal is docile and has been bred for milking without calf at foot. The Sahiwal in Kenya is capable of producing 1,368 kg per lactation of 282 days (Ilatsia et. al 2007) and up to 1700kg by the fourth lactation. Other estimates indicate anything between 972 to 2490kg depending on management or an average of 1,574 with a lactation length of 293 days. In Pakistan, estimates of around 1,142 kg in a 305 day lactation (Khan et.al., 2008) are reported. It has a shorter calving interval than the Boran (Trial
et.al., 1981). The breed registered a 0.3%2 genetic progress in milk yield (Mpofu et.al 2002) against the expected 3-4% (Meyn et.al., 1974) and the NSS reported a 13% annual decline in annual milk yield between 1967 and 1987 (Mpofu et.al., 2002). The latter may be due to the withdrawal of supplementary feeding in later years, an attempt to mimic as closely as possible the production environment faced by stock keepers utilizing marginal lands. Pure Sahiwal animals can be found in Rift Valley and Central provinces under a semi-zero grazing system reared mainly by middle to high income households (Gamba, 2006).
The NSS is currently composed of 1,200 plus heads of different sex and ages. The supply of Sahiwal to farmers is supplemented by private farms3, most of which are in the Rift Valley. Breeding material is disseminated through the sale of live stock by the NSS at Naivasha and also through artificial insemination by the Central Artificial Insemination Station at Kabete. The Sahiwal breed has been the Bos indicus breed most frequently used in dairy crossbreeding in Kenya. Between 1970 and 2007, out of a total 18,500 records at the NSS, over 6,498 heads have been sold to farmers in order for them to upgrade their local herds. The breed has somewhat
2 Through selective breeding, a genetic gain from a base of 1,300kg in 1963.
3 The major breeding ranches in Kenya have included El Karama Ranch, Kilifi plantations, Cerdavale, Deloraine and Illkerin Project
been popular with stock keepers mainly from the marginal areas where some breeds e.g. Fresians find it difficult to survive. These include districts such as Kajiado, Narok and Transmara. A study among traders in Kajiado revealed that about 6% of the animals offered in these markets were pure sahiwal while pure zebu were 51% (Scarpa, et.al., 2003). Crosses between the zebu with Sahiwal and Boran were 20% and 13% respectively implying preference for Sahiwal than Boran. The markets in question supply approximately 30% of beef cattle slaughtered in Nairobi (Muthee, 2006) although significant traffic is reported with animals coming from across the Tanzanian border, with much of this trade going unrecorded (EAC 2002, Aklilu, 2002) making precise figures unavailable. In 2000, 12% and 8% of households in Kitengela, reported owning pure Sahiwal bulls and cows respectively while indigenous/sahiwal bull and cow crosses were reported in 30% and 26% of the households (Kristjanson et.al., 2002). Many of the farmers reported in these studies have in great likelihood sourced their Sahiwal breeding stock from the NSS which holds one of (if not) the largest herds of pure Sahiwal in the world. In addition, all Sahiwal bulls held at CAIS for the production of semen have been bred from the NSS. Since the utilization of AI is still generally low—even for the Central Highlands noted for its lead in dairy production—Bebe et.al., (2004), whereas in the late 1990s, AI use was estimated at about 20% (Omiti 2002) while other estimates put it at 52% among smallholder farmers, it is likely that preference for natural bull service even for the Sahiwal will prevail at least in the short term. Gamba (2006) puts the prevalence of bull service at 70%. In fact, the slow growth of the dairy sector in Malawi, Zambia, Tanzania and Zimbabwe is partly explained by failure or unavailability of AI services. Artificial Insemination has been in use in Kenya for several decades being the first country in East Africa to use the technique in 1946. In 1986 there was a major policy change, which introduced cost sharing in A.I service provision that were hitherto subsidized through KNAIS. This set the framework for privatization of A.I services with Dairy co-operative societies, A.I self-help Groups, Private Veterinarians and Private Inseminators providing the services. The performance of KNAIS continued to decline even further and by 1992 the number of inseminations had dropped to 200,000 from 548,000 in 1979. However by 2008, semen distribution was around 550,000 doses from roughly 200,000 in 1999. At the moment, Kenyan imports of bovine semen are estimated to be growing at 11% annually with the US sharing 73% of this market dominated by 5 suppliers viz American Breeders Service (ABS), Worldwide Sires Ltd., Cooperative Resource International (CRI), Alpha Genetics, and Sierra Besert Breeders Ltd valued at US$1.6 million (Kamau et.al., 2008)4. Local semen (20%) is provided by the Kenya National Artificial Insemination Services (KNAIS5) and is perceived by farmers to have a high failure rate. Sahiwal semen price ranges between 70 and 90 KES at CAIS. Currently, CAIS holds 4 Sahiwal bulls from which they sell (~80%) to private A.I service providers who include private veterinarians, private inseminators, A.I self-help groups, and Dairy Co-operative societies, private and institutional farms and has about 30 agents spread out in mainly dairy producing areas of the country. Breeding services account for just under 2% of the total cost of milk at the farmgate with feeding accounting for over 50% (Land ‘O Lakes 2008). Despite this, AI use is still generally low and even for the Central Highlands noted for its lead in dairy production, and was estimated at about 37% with the rest using bull service (Bebe et.al., 2004)6. Yet, AI is credited to have led to the development of the country’s dairy herd. However, 54% of households prefer AI and its low use (actual use) is attributed to constraints of low availability and perceived high costs7. Others are put off by increasing vulnerability to disease with exotic blood, failures to conceive under AI deriving from a combination of short oestrus of zebu cows and the unreliability of motorized runs.
This paper examines the requests (henceforth reported as ‘demand’) for Sahiwal breeding stock from KARI-NSS since the 1970s to present. The interest is occasioned by the observation that written requests for these stock (here which we use as a proxy for demand) has been falling over the recent past as far as the available data shows. We hypothesize that since mobile phone use has grown over the last decade, demand then might
4 UN Statistical data however reports a value of no more than US$200,000.
5 Formed 1966 for the purpose of expanding the coverage of A.I service provision in the country to meet the increasing demand 6 Others estimate usage of bull service at 81% in Kirinyaga, Molo and Rachuonyo Districts where 63% of these actually choose the
bull to serve (Baltenweck et.al., 2004)
7 Ouma et.al. in Narok report non use of AI as attributed to its unavailability. In a recent milk shed assessment, farmers from Kericho,
have began to be revealed through the use of these phones8. We begin by describing our data and sources in the next chapter and then the next is devoted at a short description of our estimation procedures. A short discussion is attempted in the last chapter.
Materials and Methods
Data is assembled from the records archived at KARI-National Animal Husbandry Research Centre, Naivasha. Records are in the form of letters written to the NSS from different farms over the period 1971-2007. These letters addressed to the NSS contain the details such as address of the author requesting for Sahiwal breeding animals as well as a date of the letter. The records were tabulated noting the dates when these requests were made as well as the number of breeding animals requested for, while also noting, where indicated, the proximate location of the requesting farmer and the sex of animal required. Some of the requests also contain requests for animals from butchers and other farmers who required steers for fattening. These records were thus sorted and requests for animals for any other purpose other than for breeding purposes purged from the resulting dataset. In the end, a total of 802 usable individual requests were retrieved from these records from a total 184 different addresses between 1971 and 2007. Several years of data are however unavailable9. Resulting data were assembled in a worksheet and monthly totals summed up. These monthly totals of letters represent the dependent variable which we henceforth use as our measure of demand. Phone use in Kenya especially mobile phones can be used to make enquiries about availability of breeding stock. We likewise assemble monthly rainfall data for the period for the period. This is so since rainfall is a good predictor of standing biomass (Coe
et.al., 1976, East 1984, Rasmussen et.al, 2006, Caro, et.al., 2007), and it is used here to account for above ground primary production and thus, when pasture is expected to be abundant and therefore changes in standing biomass. This relationship has been found to be significant especially in areas with rainfall of less than 700mm (Coe et.al., 1976).
Prices
The market for sahiwals from the NSS had up until the 1980s and possibly 1990s been subsidized. For instance in the 1970s, prices to farmers were graduated according to whether the farm was an advanced ranch or whether they were small scale farms. The latter normally received some price cut for animals bought at the NSS. On occasion too, sales were implemented in some years through bull auctions and sales would occur once the quote was above the reservation price—set centrally in Nairobi—but sales at present are on a first come first served basis though still subject to price floors. Milk prices (1971-1990) are traced from FAOSTAT while other sets of price information are sourced from available literature. Beef prices on the other are sourced from FAOSTAT, and when data on beef prices in Kenya are unavailable from FAOSTAT, prices of other meats are used to derive surrogate producer prices for beef. For instance, game meat price on average is 0.78 times that of beef between 1991-2007. Assuming that the series is stationary, this figure is then used to estimate the producer price of beef for the years 1971-1990 since this was missing from FAOSTAT. The price for milk is similarly taken from FAOSTAT and where missing, prices from available records extracted. Milk prices rose from less than 1shilling per litre in the 1970s to 20 shillings in the 2000s. It is also important to keep in mind that several changes have been witnessed in the dairy industry with a liberalized milk market starting in the 1990s. However, there has been a stagnation in productivity, at an annual average of around 1,265 litres per dairy cow a year, translating into 0.6% year-on-year productivity growth despite the fact that the market is open and farmers now enjoy better prices (Nyariki, 2009; see also Ngigi 200510). Generally however, these milk prices are used in the estimation and some of the summary statistics are shown on the table below. Due to the collinearity between these prices, we drop the price of beef as well as the price of breeding animals from the regressions. We use the Consumer Price Index to arrive at real prices for milk.
8 In certain countries, expansion of cellular phone networks has greatly improved basic communications, making it possible for one
actor to inquire about prices before deciding to go to the market (Gruère et.al., 2006)
9 These are in reference to the periods December, 1978 – June, 1983 and January 1989 - September 1990 since the files were
misplaced from the archives.
Table 1: Price indices for milk, beef and breeding animals
Item N Mean Std dev Min Max
1970s
Milk price/lt 318 1.001 0.247 0.69 1.32
Beef/kg 318 6.708 1.781 4.365 9.186
Bulls/head 318 1,706.6 550.182 1000 2500
Heifers/head 318 1130 309.829 700 1500
1980s
Milk price/lt 149 2.997 0.35 2.4 3.25
Beef/kg 149 24.188 2.459 18.915 26.93
Bulls/head 141 5031 435.942 4500 5500
Heifers/head 141 3411.35 191.644 3000 3500
1990s
Milk price/lt 262 10.706 4.219 4.35 17.50
Beef/kg 262 60.574 21.517 31.172 106.767
Bulls/head 260 18705.77 12231.4 6500 40000
Heifers/head 220 13450 8319.11 5000 25000
2000s
Milk price/lt 73 16.595 2.223 12.5 20.00
Beef/kg 73 126.5 24.496 81.838 150.00
Bulls/head 33 45909.09 7442.96 40000 55000
Heifers/head 6 25000 0 25000 25000
Time to Naivasha and production systems
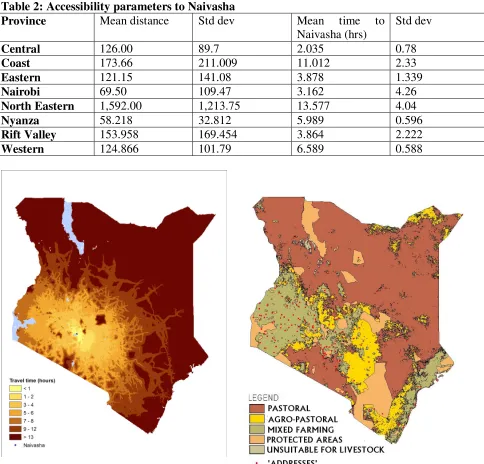
Distances to markets are important and more accessible markets offer non-financial incentives for potential buyers to visit. The NSS located in Naivasha is a source of Sahiwal breeding stock and its accessibility is as variable as there are as many possible locations of potential customers in the country. Rather than use physical distance to Naivasha from the several addresses, an algorithm (Pozzi and Robinson 2008) is used to transform data on road surfaces and slopes to an accessibility map for Kenya (The code was initially used to prepare maps of accessibility to markets within the IGAD region but recalibrated to calculate accessibility to Naivasha from all possible locations within the country. Addresses therefore were georeferenced and an algorithm used to estimate the shortest path to Naivasha from these addresses (details of similar procedure contained in Pozzi and Robinson (2008). Therefore, from all addresses, the average time taken to travel to Naivasha would be 4.78 hours with a standard deviation of 3.24. The resulting accessibility surface is shown on figure (x) below showing the travel times from all 1x1km grids in the country to Naivasha and on table x below11. Essentially, the readings for these addresses are not the exact/observed locations but estimations of their location on the map. However, for a general analysis like this one involving large spatial distribution, it is likely that errors in location are not serious enough to invalidate use of the results. However, the assumption made is that all these locations within the Province are well dispersed such as to give a general impression of the relative distance to Naivasha. For instance, it would take longer (>10 hrs) for one to move from North Eastern and Coast province to Naivasha than one traveling say from Central. To convert these addresses into a meaningful measure about the state of the demand centre, there are several ways to proceed. Cecci et.al, (2009) use logistic regression models to map out the geographic distribution of livestock production systems in the IGAD region. These systems include mixed farming, agro-pastoral and pastoral systems. The results show that in Kenya, pastoral systems cover 61% of the entire landmass and 20.5% of the country is comprised of agro-pastoral groups with the remainder being mixed-farming. The correspondence between livelihood based maps and environmental based indicators (human population density, land cover, length of growing period, temperature and irrigation) in classifying livestock production systems then gives us confidence in the use of these maps to categorize these demand centres (addresses) appropriately. The maps produced from the Cecci et.al., (2009) work are therefore
11 The execution of the routines to produce the map and accessibility parameters by Francisca Pozzi and the assistance of Tim
used to extract this classification information. Using GIS applications, the geo-referenced addresses are then superimposed on the map (figure 1b) and the production system where the address occurs is used as one of the variables in the analysis.
Table 2: Accessibility parameters to Naivasha
Province Mean distance Std dev Mean time to Naivasha (hrs)
Std dev
Central 126.00 89.7 2.035 0.78
Coast 173.66 211.009 11.012 2.33
Eastern 121.15 141.08 3.878 1.339
Nairobi 69.50 109.47 3.162 4.26
North Eastern 1,592.00 1,213.75 13.577 4.04
Nyanza 58.218 32.812 5.989 0.596
Rift Valley 153.958 169.454 3.864 2.222
Western 124.866 101.79 6.589 0.588
Figure 1a: Travel time to Naivasha (hrs) 1b: distribution of addresses and production systems
Results and Discussion
From the 802 requests, 5,531 animals were requested from the NSS yielding a rough estimate of 6-7 animals per request. Many of the requests however (42%) are for 1-2 animals and an additional 20% are composed of requests for between 3-5 and 13% for requests for 6-10 animals. The data shows that of these animals, 2,460 were bulls, 2,064 pure Sahiwal heifers/cows, 356 sahiwal heifer crosses, 604 steers and 47 Sahiwal male crosses. This represents on average, 5 bulls, 10 cows, 4 crosses, 16 steers and 4 male crosses per request12. Looking at the number of requests for specific categories, the data shows that 459 of the requests were for pure bred bulls and 199 of these were for cows. On the other hand, 82 of these requests were for heifer crosses, 37
12 This is in reference to all requests where the sum of counts is divided by f (where f = frequency of requests where the category was
for steers with 11 of these requesting for male crosses. At least 89 (11%) of all the requests were for a combination of either of the categories above. On average, the number of bulls requested were 3.25 and a standard deviation of 8.37. For heifers, heifer crosses, steers and bull crosses, the means were 2.6, 0.44, 0.75 and 0.06 respectively with the standard deviations 10.3, 2.54, 5.47 and 0.66 respectively. Of the entire requests, majority of these (42%) were requests two or less animals while about 10% of these did not indicate the number of animals requested for.
Figure 2: ‘Number of requests’, rainfall and milk prices; 1990-2007
Regression models
The basic foundation of most count data models is the Poisson distribution (Cameron and Trivedi, 1998). The Poisson regression is a member of a class of generalized linear models, an extension of classical linear models but allows the mean of a population to depend on a linear predictor through a nonlinear link function allowing the response probability distribution to be any member of an exponentional family of distributions (McCullagh and Nelder 1989). In the Poisson model, the mean rate of occurrence of events per unit of time is i and the
probability distribution of the number of events observed per unit of time then will be
P(yi) = Prob[yi = j] = exp(-i) i j
/
j!, j = 0,1,... where Var[yi|xi] = λi.The Poisson distribution has conditional mean function E[yi] = i. The regression model is produced by
specificying i to depend upon a set of covariates x. In many count data studies, cross sectional data is used and
Poisson and negative binomial models, even when the latter include lagged dependent regressors. State space models for autocorrelation with count data have also been suggested (Xu et.al., 2007).
For count data such as ours (the number of requests in a given month), the specification E[y|x] = x0β is inadequate as it permits negative values of E[y|x] and for similar reasons the linear probability model is inadequate for binary data (Cameron and Trivedi, 1998). For count data such as these which are not normally distributed (see figure 3), the Poisson with the parameter mu (λ) which is the mean number of occurrences is an adequate place to begin. However, it is often criticized for its restrictive assumption of equi-dispersion, meaning equality between the variance and the mean and in real-life applications, count data often exhibits over-dispersion. Table 3 shows these statistics and the data has a mean which is less than the variance. The present data already exhibits this quality of overdispersion. A Poisson regression then under conditions of overdispersion will have similar consequences of heteroskedasticity as in the linear regression leading to deflated standard errors of parameter estimates and therefore inflated t-statistics (Cameron and Trivedi 1998, Liu and Cela 2008). For time series count data on the other hand, Brandt et.al., (2000) show that the Poisson exponentially weighted moving average model (PEWMA) corresponding to an MA(1) process, performs better than do Poisson and Negative Binomial models, even when the latter include lagged dependent regressors. Moreover, (Stochastic Autoregressive Mean) SAM and the (Autoregressive Condition Poisson) ACP models provide similar results (Jung et.al., 2005) and the latter has been implemented in forecasting stock market price volatility (Heineny 2003). Brandt et.al, (2001) have similarly developed code (in R) which estimates these models (It is the same code we use to estimate the models reported in this paper). The PEWMA model has significant advantages over standard event count models for persistent time series of counts. PEWMA however is not suitable for cyclical and short-memoried processes that are mean reverting and Brandt et.al. (2001) have developed a Poisson Autoregressive Model PAR(p) which they use to model stationary, mean reverting event count process an approach which we apply to our data which is summarized on table 3 below.
We fit these monthly count data to Poisson Exponentially Weighted Moving Average (PEWMA), Poisson Autoregressive PAR(p) and poisson models with phone use, milk prices and rainfall as explanatory variables. These models are implemented in R and we use data for the period November 1990 to December 2007. In these models, we use real prices and the price of milk is used in place of the price for breeding animals. We do this for two reasons (i) to avoid multicollinearity since there is a high (+0.98) correlation between sahiwal prices and the price of milk and (ii) we believe that since breeding animals are acquired by farmers to upgrade their local cattle to produce more milk, the price of milk provides more information about the decision to invest in a breeding animal. In implementing the code, we drop the production zone dummies since they present some multicollinearity problems.
Table 3: Descriptive statistics
Dataset Minimum Maximum Median Mode Mean Variance
Requests 0 9 1 0 1.626 2.947
Milk price 1.231 45.376 16.695 1.558 18.414 134.266 Monthly Rainfall (mm) 0 201.9 32.9 0 46.991 1984.951
We then examine the ACF and PACF which show that the process is an AR type process with significant memory (Figure 4). We therefore employ PESTS code implemented in R as used in Brandt et.al. (2000, 2001) and the results are displayed in table 4 below.
[image:11.612.33.443.457.737.2]Figure 4: Autocorrelation (A) and Partial Autocorrelation Plot for the ‘number of requests’
Table 4 Regression estimates (standard errors in parentheses)
Model Poisson Negative Binomial
PEWMA PAR(1) PAR(2)
Constant 0.952*** (0.170) 0.818*** (0.208) 0.952 (8387.1) 0.986*** (0.325) 0.929* (0.409) Phone -0.673***
(0.188) -0.758*** (0.209) -0.665* (0.307) -0.542 (0.303) -0.538 (0.335) Milk price -0.029***
(0.008) -0.022* (0.009) -0.017 (0.016) -0.048* (0.016) -0.049* (0.019) Rainfall 0.059
(0.043) 0.079 (0.052) 0.062 (0.044) 0.169* (0.057) 0.187* (0.072)
rho (1) 0.186*
(0.084)
0.161* (0.080)
rho (2) 0.108
(0.087)
Omega (ω) 0.948***
(0.026)
N 206 206 206 206 206
df 202 202 202 201 200
Conclusions
The results show that indeed, number of requests fell during the period when phone use was introduced as the estimated coefficient is negative. The chi-square statistic used to compare the PAR(1) and PAR(2) is not large enough to reject the PAR(1) over the latter. The AIC tends to under-select on lag order in time series models and since the PAR(1) results do not really differ from the PAR(2) and the latter does not produce two significant coefficients, we would prefer the PAR(1) over the PAR(2) which we shall base the rest of the discussion. The PAR(p) short run multipliers for phone use are computed as -0.77 and -0.67 for the PAR(1) and PAR(2) respectively while the long run multipliers are -0.95 and -0.91. The effect of a (positive) one unit change in the phone variable is to decrease the counts by 0.77 over the short term and 0.95 over the long term (or total effect) in the PAR(1). The contribution of rainfall is positive as expected; when pasture is plentiful, more requests might be expected as farmers are able to provide livestock with enough fodder. Short and long run multipliers for the milk price variable are -0.07 and -0.08 respectively. For the constant term, these multipliers are 1.4 and 1.7 respectively.
Acknowledgements:
The records office at KARI-Naivasha especially the provision of access to archived files by Mr. Maoncha is greatly appreciated. We also appreciate the assistance of Associate Professor Patrick Brandt of the University of Texas, Dallas for making available the R code used in this analysis and also in his assistance with the running and interpretation of the analytical result. Any errors are solely the responsibility of the authors.
References
Aklilu Y (2002). An Audit of the Livestock Marketing Status in Kenya, Ethiopia and Sudan (Vol. I), Nairobi, April 2002
Bebe B.O., Thorpe W., Udo H.M.J. and Mulinge W. (2000). Breed preferences and breeding practices in smallholder dairy systems of the central highlands of Kenya. Paper presented at the 7th KARI Biennial Scientific Conference, 13-17 November 2000, KARI Headquarters, Nairobi, Kenya
Boone, R., BurnSilver, S., and Thornton, P., (2006) Optimizing aspects of land use intensification in Southern Kajiado District, Kenya. Final Report to the International Livestock Research Institute, Nairobi, Kenya. Reto-o-Reto Project, DGIC, December 2006. Available at: www.reto-o-reto.org
Brandt P.T. and Williams J.T. (2001) A Linear Poisson Autoregressive Model: the PAR(p). Political Analysis
9(2): 164-184
Brandt P.T., Williams J.T., Fordham B.O. and Pollins B. (2000) Dynamic Modeling for Persistent Event-Count Time Series. American Journal of Political Science, 44(4): 823–843
Cameron, A.C., and Trivedi, P.K. (1998). Regression Analysis of Count Data. NewYork: Cambridge University Press.
Caro T. and Scholte P. (2007) When protection falters. African Journal of Ecology, 45(3):233-253
Cecchi G., Wint W., Shaw A., Marletta A., Mattioli R. and Robinson T. (2009) Geographic distribution and environmental characterization of livestock production systems in Eastern Africa Agriculture, Ecosystems and Environment 135: 98–110
Cecchi G., Wint W., Shaw A., Marletta A., Mattioli R., and Robinson T. (2009) Geographic distribution and environmental characterization of livestock production systems in Eastern Africa Agriculture,
Ecosystems and Environment 135: 98–110
Coe M.J., Cumming D.H and Phillipson J (1976) Biomass and production of large African herbivores in relation to rainfall and primary production. Oecologia 22: 341-354
EAC (2002) Freeing Cross Border Trade of Agricultural Products: Present Trade and Recommendations for Liberalizing Cross Border Trade, EAC Arusha, EAC; GTZ 2002, pp71
East R. (1984) Rainfall, soil nutrient status and biomass of large African savanna mammals. African Journal of Ecology 22(4):245-270
Gruère G., Guiliani A and Smale M (2006) Marketing Underutilized Sepecies for the Benefit of the Poor: A Conceptual Framework, IFPRI EPT Discusion Paper No. 154
Heineny A. (2003) Modelling Time Series Count Data: An Autoregressive Conditional Poisson Model, MPRA Paper No. 8113 Online at http://mpra.ub.uni-muenchen.de/8113/
Illatsia E.D. Muasya T.K., Muhuyi W.B. and Kahi A.K. (2007) Milk production and reproductive performance of Sahiwal cattle in semi-arid Kenya, Tropical Science, 47(3): 120-127
Jung R. Kukuk M. and Liesenfeld R. (2005) Time Series of Count Data: Modelling and Estimation, Economics Department Economics, Christian-Albrechts-Universität Kiel Working Paper No 2005-08
KARI (2007) National Sahiwal Stud Bulletin, February 2007, KARI, National Animal Husbandry Research Centre
Khan M.S., G. Bilal G., Bajwa I.R., Rehman Z. and Ahmad S. (2008) Estimation of Breeding Values of Sahiwal Cattle Using Test Day Milk Yields, Pakistan Vet. J., 2008, 28(3): 131-135.
Kristjanson P., Radeny M., Nkedianye D., Kruska R., Reid R., Gichohi H., Atieno F. and Sanford R. (2002) Valuing alternative land-use options in the Kitengela wildlife dispersal area of Kenya. ILRI Impact Assessment Series 10. A joint ILRI (International Livestock Research Institute)/ACC (African Conservation Centre) Report. ILRI, Nairobi, Kenya. 61 pp.
Meyn K. and Wilkins J.V. (1974) Breeding for milk in Kenya, with particular reference to the Sahiwal Stud, available online http://www.fao.org/
Mpofu N. and Rege J.E.O. (2002) Monitoring of Sahiwal and Friesian cattle genetic improvement programmes in Kenya
Muhuyi WB, Lokwaleput I and Sinkeet SN (1999) Conservation and utilization of the Sahiwal cattle in Kenya. FAO Animal Genetics Research Information 26,35-44.
Muthee A. (2006) Kenya Livestock Sector Study: An Analysis of Pastoralist Livestock Products Market Value Chains and Potential External Markets for Live Animals and Meat, AU-IBAR &NEPDP
Ngigi M. (2005) The Case of Smallholder dairying in Eastern Africa, IFPRI, EPTD Discussion Paper No. 131, Washington D.C.
Nyariki D.M. (2009) Impacts of policy reforms on the livestock industry in Kenya: The case of the dairy sector,
Livestock Research for Rural Development 21 (10) 2009
Omiti J. (2002) Impacts of liberalisation in Kenya's dairy sector : In Rangnekar D. and Thorpe W. (eds). 2002. Smallholder dairy production and marketing— Opportunities and constraints. Proceedings of a South– South workshop held at NDDB, Anand, India, 13–16 March 2001. NDDB (National Dairy Development Board), Anand, India, and ILRI (International Livestock Research Institute), Nairobi, Kenya. 538 pp. Rasmussen H.B., Wittenmyer G and Hamilton-Douglas I. (2006) Predicting time-specific changes in
demographic processes using remote-sensing data. Journal of Applied Ecology 43:366-376
Scarpa R., Ruto E.S.K., Kristjanson P., Radeny M., Drucker A.G. and Rege J.E.O. (2003) “Valuing indigenous cattle breeds in Kenya: An empirical comparison of stated and revealed preference value estimates”,
Ecol. Econ. 45 (3): 409-426
Sileshi G. (2008). The excess-zero problem in soil animal count data and choice of appropriate models for statistical inference Pedobiologia 52:1—17
Sileshi G., Hailu G. and Nyadzi G.I. (2009) Traditional occupancy–abundance models are inadequate for zero-inflated ecological count data, Ecological Modelling 220:1764–1775
Smith P.D., Tyler R.A. and Young E.M. (eds) (1996) Review of Kenyan Agricultural Research, (Vol. 1) Kenya Agricultural Research Institute, CAZS, University of Wales, Gwynned, United Kingdom Tin A. (2008) Modeling Zero-Inflated Count Data with Underdispersion and Overdispersion, Paper 372-2008
SAS Global Forum Statistics and Data Analysis, Research Foundation for Mental Hygiene, New York, NY
Trial J.M.C., and K. E. Gregory (1981) Characterization of the Boran and Sahiwal Breeds of Cattle for Economic Characters Journal of Animal Science 52:1286-1293
Xu S., Jones R.H. and Grunwald G.K. (2007) Analysis of longitudinal count data with Serial Correlation