Munich Personal RePEc Archive
Intergenerational educational mobility in
Turkey
Tansel, Aysit
Middle East technical University, Institute for the Study of Labor
(IZA), Economic Research Forum (ERF)
12 December 2011
Online at
https://mpra.ub.uni-muenchen.de/68435/
1 INTERGENERATIONAL EDUCATIONAL MOBILITY IN TURKEY*
Aysit Tansel
Department of Economics
Middle East Technical University, 06800 Ankara, Turkey
Telephone: 90 312 210 20 57
Fax: 90 312 210 79 57
E-mail: [email protected]
Institute for the Study of Labor (IZA), Bonn, Germany
Economic Research Forum (ERF), Cairo, Egypt
December 12, 2011
Key Words: intergenerational mobility, educational transmission, Turkey JEL Classification: I21, I28, J11, J62
Abstract: This paper aims to provide information on intergenerational educational mobility in Turkey over the last century (at least ovet the last 65 years). This is the first study explicitly on
providing the association between parents’ and children’s education in Turkey over time unlike the previous studies of one point in time. Given the absence of longitudinal data, we make use of a unique data set on educational outcomes based on children recall of parental education. The data used is the result of Adult Education Survey of 2007. Several findings emerge from the analysis. First of all, children’s and parents’ educational outcomes are correlated. The intergenerational educational coefficient of the mothers is somewhat larger than that of the fathers. The intergenerational educational coefficients of both the mothers and the fathers decrease over the cohorts implying that intergenerational educational mobility increased significantly for the younger generations of children in Turkey. The chances of attaining a university degree for the children increases as fathers’ completed schooling level increases.
Men’s chances of attaining high school or university education are substantially higher than that of women’s. The association between parent and child education is stronger when parent educational background is poor. The results imply that the policy makes should focus on children with poor parental educational background and on women.
2 1. INTRODUCTION
Economic and social mobility in any society is a desirable attribute. This is true both from the
point of the individual and of the society. Lack of intergenerational economic and social mobility
in a society should be of concern for at least three reasons. First of all, intergenerational mobility
can be seen as a measure of equality of opportunity. There will be more social integration if
individuals believe that they will succeed through their own efforts and abilities. Recently,
equality of opportunity is a growing concern in both developed and developing countries. Access
to education is an important policy instrument to ensure equality of opportunity. As it is well
known one aim of the free publicly provided education in most societies is to increase equality of
opportunity.
The second argument is on economic efficiency grounds. Lack of intergenerational mobility
leads to economic inefficiency since some individuals’ abilities and skills would be underutilized
or miss-utilized.
The third argument is on overall social welfare grounds. Intergenerational allocation of resources
has implications for the overall social welfare and for poverty and inequality. For these reasons
we need to be concerned about the degree of economic and social mobility between generations.
Intergenerational mobility studies concentrate on how children’s income or education correlates
with the income, occupation or education of their parents. This study deals with the
intergenerational mobility in educational outcomes using educational attainments of parents and
their children. Perfect educational mobility between generations implies that an individual’s
educational outcome is independent of his/her parents’ educational outcome. This will be an indicator of equality of opportunity.
Most studies on intergenerational mobility focus on developed countries. The studies on this
topic in developing countries are limited due to lack of appropriate data sets. Income and
occupational mobility as well as educational mobility are popular topics of study in developed
countries. Educational mobility could be a good proxy for income mobility since income is
3 There is no evidence on the extent of intergenerational mobility in Turkey except the study by
Tansel (2002) which examines one point in time. This is due to the lack of longitudinal data to
analyze income mobility or educational mobility. This paper aims to provide information on
intergenerational educational mobility in Turkey over time which is not addressed previously.
This is the first study about parent-child education transmission over time for Turkey covering a
period of about 65 years. Given the absence of longitudinal data, we make use of a unique data
set on educational outcomes based on children recall of parental education. This analysis
provides both current evidence as well as a long term perspective on the parent-child education
transmission. The study tests whether the impact of parental background on child educational
outcomes have changed over time. The data used is the result of Adult Education Survey of
2007. The survey is conducted by the Turkish Statistical Institute (TURKSTAT). There are
39,478 individuals who provided information about their own education level and that of their
parents.
This study first provides educational transition matrices and several educational mobility
indicators. Next regression analysis is used to estimate correlations between educational
outcomes of children and that of their parents’. Finally, ordered probit models are estimated.
The results show that children’s and parents’ educational outcomes are correlated and that
mothers’ education is somewhat more important than that of the fathers’. Further there is substantial intergenerational educational mobility over time when regression coefficient is used
however the pattern is less clear when correlation coefficient is used. Predicted probabilities of
educational attainment by fathers’ educational background are also presented and discussed.The
chances of attaining a university degree for the children increases as fathers’ completed
schooling level increases. Men’s chances of attaining high school or university education are substantially higher than that of women’s at all levels of the parental educational background. The association between parent and child education is stronger when parent educational
background is poor. The results imply that the policy makes should focus on children with poor
parental educational background and on women.
This paper is organized as follows. Section 2 includes a summary of recent literature. The
4 educational transition matrices and several measures of educational mobility are provided in
Section 4. Section 5 presents the OLS estimates of the intergenerational educational coefficients.
The ordered probit estimates and predicted probabilities are presented in Section 6. Section 7
gives conclusions and policy implications.
2. PREVIOUS LITERATURE
The research on intergenerational educational mobility is voluminous. It has developed on two
strands. The earlier research concentrated on estimating the intergenerational regression and
correlation coefficients and refining their estimation. Recent research focused on isolating the
causal effect of parenral education on the child education. In the examination of the inheritable
persistence in the effects of parents’ education on the children’s schooling recent studies have employed data sets using variation within siblings, within fraternal and identical twins, and
adopteesor IV estimation. Among these studies we can cite Rosenzweig and Wolpin, 1994;
Sacerdote, 2002; Behrman and Rosenzweig, 2002; Plug and Vijverberg, 2003; Plug, 2004.
Behrman and Rosenzweig use a sample of twins. Plug uses a sample of adoptees. Most of these
studies find that parental education has at least a small impact on children’s schooling. Another
group of studies uses instrumental variable estimates in order to deal with the endogeneity of the
parental education. Chevalier (2003) uses the 1973 compulsory education law in Great Britain as
a source of exogenous variation in parental education. He finds that while father’s schooling has
no significant effect the mother’s schooling has a positive effect on the probability of children’s
post-compulsory education. Oreopoulos, Page and Stevens (2006) use IV estimation with
historical changes in compulsory schooling legislation in the USA and find that an increase in
the schooling of either parent reduces the probability that a child repeats a grade and that 15–16
year olds will drop out of school. However, some studies find no statistically significant
relationships when IV estimation is employed. For instance, Black, Devereux, and Salvanes
(2005) use IV estimation with multiple changes in compulsory schooling laws in Norway and do
not find a statistically significant relationship between parental education and children’s
schooling. Silles (2011) presents evidence on the effect of parental schooling on children’s
5 positive and statistically significant. However when she employs exogenous increases in
schooling induced by the schooling reform of 1947 in the UK the statistically significant
relationship disappears.
Hertz et al. (2007) examine the intergenerational transmission of education for 42 countries.
Nimubona and Vencatachellum (2007) investigate the intergenerational educational mobility in
South Africa and review the literature on educational correlations. They find that the cross
section estimates of black intergenerational education mobility do not differ from those obtained
by using pseudo-panel data, which control for unobserved community effects. Their results
indicate that intergenerational education mobility of whites is higher than that of blacks. Further
among the blacks females have higher intergenerational education mobility than males and the
poor have the lowest intergenerational educational mobility.
Daouli et al. (2010) investigate the intergenerational educational mobility in Greece for
daughters using conventional methods of transition matrices and intergenerational educational
coefficients as well as probit model estimates. Their results indicate substantial intergenerational
educational mobility in Greece.
3. EDUCATIONAL SYSTEM IN TURKEY AND THE DATA
Since the establishment of the Republic of Turkey in 1923 education of the population received
great attention and was free of tuition or fees at all levels. In the early 1960’s there was a major
attempt to expand coverage. Until 1997 the educational system consisted of primary school of
five years, middle school of three years, high school of three years and tertiary levels of
schooling. Five years of primary schooling was the only compulsory level of schooling until
1997. High schools encompass general, vocational and technical high schools. In 1997 there was
a major educational reform which extended the compulsory education from five to eight years
covering middle school. This affected pupils born after 1987. In the following period high
schools are extended from three years to four years. Tertiary education takes place at the
universities with two or four or more years of programs. The two year programs provide
6 universities has been increasing over time since the 1990’s. Currently there are 165 universities
all over the country.
There have been substantial improvements in the educational attainments over time. Adult
literacy rate increased from 17 percent in 1960 to 75 percent for females and 93 percent for
males in 1998 (World Bank, 2000/2001). 39 percent of the labor force is graduate of primary
school of five years. During the 2010-2011 academic year the enrollment ratio at the primary
level was 99% for both boys and girls and at the high school level it was 72% for boys and 66%
for girls.
Tertiary gross enrollment ratio increased from three percent in 1960 to 16 percent in 1993
(World Bank 1984, 1997).During the 2009-2010 academic year the enrollment ratio was 31%
for men and 30% percent for women.
The data used in this study comes from the Adult Education Survey conducted in 2007 by the
Statistical Institute of Turkey (TURKSTAT). Two stage, stratified, systematic, cluster sampling
method is used in sampling design. Classification of Statistical Regional Units and Rural-Urban
strata are used as external stratification criterion. Locations with population over 20,000 are
defined as urban and locations with population 20,000 or less are defined as rural locations. The
survey includes rich information about formal education, informal education, lifelong learning,
fields of education and training, conditions that prevent participation in education, computer
usage and foreign language skills, cultural activities as well as employment situation and income
of the individual. The survey contains information on parental education of all surveyed
individuals through the recall of children. This allows identification of the parental education
even if the parents and children are not co-resident There are a total of 39,478 individuals
interviewed in 17,501 households. In these households only the individuals 18 years old and over
are interviewed face to face. Proxy answers were not allowed. It was possible to distinguish six
cohorts representing age groups 18-24, 25-34, 45-54, 55-64 and 65+.
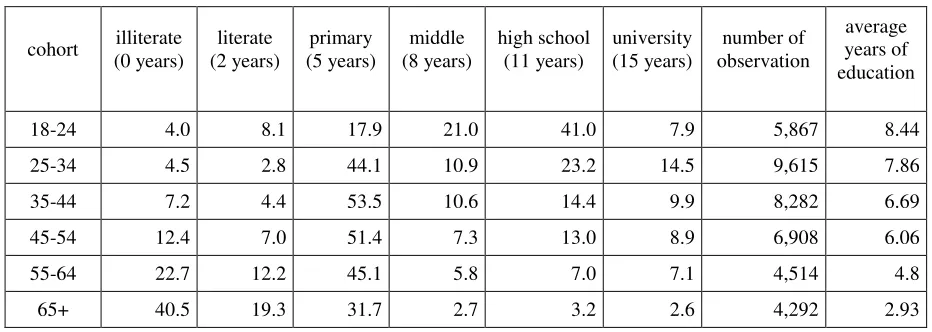
7 As can be observed the youngest cohort of individuals (18-24 group) attained the highest levels
of education. The oldest cohort (65 and over) have the lowest levels of education. This indicates
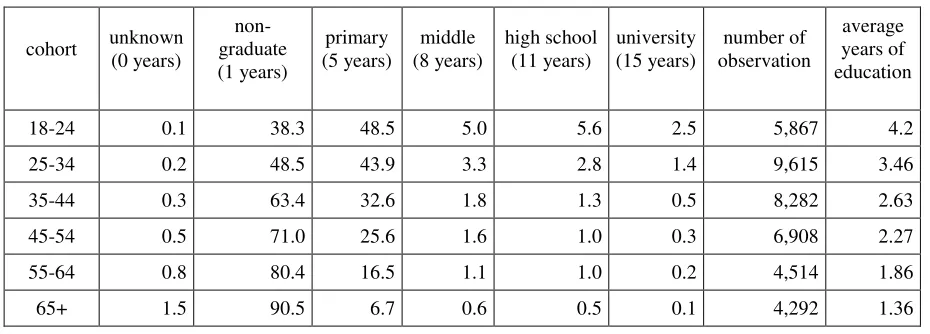
substantial improvement over time in educational attainments. Table 2 gives the distribution of
the highest degree completed by the mothers by cohort. For the cohort of 65 and over the average
years of schooling for the mothers is very low. Substantial improvement over time in mothers
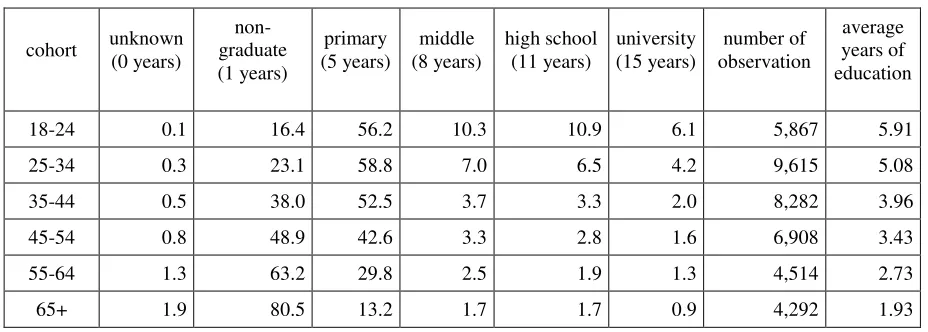
educational attainment is observed. Table 3 gives the distribution of the highest degree
completed by the fathers by cohort. Fathers educational attainment is higher than that of
mothersfor all cohorts. Again the table indicates substantial improvement over time in the
educational attainment of the fathers.
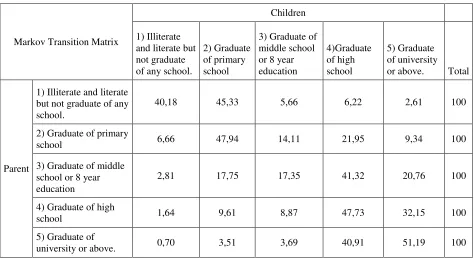
4. EDUCATIONAL TRANSITION MATRICES
Markov educational transition matrices and several mobility measures are presented in this
section. For this purpose four educational categories are distinguished. These are primary or less,
middle school, high school and university. Primary or less includes illiterates, literates but not
graduate of any school and primary school graduates. Parents’ generation represents time period
t and the children’s generation represents time period t+1. We let pij show the probability that the educational outcome i in t moves to educational outcome j in t+1. P denotes the 4x4 matrix
with elements pij . The transition matrix is estimated for the total sample covering the period before and including 1942 and 2007. Overall the estimated Markov educational transition matrix
indicates substantial stagnation.
There are three mobility indicators used to measure the overall level of mobility. The first is the
Prais (1955) and Shorrocks (1978) mobility index denoted by M(PS). It is defined as M(PS)=
(1/(n-1)(n-tr(P)) where n is the number of educational outcomes, P is the observed transition
matrix and tr(P) is its trace. M(PS) takes values between zero and one. The value of one implies
perfect mobility and the value of zero implies perfect immobility. Checchi et al. (1999) and
Douboli et al. (2010) provide further information on this index. The second indicator is the
upward and the third is the downward mobility indicators. The upward mobility indicator is the
8 mobility indicator is the arithmetic average of the entries above the main diagonal of the P
matrix. The arithmetic average of the entries on the main diagonal of the P matrix gives the
immobility ratio. Heineck and Riphahn (2007) and Douboli et al. (2010) provide further
information on this index. The third indicator is the relative opportunities mobility indicator
which is discussed by Bauer and Riphahn (2007). It shows “the extent to which the observed
educational attainment of children are equally distributed across all parental backgrounds”
(Douboli et al., 2010). These Mobility Indicators are presented below.
• 1) Prais-Shorrocks (Checchi et al. 1999) PS=(1/(n-1) (n-tr(P)) n = number of states.P is the transition matrix. Tr shows trace. 0 is perfect immobility, 1 is perfect mobility.
PS=0.0846 in Turkey, in Greecefor daughters PS= 0.663 to 0.870 (Douboli et al.,
2010).This indicates high immobility for Turkey.
• 2) Immobility Index (Heineck and Riphanh, 2007; Douboli et al., 2010 ). IMI=Arithmetic Average of the tr (P). IMI= 0.4088 in Turkey, in Greecefor daughters = 0.342 (Douboli
et al., 2010).
• 3) Upward mobility Index: Arithmetic average of the entries below the main diagonal of P. UMI= 0.1995 in Turkey, in Greece for daughters =0.215-0.312 (Douboli et al., 2010).
• 4) Downward Mobility Index: Arithmetic Average of the entries above the main diagonal of P. DMI= 0.1239 in Turkey, in Greecefor daughters = 0.117-0.048 (Douboli et al.,
2010).
5. INTERGENERATIONAL EDUCATIONAL COEFFICIENTS
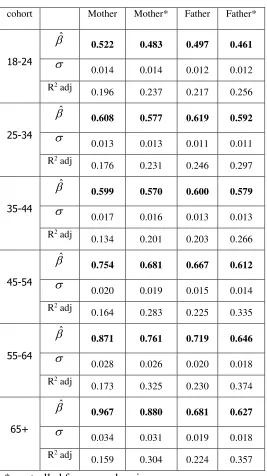
Table 5 shows the intergenerational educational coefficient. It is the coefficient of the parent’s
education in the following equation:
CEi = a + b PEi + Ei
CE: Child education.
PE: Mother education or father education.
9 A high value of b implies low intergenerational educational mobility and a low value of b
implies high intergenerational mobility. A negative value of b implies educational attainment
converges over time.
This equation is estimated for each cohort by OLS methodand presented in Table 5.
The estimates in columns 2 and 4 include controls for the gender of the child and region of
residence as rural and urban.
There are three observations to note in Table 5.
1) Children’s educational attainment is positively affected by parental education as it is also
shown by Belzil and Hansen (2003) and Cameron and Heckman (1998). The intergenerational
educational coefficient of the mothers seem somewhat larger in magnitude than that of the
fathers.
2) The intergenerational educational coefficients of both the mothers and the fathers
decrease over the cohorts.This implies intergenerational educational mobility has increased
significantly for the younger generations of children.
3) In general the intergenerational educational coefficients are smaller when the equations
include controls for gender and region.
We can show that:
b = r (σc/ σf )
Thus, the parameter b takes the ratio of standard deviations of the children to that of parents into
account. Therefore, the change of inequality in educational outcomesover time between the two
generations appears in the parameter b.
A decreasing b across the cohorts may be interpreted as an increase in educational mobility.
10 Table 4 gives the standard deviations of the educational level of the children, mothers and fathers
and their ratios. The ratio of the standard deviation of the children’s education to that of their mother’s and father’s decreases over the cohorts.
Since the ratio of standard deviations decreased through time in Turkey,the parameter estimate of
b includes the effect of the educational expansion over time. Therefore, I also estimated the
correlation coefficient between parent and child education. Checci et al. (2008) shows that b is
arelative measure of intergenerational mobility while the correlation coefficient is an absolute
measure of intergenerational mobility. Hertz et al. (2007) show that the evolution of b and the
correlation coefficient could differ over time which is what I find in this study also..
Table 6 shows the intergenerational educational Correlation Coefficient estimated from the
following equation:
(CEi / σc) = a + r (PEi /σf) + Ei
Here the CE and PE are divided by their respective standard errors. The coefficient r is the
correlation coefficient of the children’s and parents’ education. There is no discernible pattern to
the correlation coefficient over time as it is observed in Table 6 This the results in the table
indicate no improvement over time in educational mobility in Turkey.
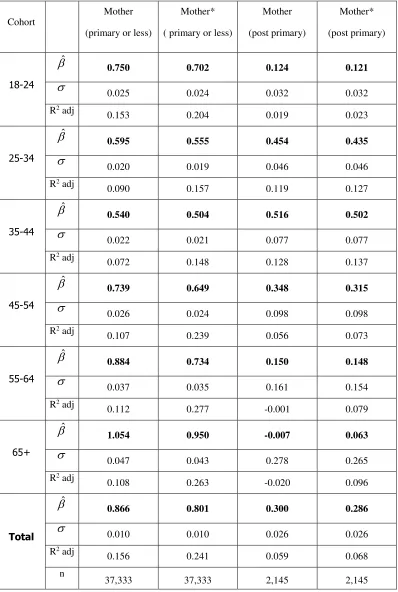
Table 7 shows the Intergenerational Educational Coefficient for mother by educational
background. The sample is divided into two according to mother having primary school
education or less and higher than primary school. The coefficients for the group of mothers’
education is primary or less are higher than for the group of mothers’ education post primary.
This indicates higher educational persistence for the group of less educated mothers than for the
better educated mothers.
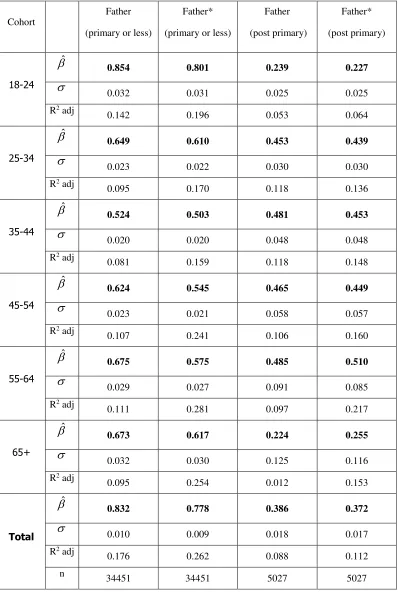
Table 8 shows the intergenerational educational coefficient when the sample is divided according
to fathers education being primary or less and above primary. The coefficients for father primary
or less are larger than the coefficients for father post primary indicating higher educational
11 Tables 7 and 8 imply that there is a stronger relationship between child and parent education
when the parent educational background is poor. This result implies that the policy makers
should concentrate on helping children with poor parental educational backgrounds.
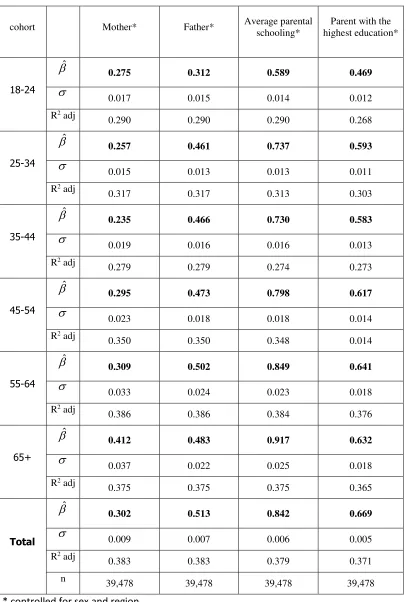
Table 9 shows the intergenerational educational coefficient by alternative definitions of
educational background. The two alternatives used are the average parental schooling and the
education level of the parent with the highest education. The coefficients are larger when average
parental schooling is used. In both cases the coefficients decline overtime smoothly indicating
an increase in the educational mobility over time in Turkey.
Figure 1 shows the expected number of years of education by birth cohort for the levels of father
education completed. This figure indicates a persistent gap between individuals and their fathers
schooling. Only individuals with tertiary educated father constantly achieve close to 14 years of
schooling. Children from the disadvantaged group of fathers who are not a graduate of any
school have about 4 years of schooling. However, their schooling attainment is increasing over
time.
6. ORDERED PROBIT MODEL ESTIMATES
Table 11 presents the estimates of an ordered probit model for the completed education levels
categorized into four levels as primary or less, middle school, high school and university
education. Primary is taken as the reference category. The model is estimated separately for each
birth cohort. Gender takes a value of one for male individuals. Urban takes a value of one for
individuals located in urban areas. All of the coefficient estimates are statistically significant.
The parental education background is represented by the highest completed level of education by
the father. Father’s education is an important determinant of an individual’s education. Father
primary or less has the lowest impact and the father university has the highest impact on the
12 The effect of being male on educational attainment is positive, statistically significant and
declines over time. This implies that the gender gap in education has declined significantly over
time.
The effect of living in an urban location on educational attainment is positive, statistically
significant and declines over time. This implies that the rural-urban gap in educational attainment
declined over time.
6.1. PREDICTED PROBABILITIES
The ordered probit estimates can be used to compute the predicted probability of completing a
level of schooling, say university for an individual, born in cohort say 18-24, with father’s
education say primary or less. This probability describes the educational opportunity of the
individual. It is the probability of completing university level education.
We now show the probability of achieving a given level of education for individuals of different
father educational background for each birth cohort. These are shown in Figure 2
The figures consider the predicted probabilities of high school and university level education
completion. The figures show the predicted probabilities and the 90% confidence intervals. The
confidence intervals are shown with dotted lines. The lines with triangular markers in pink
represent the probability of attaining university degree. The lines with square markers in blue
represent the probability of attaining high school degree.
The likelihood of completing high school increases across cohorts in all of the four figures which
correspond to different father’s educational level. In all cases there is greater dispersion in
completing the university education than completing the high school education. For the youngest
cohort of 18-24 the probability of attaining university education falls probably because this age
group is too young yet for university graduation.
Only the individuals whose fathers completed university have the highest probability of
13 Only for the individuals whose father is illiterate or primary school graduate, the probability of
attaining university degree is lower than the probability of attaining high school degree. In this
case the probability of attaining university degree is about 5 %.
The probability of attaining a university degree declines as the father’s completed schooling
level declines. The probability of attaining a university degree is around 70-80% for those whose
fathers have a university degree. This probability goes down to around 45% for those whose
fathers have a high school degree. The same probability goes down to 30% for those whose
fathers have a middle school degree. It is only 5% for those whose fathers are illiterate or
primary school graduate.
6.2. PREDICTED PROBABILITIES FOR URBAN MEN AND WOMEN
The next set of four figures give the predicted probabilities for urban men. The following next
set of four figures give the predicted probabilities for urban women. Each of the four figures
correspond to different level of education for the father. The general shapes of the predicted
probabilities for university and high school degrees are similar for men and women. The only
difference is that at all levels men’s predicted probabilities are higher than that of the women’s
predicted probabilities.
7. CONCLUSIONS
This paper which investigates intergenerational educational mobility over time is the first study
in Turkey.Previous studies such as Tansel (2002) addressed this topic for one point in time while
the current study provides a perspective over the (at least) last 65 years. For this purpose I use
the Adult Education Survey of 2007. This survey provides information on parent education
through recall of the children. This identifies parent education even if the parents and children
are not co-resident. I estimate the educational transition matrix, mobility indicators,
intergenerational educational coefficients and intergenerational educational correlation
14 estimated allowing computation of predicted probabilities which describe the educational
opportunities across cohorts for different parental educational backgrounds.
The educational attainment of individuals seem somewhat more strongly related to their mother’s
education than to their father’s education. In some cases the mother’s and father’s educational
coefficients are similar in magnitude.
The results show that the intergenerational educational coefficient has declined over time
indicating increased educational mobility and improved educational opportunity recently in
Turkey.This result is true when regression coefficient is used. The pattern in evolution over time
is less clear when correlation coefficient is used. However the association between parent and
child education is still strong. In particular, the parent child educational relationship are found to
be stronger when parents have poor educational background such as primary education or less
compared to post primary educational background. This strong association at poor educational
background levels imply that educational policy should in particular target group of children
with low parental education levels.
The chances of attaining university degree is higher than the chances of completing high school
at all levels of fathers educational background except the education level primary or less for the
father.The probability of attaining university degree for a child increases as fathers’ completed
schooling level increases. The children born to fathers with primary or less education have only
5 percent probability of attaining a university degree while the children born to fathers with a
university education have probability of 70-80 percent of completing university education.
One of the important results indicate that at all levels of fathers educational background, men’s
predicted probabilities of completing high school or the university education are substantially
higher than that of the women’s.
The results imply that educational policy should target children from low parental educational
backgrounds as well as women overall.
Future research will compare earlier and later sub-periods in order to further identify the
evolution of mobility over time. Estimations will be carried out separately for male and female
15 Decompositions will be carried out in order to explicitly isolate the effect of educational
expansion. Finally, different regions of Turkey will be studied to see if there are any regional
16 REFERENCES
d’Addio, A.C. (2007) “Intergenerational Transmission of Disadvantage: Mobility or Immobility
across Generations? A Review of the Evidence for OECD Countries”, OECD Social, Employment and Migration Working Paper No: 52.
Aydemir, A., W. H. Chen and M. Corak (2008) “Intergenerational Education Mobility among the Children of Canadian Immigrants”, Bonn: Institute for the Study of Labor (IZA) Discussion Paper No: 3759.
Bauer, Philipp and Regina T. Riphahn, (2007) “Heterogeneity in the Intergenerational
Transmission of Educational Attainment: Evidence from Switzerland on Natives and Second Generation Immigrants”, Journal of Population Economics 20(1), 121-148.
Becker, G.S. (1988) “Family Economics and Macro Behaviors”, The American Economic
Review, 78: 1–13.
Becker, S. G., and N. Tomes (1986) “Human Capital and the Rise and Fall of Families”, Journal of Labor Economics, 4: S1–S39.
Behrman J. (1997) “Mother’s Schooling and Child Education: A Survey”, University of
Pennsylvania, Economics Department, Discussion Paper No: 025.
Behrman, J., and M. Rosenzweig (2002) “Does Increasing Women’s Schooling Raise the Schooling of the Next Generation? “, American Economic Review, 92(1): 323–334.
Belzil, C., and J. Hansen (2003) “ Structural Estimates of the Intergenerational Education
Correlation”, Journal of Applied Econometrics, 18(6): 679–696.
Black S. E. and P. J. Devereux (2010) “Recent Developments in Intergenerational Mobility”, National Bureau of Economic Research (NBER) Working Paper No: 15889.
http://www.nber.org/papers/w15889
Black, Sandra E., Paul J. Devereux, and Kjell G. Salvanes, (2005) “Why the Apple Doesn't Fall
Far: Understanding Intergenerational Transmission of Human Capital”, American
Economic Review 95(1), 437-449
Blanden, Jo, and Stephen Machin (2004) “Educational Inequality and the Expansion of UK
Higher Education”, Scottish Journal of Political Economy, 51(2), 230-249.
Blanden, Jo, Paul Gregg, and Stephen Machin (2005) “Intergenerational Mobility in Europe and
North America”, A Report Supported by Sutton Trust, Centre for Economic Performance, London, mimeo.
Cameron, S., and J. Heckman (1998) “Life Cycle Schooling and Dynamic Selection Bias: Models and Evidence for Five Cohorts of American Males”, Journal of Political Economy, 106(2), 262–333.
Causa, O., S. Dantan and Å. Johansson (2009)"Intergenerational Social Mobility in European OECD Countries", OECD Economics Department Working Paper No: 709.
Checchi, D. and L. Flabbi (2006) “Intergenerational Mobility and Schooling Decisions in Italy and Germany: the Impact of Secondary School Tracks”, Bonn: Institute for the Study of Labor (IZA) Discussion Paper No: 2348.
Checchi, D., C. Fiorio, and M. Leonardi (2008) “Intergenerational Persistence in Educational Attainment in Italy”, Bonn: Institute for the Study of Labor (IZA) Discussion Paper No:
3622.
Checchi D., A, Ichino and A. Rustichini (1999) “More Equal But Less Mobile? Educational
17
Chevalier, A. (2004) “Parental Education and Child’s Education: A Natural Experiment”,
Institute for the Study of Labor (IZA) Discussion Paper No: 1153.
Chevalier, A., K. Denny, and M. McMahon (2007) “A Multi-Country Study of Inter-generational
Educational Mobility”, In Education and inequality across Europe. Edward Elgar.
Comi, S. (2004) “Intergenerational Mobility in Europe: Evidence from ECHP”, Munich: CESIfo Conference on Schooling and Human Capital Formation in the Global Economy.
Daouli, Joan, Michael Demoussis and Nicholas Giannokopoulos (2010) “Mothers Fathers and
Daughters: Intergenerational Transmission of Education in Greece”, Economics of Education Review, 29(1): 83-93.
Di Paolo, Antonio (2011) “Parental Education and Familly Characteristics: Educational Opportunities Across Cohorts in Italy and Spain”, Document de Treball, XREAP2010-5.
Farré, L., R. Klein and F. Vella (2012) “Does Increasing Parents’ Schooling Raise the Schooling of the Next Generation? Evidence Based on Conditional Second Moments”, Oxford
Bulletin of Economics and Statistics, Forthcoming.
Ferreira, F., J. Gignoux and M. Aran (2009) ” Inequality of Economic Opportunity in Turkey”,
Ankara: SPO-World Bank Welfare and Social Policy Working Paper No: 3.
Ferreira, F. and J. Gignoux (2009) “ Inequality of Opportunity for Education: The case of
Turkey”, Ankara: SPO-World Bank Welfare and Social Policy Working Paper No: 4.
Education Reform Initiative (2009) “ Inequality of Opprotunities in Education”, İstanbul:Eğitim Reformu Girişimi.
de Haan, M. (2008) “The Effect of Parents' Schooling on Child's Schooling A Nonparametric
Bounds Analysis”, Amsterdam: Tinbergen Institute Discussion Paper No: TI 2008-061/3. Haveman, R., and B. Wolfe (1995) “The Determinants of Children’s Attainments: A Review of
Methods and Findings”, Journal of Economic Literature, 33: 1829–1878.
Heineck, G. and R. T. Riphahn (2009) “Intergenerational Transmission of Educational
Attainment in Germany - The Last Five Decades”, Jahrbücher für Nationalökonomie und Statistik, 229(1): 36-60.
Helmuth C., P. De Donder and P. Pestieau (2009) “Education and Social Mobility”, CESifo Working Paper No: 2951.
Holmlund, H., M. Lindahl, and E. Plug (2008) “Estimating the Intergenerational Schooling Effect: A Comparison of Methods”, Bonn: Institute for the Study of Labor (IZA)
Discussion Paper No: 3630.
Holmlund, H., M. Lindahl, and E. Plug (2011) “The Causal Effect of Parents’ Schooling on
Children’s Schooling: A Comparison of Estimation Methods,” Journal of Economic Literature, 49(3): 615–651.
Hertz, T., T. Jayasundera, P. Piraino, S. Selcuk, N. Smith, and A. Verashchagina (2008) “ The Inheritance of Educational Inequality: International Comparisons and Fifty-Year Trends”, Advances in Economic Analysis and Policy 7(2), 1775.1775.
Iannelli, C. and L. Paterson (2005) “Does Education Promote Social Mobility?”,CES Briefings
No. 35, Edinburgh.
Lauer, Charlotte (2003) “Family Background, Cohort and Education: A French-German
Comparison Based on a Multivariate Ordered Probit Model of Educational Attainment”,
Labour Economics 10(2), 231-251.
18
Machin, Stephen and Anna Vignoles (2004) “Educational Inequality: The Widening Socio-Economic Gap”, Fiscal Studies 25(2), 107-128.
Mejia, D. and M. St-Pierre (2008) “Unequal Opportunities and Human Capital Formation”, Journal of Development Economics, 86(2), 395-413.
Niknami, Susan (2010) “Intergenerational Transmission of Education among Immigrant Mothers
and their Daughters in Sweden”, Stockholm: The Stockholm University, Linnaeus Center
for Integration Studies Working Paper No: 2010:10.
Nimubona, A. D. and D. Vencatachellum (2007) “Intergenerational Education Mobility of Black
and White South Africans”, Journal of Population Economics, 20:149–182.
Oreopoulos, Philip, Marianne E. Page, and Ann Huff Stevens (2006) “The Intergenerational Effects of Compulsory Schooling”, Journal of Labor Economics, 24(4), 729-760.
Oosterbeek, H. (1995) “Choosing the Optimum Mix of Duration and Effort in Education”,
Economics of Education Review, 14 (3) : 253-263.
Paes de Barros, R., F. Ferreira, J. Molinas Vega and J. S. Chanduvi (2009) “ Measuring Inequality of Opportunities in Latin America and the Caribbean”, Washington, DC: Latin American Development Forum Series.
Pascual, M. (2009) “Intergenerational Income Mobility: The Transmission of Socioeconomic Status in Spain”, Journal of Policy Modeling, 31: 835–846.
Pereira, P. T. (2010) Intergenerational Transmission of Education: An Alert to Empirical
Implementation “, Bonn: Institute for the Study of Labor (IZA) Discussion Paper No:
5074.
Plug, E. (2004) “Estimating the Effect of Mother’s Schooling on Children’s Education Using a
Sample of Adoptees”, American Economic Review, 94(1): 358-368.
Plug, E., and W. Vijverberg (2003) “ Schooling, Family Background, and Adoption: Is It Nature or Is It Nurture?”, Journal of Political Economy, 111(3): 611–641.
Prais, S. J. (1955) “Measuring Social Mobility”, Journal of the Royal Statistical Society, Series A, 118, 56–66.
Pronzato, C. (2012) “An Examination of Paternal and Maternal Intergenerational Transmission of Schooling”, Journal of Population Economics, 25(2): 591-608.
Rosenzweig, M., and K. Wolpin (1994) “Inequality among Young Adult Siblings, Public Assistance Programs, and Intergenerational Living Arrangements”, Journal of Human Resources, 29(4): 1101–1125.
Rumberger, R.W. (2010) “Education and the Reproduction of Economic Inequality in the United States: An Empirical Investigation”, Economics of Education Review, 29(2): 246-254.
Sapelli, C. (2009) “The Evolution of the Intergenerational Mobility of Education in Chile by Cohorts: Facts and Possible Causes”, Santiago, Chile: Pontificia Universidad Catolica de
Chile, Instituto de Economia Working Paper No: 348.
Sacerdote, B. (2002) “The Nature and Nurture of Economic Outcomes”, American Economic Review, 92(2), 344–348.
Schuetz, Gabriela, Heinrich W. Ursprung, and Ludger Woessmann, (2005) “Education Policy
and Equality of Opportunity”, Munich: CESifo Working Paper No. 1518.
Sen, Anindya and Anthony, Clemente (2010) “Intergenerational Correlations in Educational Attainment: Birth Order and Family Size Effects Using Canadian Data”, Economics of
19 Schultz, T. Paul (2002) “Why Governments Should Invest More to Educate Girls”,World
Development, 30(2): 207–225.
Shorrocks, A. F. (1978) “The Measurement of Mobility”, Econometrica, 46: 1013–1024.
Silles, Mary, A. (2011) “ Intergenerational Effects of Parental Scchooling on the Cognitive and Non-Cognitive Development of Children”, Economics of Education Review, 30(2): 258 -268.
Solon, Gary (1999) “Intergenerational Mobility in the Labor Market”, In Handbook of Labor
Economics, Vol. 3, O. Ashenfelter and D. Card (editors). Amsterdam: Elsevier Science B.V.
Tansel, Aysit (2002) “Determinants of School Attainment of Boys and Girls in Turkey: Individual, Household and Community Factors”, Economics of Education Review, 21(5): 455-470.
Woessmann, Ludger, (2004) “How Equal are Educational Opportunities? Family Background
and Student Achievement in Europe and the United States”, Munich: CESifo Working
20 Table 1: Highest Degree Completed by Cohort (Children, %)
cohort illiterate (0 years)
literate (2 years)
primary (5 years)
middle (8 years)
high school (11 years)
university (15 years)
number of observation
average years of education
18-24 4.0 8.1 17.9 21.0 41.0 7.9 5,867 8.44
25-34 4.5 2.8 44.1 10.9 23.2 14.5 9,615 7.86
35-44 7.2 4.4 53.5 10.6 14.4 9.9 8,282 6.69
45-54 12.4 7.0 51.4 7.3 13.0 8.9 6,908 6.06
55-64 22.7 12.2 45.1 5.8 7.0 7.1 4,514 4.8
21 Table 2: Highest Degree Completed by Cohort (Mothers, %)
cohort unknown (0 years)
non-graduate (1 years)
primary (5 years)
middle (8 years)
high school (11 years)
university (15 years)
number of observation
average years of education
18-24 0.1 38.3 48.5 5.0 5.6 2.5 5,867 4.2
25-34 0.2 48.5 43.9 3.3 2.8 1.4 9,615 3.46
35-44 0.3 63.4 32.6 1.8 1.3 0.5 8,282 2.63
45-54 0.5 71.0 25.6 1.6 1.0 0.3 6,908 2.27
55-64 0.8 80.4 16.5 1.1 1.0 0.2 4,514 1.86
22 Table 3: Highest Degree Completed by Cohort (Fathers, %)
cohort unknown (0 years)
non-graduate (1 years)
primary (5 years)
middle (8 years)
high school (11 years)
university (15 years)
number of observation
average years of education
18-24 0.1 16.4 56.2 10.3 10.9 6.1 5,867 5.91
25-34 0.3 23.1 58.8 7.0 6.5 4.2 9,615 5.08
35-44 0.5 38.0 52.5 3.7 3.3 2.0 8,282 3.96
45-54 0.8 48.9 42.6 3.3 2.8 1.6 6,908 3.43
55-64 1.3 63.2 29.8 2.5 1.9 1.3 4,514 2.73
23 Table 4: Markov Educational Transition Matrix
Markov Transition Matrix
Children
1) Illiterate and literate but not graduate of any school.
2) Graduate of primary school
3) Graduate of middle school or 8 year education
4)Graduate of high school
5) Graduate of university or above. Total
Parent
1) Illiterate and literate but not graduate of any school.
40,18 45,33 5,66 6,22 2,61 100
2) Graduate of primary
school 6,66 47,94 14,11 21,95 9,34 100
3) Graduate of middle school or 8 year education
2,81 17,75 17,35 41,32 20,76 100
4) Graduate of high
school 1,64 9,61 8,87 47,73 32,15 100
5) Graduate of
24 Table 5: Standard Deviation of Education of Children, Mothers and Fathers with Their Ratio
cohort σc σm σf σc /σm σc /σf
18-24 0.05 0.04 0.05 1.18 1.07
25-34 0.04 0.03 0.03 1.45 1.25
35-44 0.04 0.03 0.03 1.64 1.33
45-54 0.05 0.03 0.04 1.86 1.41
55-64 0.06 0.03 0.04 2.09 1.50
25 Table 6: Intergenerational Educational Coefficient
cohort Mother Mother* Father Father*
18-24
ˆ 0.522 0.483 0.497 0.461
0.014 0.014 0.012 0.012 R2 adj
0.196 0.237 0.217 0.256
25-34
ˆ 0.608 0.577 0.619 0.592
0.013 0.013 0.011 0.011 R2 adj
0.176 0.231 0.246 0.297
35-44
ˆ 0.599 0.570 0.600 0.579
0.017 0.016 0.013 0.013 R2 adj
0.134 0.201 0.203 0.266
45-54
ˆ 0.754 0.681 0.667 0.612
0.020 0.019 0.015 0.014 R2 adj
0.164 0.283 0.225 0.335
55-64
ˆ 0.871 0.761 0.719 0.646
0.028 0.026 0.020 0.018 R2 adj
0.173 0.325 0.230 0.374
65+
ˆ 0.967 0.880 0.681 0.627
0.034 0.031 0.019 0.018 R2 adj
0.159 0.304 0.224 0.357
26 Table 7: Intergenerational Educational Correlation Coefficient
cohort Mother Mother* Father Father*
18-24
ˆ 0.417 0.386 0.497 0.461
0.011 0.011 0.012 0.012 R2 adj
0.196 0.237 0.217 0.256
25-34
ˆ 0.456 0.433 0.464 0.444
0.010 0.010 0.008 0.008 R2 adj
0.176 0.231 0.246 0.297
35-44
ˆ 0.449 0.427 0.450 0.434
0.013 0.012 0.010 0.010 R2 adj
0.134 0.201 0.203 0.266
45-54
ˆ 0.452 0.409 0.534 0.489
0.012 0.012 0.012 0.011 R2 adj
0.164 0.283 0.225 0.335
55-64
ˆ 0.436 0.380 0.230 0.431
0.014 0.013 0.479 0.012 R2 adj
0.173 0.325 0.013 0.374
65+
ˆ 0.387 0.352 0.545 0.502
0.014 0.013 0.015 0.014 R2 adj
0.159 0.304 0.224 0.357
27 Table 8: Intergenerational Educational Coefficient for Mother by Educational Background
Cohort
Mother
(primary or less)
Mother*
( primary or less)
Mother
(post primary)
Mother*
(post primary)
18-24
ˆ 0.750 0.702 0.124 0.121
0.025 0.024 0.032 0.032 R2 adj
0.153 0.204 0.019 0.023
25-34
ˆ 0.595 0.555 0.454 0.435
0.020 0.019 0.046 0.046 R2 adj
0.090 0.157 0.119 0.127
35-44
ˆ 0.540 0.504 0.516 0.502
0.022 0.021 0.077 0.077 R2 adj
0.072 0.148 0.128 0.137
45-54
ˆ 0.739 0.649 0.348 0.315
0.026 0.024 0.098 0.098 R2 adj
0.107 0.239 0.056 0.073
55-64
ˆ 0.884 0.734 0.150 0.148
0.037 0.035 0.161 0.154 R2 adj
0.112 0.277 -0.001 0.079
65+
ˆ 1.054 0.950 -0.007 0.063
0.047 0.043 0.278 0.265 R2 adj
0.108 0.263 -0.020 0.096
Total
ˆ 0.866 0.801 0.300 0.286
0.010 0.010 0.026 0.026 R2 adj
0.156 0.241 0.059 0.068 n
37,333 37,333 2,145 2,145
28 Table 8: Intergenerational Educational Coefficient for Father by Educational Background
Cohort
Father
(primary or less)
Father*
(primary or less)
Father
(post primary)
Father*
(post primary)
18-24
ˆ 0.854 0.801 0.239 0.227
0.032 0.031 0.025 0.025 R2 adj
0.142 0.196 0.053 0.064
25-34
ˆ 0.649 0.610 0.453 0.439
0.023 0.022 0.030 0.030 R2 adj
0.095 0.170 0.118 0.136
35-44
ˆ 0.524 0.503 0.481 0.453
0.020 0.020 0.048 0.048 R2 adj
0.081 0.159 0.118 0.148
45-54
ˆ 0.624 0.545 0.465 0.449
0.023 0.021 0.058 0.057 R2 adj
0.107 0.241 0.106 0.160
55-64
ˆ 0.675 0.575 0.485 0.510
0.029 0.027 0.091 0.085 R2 adj
0.111 0.281 0.097 0.217
65+
ˆ 0.673 0.617 0.224 0.255
0.032 0.030 0.125 0.116 R2 adj
0.095 0.254 0.012 0.153
Total
ˆ 0.832 0.778 0.386 0.372
0.010 0.009 0.018 0.017 R2 adj
0.176 0.262 0.088 0.112 n 34451 34451 5027 5027
29 Table 10: Intergenerational Educational Coefficient with Alternative Educational Background
cohort Mother* Father* Average parental schooling*
Parent with the highest education*
18-24
ˆ 0.275 0.312 0.589 0.469
0.017 0.015 0.014 0.012 R2 adj
0.290 0.290 0.290 0.268
25-34
ˆ 0.257 0.461 0.737 0.593
0.015 0.013 0.013 0.011 R2 adj
0.317 0.317 0.313 0.303
35-44
ˆ 0.235 0.466 0.730 0.583
0.019 0.016 0.016 0.013 R2 adj
0.279 0.279 0.274 0.273
45-54
ˆ 0.295 0.473 0.798 0.617
0.023 0.018 0.018 0.014 R2 adj
0.350 0.350 0.348 0.014
55-64
ˆ 0.309 0.502 0.849 0.641
0.033 0.024 0.023 0.018 R2 adj
0.386 0.386 0.384 0.376
65+
ˆ 0.412 0.483 0.917 0.632
0.037 0.022 0.025 0.018 R2 adj
0.375 0.375 0.375 0.365
Total
ˆ 0.302 0.513 0.842 0.669
0.009 0.007 0.006 0.005 R2 adj
0.383 0.383 0.379 0.371 n 39,478 39,478 39,478 39,478
30 Table 11: Intergenerational Educational Correlation Coefficient by Alternative Definitions of
the Educational Background
ˆ R2 adj n
Mother* (primary or less) 0.532 0.007 0.209 37333
Mother* (post primary) 0.302 0.018 0.118 2145
Father* (primary or less) 0.652 0.007 0.285 34451
Father* (post primary) 0.411 0.011 0.242 5027
Mother* 0.161 0.006 0.395 39478
Father* 0.479 0.005 0.395 39478
Average parental schooling* 0.669 0.005 0.380 39478
Parent with the highest education* 0.628 0.006 0.312 39478
31 Figure 1: Expected Years of Education across Cohorts by Parental Education
0 2 4 6 8 10 12 14 16
65+ 55-64 45-54 35-44 25-34 18-24
Birth Cohort E x p e c te d Y e a rs o f E d u c a ti o n
Fathers with non-graduate
Fathers with primary
Fathers with middle
Fathers with high school
32 Table 12: Ordered Probit Estimates for Completed Education
18-24 25-34 35-44 45-54 55-64 65+
Father_middle ˆ 0.667
0.830 1.035 1.125 1.264 1.538
0.048 0.044 0.064 0.076 0.107 0.138
Father_high ˆ
1.031 1.304 1.377 1.515 1.510 1.540
0.048 0.047 0.069 0.083 0.125 0.140
Father_university ˆ
1.243 1.809 2.027 2.058 2.363 2.039
0.064 0.063 0.098 0.119 0.176 0.185
Gender ˆ
0.308 0.465 0.517 0.659 0.750 0.764
0.029 0.024 0.028 0.033 0.047 0.067
Urban ˆ
0.418 0.455 0.438 0.678 0.792 0.931
0.033 0.028 0.032 0.038 0.056 0.080
μ1
μ1 0.072 0.779 1.091 1.518 1.968 2.637 0.031 0.028 0.033 0.040 0.059 0.089
μ2
μ2 0.707 1.109 1.449 1.798 2.262 2.913 0.032 0.029 0.034 0.041 0.061 0.092
μ3
μ3 2.288 2.003 2.144 2.504 2.767 3.433 0.041 0.032 0.037 0.046 0.066 0.101
Log likelihood 6749.279 10341.856 7698.409 5527.289 2732.373 1296.034
Pseudo-R2 0.084 0.106 0.094 0.127 0.157 0.213
33 Figure 2: Predicted Probabilities
Father Education=University
34 Father Education=Middle school
35 Figure 3: Predicted Probabilities for Men in Urban Areas
Father Education=University
36 Father Education=Middle school
37 Figure 4: Predicted Probabilities for Women in Urban Areas
Father Education=University
38 Father Education=Middle school