Text Line Extraction from Complex Layout Documents
Brij Mohan Singh, Vivek Chand
Research Cell,College of Engineering Roorkee, Roorkee-247667,Uttarakhand, India
Ankush Mittal
Director (Research) Graphic Era University,Dehradun-248002, Uttarakhand, India
Debashish Ghosh
Department of E&C,IIT Roorkee,
Roorkee-247667,Uttarakhand, India
ABSTRACT
There are numerous stylish documents which do not have the traditional text layouts where printed text regions are not parallel to each other. Such complex layouts make text line extraction challenging due to multi-orientation of paragraphs. This paper introduces a system for the text line extraction from the complex layout documents. Proposed method is based on the concept of dilation and histogram profiling. The text regions are extracted using dilation and food fill based approach, then paragraph orientation is determined and individual text lines are extracted. The accuracy of extracted text lines are evaluated using the new proposed concept that is also based on the histogram profiling. The results of proposed approach on the complex layouts are promising.
General Terms
Document Analysis and Recognition, Optical Character Recognition.
Keywords
OCR; Segmentation; Profiling; Dilation;
1.
INTRODUCTION
Optical character recognition (OCR) has been a popular research area for three decades due to its various application potentials [1]. The applications of OCR [2-4] include such as office, library and publishing houses automation, reading aid for the blind peoples, automatic mail sorting, reading entrance examination forms, processing of applications of victims and criminal records in police station, bank cheque processing, vehicle license plate processing and language processing systems etc. The objective of OCR systems is automatic reading of document image and translation into machine-readable codes such as ASCII codes.
Preprocessing, segmentation, feature extraction and classification are the four important steps of any of the OCR systems. Segmentation is one of most prominent step for the extraction of text regions, text lines, words and characters from the page layout for recognition purpose. Segmentation process extracts basic constituent such as words and characters of the text present on the document image. Further these constituents are needed for the recognition purpose. A perfect extraction of text line, word, and character is required before individual word or character is recognized. The subsequent stages of OCR systems mainly depend upon the accuracy of segmentation stage [5]. A slight mistake in interpreting the text in terms of
segmentation can lead to mistake in the automation process such as wrong entry in examination forms or wrong mail sorting in postal service [6]. Before segmentation of text lines, it is important to detect and extract the paragraphs or text regions from the document image.
There exist many printed as well as handwritten materials where text regions are not parallel to each other and they are multi-oriented in nature as shown in fig. 1 [7]. It is very difficult to extract text regions from the complex layout document images due to multi-orientation of text paragraphs, availability of graphics and images [8]. Page segmentation divides the document image into homogeneous zones, each consisting of only one physical layout structure. The accuracy of OCR system may be decreased due to wrong segmentation of text lines and words. Numbers of commercial OCR systems are now available in the market but most of these systems work on good quality documents. There are no sufficient numbers of research works on text line extraction from complex layout documents [7].
There are many techniques to extract text lines from single oriented documents [9-16]. Some pieces of published work on extraction of multi-oriented and curved text lines are in [17-25]. Kise et al. [26] proposed a method of page segmentation based on analysis of background and it is capable of segmenting pages with non-rectangular layout as well as with various angles of skew. Some other studies on page segmentation are in [27-45]. Robust page segmentation approach based on smearing and error correction unifying top-down and bottom-up approaches is proposed by Cao et al. [46]. Marinai et al. [47] present layout based document image retrieval by means of XY tree reduction approach. Shafait et al. [48] evaluated six well known algorithms of page segmentation. Keysers et al. [49] proposed a document image zone classification based simple high-performance approach. Recently, Smith [50] proposed a hybrid page layout analysis via tab-stop detection approach.
2.
PROPOSED METHODOLOGY
2.1
Selection and Extraction of Text Regions
The first step aims at extracting multi-oriented text regions from the document. The output of this step is the set of images consisting of only one type of orientation. The orientation of these textual images is determined at the latter stage. Textual regions are extracted (vertically and horizontally oriented) using the following sub-steps:
2.1.1
Selecting the regions
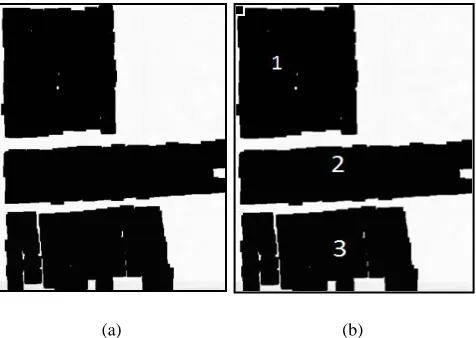
[image:2.612.321.559.71.240.2]First of all, dilation [51] with square structuring element having a radius of 12 pixels (The corresponding D8 or chessboard distance will be half of the side i.e. 6 pixels) is applied to whole document to cover the text regions containing black pixels. Fig. 3 (a) shows the dilation on the text regions.
Figure 1: Sample document images with complex layouts
Figure 2: Sample input image with complex layout
(a) (b)
Figure3: (a) Region selection using dilation and (b) Region numbering
2.1.2
Extraction of dilated regions
For the extraction of the different regions from the dilated image concept of flood fill is used. Each pixel of the dilated image row and column wise is scanned (i.e. each column is scanned for particular row and then moving to next row). When a first black pixel is encountered the all connected black pixels to it, is flood filled by the gray level color corresponding to value 1. The same procedure is repeated for the subsequent black pixels encountered with the increasing grey level intensities i.e. 2, 3, 4………and so on. Thus all the dilated regions get numbered starting from 1 to the number of textual regions as shown in fig. 3 (b). Region 1 is encountered first and is flood filled by the gray level value of 1. Region 2 is encountered second and is flood filled by the gray level value of 2. Finally region 3 is encountered third and is flood filled by the gray level value of 3. The numbering is done in the same manner if more regions are in document images.
2.1.3
Formation of new image containing different
textual region
To form the sub images containing the textual regions, a set of blank white image of minimum area is formed which contains the different black regions (dilated regions). The approach used to form the set of blank images is to determine the maximum and minimum values of ‘x’ and ‘y’ coordinates and then minimum value is subtracted from the maximum value to determine the width and height of blank image to be formed.
Height (H) = Max(y) - Min(y)
1
Weight (w) = Max(x) - Min(x)
2
[image:2.612.43.302.235.424.2]2.2 Region orientation determination and text
line extraction
In this step, the set of images generated as the output of the previous step is taken as the input one by one and their orientation is determined. These images are passed to next stage for segmentation. This step works using the following steps:
2.2.1 Determination of the orientation
To determine the orientation of the text, histogram profiling based approach [6] is used. We form two kinds of histograms; histogram type one (vertical) is formed by analyzing the text row wise counting the number of black pixels in each row and forming the histogram for it. Histogram type two (horizontal) is formed by analyzing column wise counting number of black pixels in each column and forming histogram for it. The concept of histogram representation is shown in fig. 4.
[image:3.612.328.553.173.467.2]Vertical Histogram Horizontal Histogram
Figure 4: Representation of vertical and horizontal histogram
Both types of histograms (vertical and horizontal) are formed starting from the row or column where first black pixel is encountered till the row or column where last black pixel is encountered. The histograms of vertical and horizontal text region are shown in fig. 5 and 6 respectively.
[image:3.612.46.298.269.392.2]Input Image Vertical Histogram Horizontal Histogram
Figure 5: Shows the vertical and horizontal histograms of vertical text region
Now, Histogram is transformed to the percentage notation to denote the number of pixel as the percentage of maximum number of black pixel in each row using the formula:
% of Pixel = (Number of Pixel in a Row / Max. of Number of Pixel in Rows)*100
3
Where number of pixel in any row is the number of black pixel encountered in row and maximum number of pixel is number of black pixel in the row which contains maximum number of black pixels among all rows.
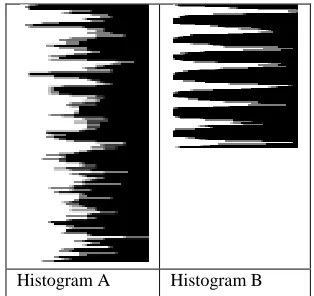
Using data formed by using equation number 3, we transform histogram 1 and histogram 2 to Histogram A and Histogram B as shown in fig. 7 and 8 respectively.
(a) Input Image
(b) Vertical Histogram
[image:3.612.38.308.491.607.2]
(c) Horizontal Histogram
Figure 6: Shows the vertical and horizontal histograms of horizontal text regions
Since histogram is changed in percentage notation the maximum value of number of black pixel for any row cannot exceed 100 numbers.
Histogram A Histogram B
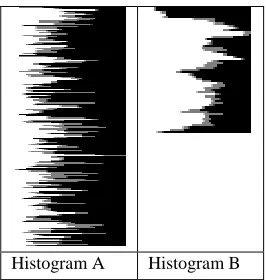
[image:3.612.362.519.545.693.2]Histogram A Histogram B
Figure 8: Transformed histogram (in %) of horizontal text
To determine the orientation of the textual regions, the number of regions consisting of white pixels is denoted by black regions in histograms shown in fig. 9 for both Histogram A and B and is counted.
Figure 9: Histogram counting concept
Now these numbers of regions is also converted into percentage notation with respect to Height and Width respectively using the following equations:
% NRV = (NRV / Height of Histogram A)*100 Where NRV= Number of Black Regions in Vertical
Histogram A 3
% NRH = (NRH / Height of Histogram B)*100 Where NRH= Number of Black Regions in Horizontal
Histogram B 4
Height of Histogram A= Height of Considered
Sub-image Containing Text – X 5
X= (Height of Lowermost White Region in that Image Without Text + Height of Topmost White Region
Without Text) 6
Height of Histogram B= Width of Considered
Sub-image Containing Text – S 7
S= (Height of Leftmost White Region in that Image Without Text + Height of Rightmost White Region Without Text)
8
Now we consider two cases, first case, if %NRV is greater than %NRH. It denotes the text being horizontal as number of white regions is more in the horizontal text. When we analyze vertically as there is sufficient spacing between two lines. In Second case, if %NRH is greater than %NRV. This case denotes the text being vertical as number of white regions is more in vertical text as it move horizontally due to spacing between vertical lines
2.2.2 Segmentation of text lines
After the identification of the type of the orientation, we proceed to the segmentation of the lines from the sub images of textual region on the basis of horizontal or vertical text. If the text is vertical the lines are segmented on the basis of the Histogram B and if text is horizontal the lines are segmented on the basis of the Histogram A. Considering vertical text, the histogram of type B is used for segmentation as shown in fig. 10.
[image:4.612.42.298.292.433.2]Vertical text Histograms
Figure 10: Histograms of vertical text
For the purpose of segmentation, the histogram of type B is starting from the top most and the region corresponding to the white pixels in the histogram type is cropped from the sub- image as a new image keeping height of the cropped images constant and varying the width according to the histogram. The value of the width from which the image is to be cropped is determined by the address of the topmost pixel of corresponding white region and the address of the lowermost pixel gives us the width up to which we have to crop the image. The cropped set of images thus formed from original textual sub-image for each white regions of the histogram is the segmented vertical lines as shown in fig. 11.
[image:4.612.322.557.318.448.2]In the same manner the horizontal text is also segmented by reading the data from the histogram of type A and following the same procedure as above keeping width constant i.e. equal to original width of sub image and finding the addresses and height for the purpose of cropping from the original image on the basis of histogram type. The sample of horizontal profiling of horizontal text is shown in fig. 12.
[image:5.612.382.500.70.249.2]Horizontal text from a document Histogram of type A
Figure 12: Horizontal profiling of horizontal text
2.3 Verification of segmentation and its
correction
[image:5.612.54.291.163.318.2]Sometimes, it is observed that there is no complete spacing between two text lines means they are connected by one or two pixels in one or other location as shown in fig. 13. To cope with this problem, we set all the white pixels in histograms to 0% whose percentage value is less than threshold value which is taken initially 2% thus the connected characters in upper and lower lines can be segmented in this manner.
Figure 13: Relationship between two text lines
As shown in fig. 13, two upper and lower brackets in two text lines are example of connection between two text lines at different location which can cause problem while forming the histogram as there will be no zero black pixel or white region between two lines thus there will be no black region in histogram. Thus as a result two text lines considered as a single text line.
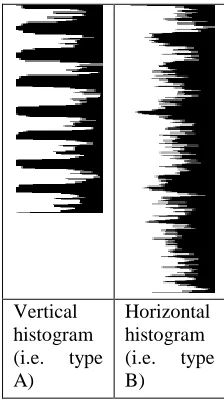
After the horizontal or vertical segmentation of respective regions it is checked weather the regions are segmented properly or not. When the text is segmented into horizontal line the resulted segmented lines are used to form the histograms and then their orientation is determined. It results into virtually vertical text as their will be no black pixel regions in Histogram A and considerable black pixels region in Histogram B.
Horizontal histogram (i.e. type B)
[image:5.612.384.496.329.530.2]Vertical histogram (i.e. type A)
Figure 14: Horizontal Vs. Vertical histograms
The example of histograms of horizontally segmented line is shown in fig. 14. On the basis of histograms as shown in fig. 14, %NRV is greater than %NRH. It means, the text line is vertical after horizontal segmentation.
Vertical histogram (i.e. type A)
Horizontal histogram (i.e. type B)
Figure 15: Vertical Vs. Horizontal histograms
[image:5.612.49.297.463.515.2]results i.e. properly segmented lines. One more step is included in verification by considering width for vertical segmented line and height for horizontally segmented text line.
For horizontally segmented text, if height of any of segmented lines is greater than K the threshold value is incremented and segmentation process is done again. K is defined as shown in the following equation:
K = Average of Height of all Segmented Text Lines + (Average of Height of all Segmented Text Lines / 2) 8
Same process is performed for vertically segmented text taking width into consideration and K will be
K = average of width of all segmented lines + (average
of width of all segmented lines/2) 9
Thus segmentation is performed again and again on the sub-images containing text region with increased threshold value until the segmented images passes the verification steps thus at the end we get the proper segmented text lines.
3.
RESULTS AND DISCUSSIONS
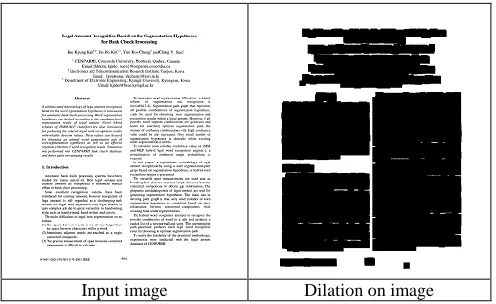
For testing of our proposed methodology, we have developed and collected a dataset of complex layout documents from newspapers, books and internet as shown in fig. 15. The proposed methodology of text line extraction is based on the two set of experiments. In the first set of experiment, proposed methodology was tested on 15 machine printed documents having different kind of text orientation. In the second set of experiment, proposed algorithm was tested on 15 handwritten complex layout document images. Experimental results demonstrate efficiency of our proposed methodology. Further, the accuracy of text lines extraction is evaluated using a concept based on histogram profiling.
[image:6.612.48.296.473.625.2]Input image Dilation on image
Figure 15: Shows sample of data set used in experiment with dilation
The proposed method for text line extraction can be applied to word and character segmentation with equal efficiency. Hence, the proposed system of text segmentation proved to be useful in the designing of OCR where document contains challenging
structural properties such as complex page layout and multi-script text
4.
CONCLUSION AND FUTURE WORK
In this work, we presented an approach to extract text lines from the complex machine printed as well as handwritten document layouts. The text extraction algorithm was tested on 30 images but more sample images can produce more output cases in terms of merits or demerits of proposed algorithm. Although we have done experiments only on English script documents but proposed system is not a script/language dependent, it can also be useful in all Indian scripts also such as Brahmi, Grantha, Sinhalese, Bali and other scripts. This work is useful in the development of language/script independent OCR systems. Most of the works reported on Indian languages are on straight text line documents. Elaborate studies on complex layout documents are not undertaken by the researchers in the development of script/language independent OCR systems.
5.
REFERENCES
[1] Marinai, S. 2008 Introduction to document analysis and recognition. Studies in Computational Intelligence (SCI), (2008), 90, 1–20.
[2] Tang, Y.Y., Suen, C.Y. Yan, C.D. and Cheriet, M. 1991. Document analysis and understanding: a brief survey. In Proceeding of the 1st International Conference on Document Analysis and Recognition, Saint-Malo, France, 17-31.
[3] Plamondon, R., and Srihari, S. N. 2000. On-line and off-line handwritten recognition: A comprehensive survey. IEEE Trans. on PAMI, (2000), Vol.22, 62-84
[4] Sethi, I. K. and Chatterjee, B. 1977. Machine recognition of constrained hand printed Devnagari. Pattern Recognition, (1977), Vol. 9, 69-75.
[5] Shaw, B., Parui, S. K., and Shridhar, M. 2008. A segmentation based approach to offline handwritten Devanagari word recognition. PReMI, IEEE, (2008), 528-35.
[6] Singh, B.M., Mittal, A., and Ghosh, D. 2011. Parallel implementation of Devanagari text line and word segmentation approach on GPU. International Journal of Computer Applications (2011), 24(9):7–14.
[7] Antonacopoulos, A., Pletschacher, S., Bridson D., and Papadopoulos, C. 2009. ICDAR 2009 page segmentation competition. In Proceeding of International Conference of Document Analysis and Recognition, IEEE, 1370-1374.
[8] Shafait1, F., Beusekom, J. V., Keysers, D., and Breuel, T. M. 2008. Background variability modeling for statistical layout analysis, In Proceeding of 19th International conference on Pattern Recognition, IEEE, 1-4.
[9] Fujisawa, H., Nakano, Y., and Kurino, K. 1992. Segmentation methods for character recognition from segmentation to document structure analysis. In Proceeding of the IEEE, Vol.80, pp. 1079-1092. 1992.
[11]Abuhaiba, I.S.I., Datta, S., and Holt, M.J.J. 1995. 'Line extraction and stroke ordering of text pages. In Proceedings of the Third International Conference on Document Analysis and Recognition, Canada, 390- 393.
[12]Zahour, A., Taconet, B., Mercy, P. and Ramdane, S. 2001. Arabic hand-written text-line extraction. In Proceedings of the Sixth International Conference on Document Analysis and Recognition, 281–285.
[13]Weliwitage, C., Harvey A. L., and Jennings, A. B. 2005. Handwritten document offline text line segmentation. In Proceedings of Digital Imaging Computing: Techniques and Applications, 184-187.
[14]Louloudis, G., Gatos, B., Pratikakis, I. and Halatsis, K. 2006. A block based hough transform mapping for text line detection in handwritten documents. In Proceedings of the Tenth International Workshop on Frontiers in Handwriting Recognition, 515-520.
[15]Li, Y., Zheng, Y., Doermann, D., and Jaeger, S. 2006. A new algorithm for detecting text line in handwritten documents. In Proceedings of the Tenth International Workshop on Frontiers in Handwriting Recognition, 35–40.
[16]Zahour, A., Taconet, B., Likforman-Sulem, L., and Boussellaa, W. 2008. Overlapping and multi-touching text-line segmentation by block covering analysis. Pattern Analysis and Applications, (2008), Vol. 12, 335-351.
[17]Goto, H., and Aso, H. 1999. Extracting curved lines using local linearity of the text line. International Journal of Document Analysis and Recognition, (1999), vol. 2, 111– 118.
[18]Hones, F., and Litcher, J. 1994. Layout extraction of mixed mode documents. Machine Vision Applications, (1994), vol. 7, 237–246.
[19]Liao, S. X., and Pawlak, M. 1996. On image analysis by moments. IEEE Transaction on PAMI, (1996) Vol.18, 254-266.
[20]Pal, U., Sinha, S., and Chaudhuri, B. B. 2003. English multi-oriented text line extraction. Image Analysis, Springer Verlag, Lecture Notes on Computer Science (LNCS-2749), 1146-1153.
[21]Roy, P. P., Pal, U., Lladós, J., and Kimura, F. 2008. Multi-oriented English text line extraction using background and foreground information. In Proceeding of Eighth IAPR Workshop on Document Analysis Systems, IEEE, 315-322.
[22]Roy, P. P., Pal, U., Lladós, J., and Kimura, F. 2008. Convex hull based approach for multi-oriented character recognition from graphical documents. In Proceeding of International Conference on Pattern Recognition, IEEE, 1-4.
[23]Pal, U., and Tripathy, N. 2004. Multioriented and curved text lines extraction from Indian documents. IEEE Transactions on Systems, Man, and Cybernetics—Part B: Cybernetics, (2004), Vol. 34, No. 4, pp. 1676-1684.
[24]Pal, U., and Tripathy, N. 2005. Recognition of Indian multi-oriented and curved text. In Proceedings of the Eight International Conference on Document Analysis and Recognition, 141-145.
[25]Pal, U, and P. P. Roy, P.P. 2004. Multi-oriented and curved text lines extraction from Indian documents. IEEE Transaction on SMC - Part B, (2004), vol.34, 1676-1684.
[26]Kise, K., Yanagidw, O., and Takamatsu, S. 1996. Page segmentation based on thinning of background. In Proceedings of International Conference on Pattern Recognition, 788-792.
[27]Wong, K. Y., Casey, R. G., and Wahl, F. M. 1982. Document analysis system. IBM Journal of Research and Development, (1982), vol. 26, no. 6, 647–656.
[28]Nagy, G., Seth, S. and Viswanathan, M. 1992. A prototype document image analysis system for technical journals. Computer, (1992), vol. 7, no. 25, 10–22.
[29]O’Gorman, L. 1993. The document spectrum for page layout analysis. IEEE Transaction on Pattern Analysis and Machine Intelligence, (1993) vol. 15, no. 11, 1162–1173.
[30]Baird, H. S., 1994. Background structure in document images. International Journal of Pattern Recognition and Artificial Intelligence (IJPRAI), (1994), 8(5):1013–1030.
[31]Esposito, F., Malerba, D., and Semeraro, G. 1995. A knowledge based approach to the layout analysis. In Proceedings of the Third International Conference on Document Analysis and Recognition, vol. 1, 466-471.
[32]Liu, J., Tang, Y. Y., He, Q., and Suen, C. Y. 1996. Adaptive document segmentation and geometric relation labeling: algorithms and experimental results. In Proceedings of the 13th International Conference on Pattern Recognition, vol. 3, 163-767.
[33]Dori, D., Doermann, D., Shin, C., Haralick, R., Phillips, I., Buchman, M., and Ross, D. 1997. The representation of document structure: A generic object-process analysis. In Handbook of Character Recognition and Document Image Analysis, H. Bunke and P. Wang, Eds. World Scientific, Singapore, 421–456.
[34]Simon, A., Pret, J.-C., and Johnson. A. 1997. A fast algorithm for bottom-up document layout analysis. IEEE Transactions on Pattern Analysis and Machine Intelligence, 19:273–277.
[35]Kise, K., Sato, A., and Iwata, M. 1998. Segmentation of page images using the area Voronoi diagram. Computer Vision and Image Understanding, (1998), vol. 70, no. 3, 370–382.
[36]Cattoni, R., Coianiz, T., Messelodi, S., and Modena, C.M. 1998. Geometric layout analysis techniques for document image understanding: a review. Downloaded from http://citeseer.nj.nec.com/, IRST, Trento, Italy, Tech. Rep. 9703-09.
[37]Jain, A.K., and Yu, B. 1998. Document representation and its application to page decomposition. IEEE Transaction on PAMI, (1998), 20(3), 294–308.
[38]Ishitani, Y., 1999. Logical structure analysis of document images based on emergent computation. In Proceedings of International Conference on Document Analysis and Recognition, Bangalore, India, 189–192.
Conference on Document Recognition and Retrieval VIII, , San Jose, CA, 111–122.
[40]Breuel, T. M. 2002. Two geometric algorithms for layout analysis. In Document Analysis Systems, Princeton, NY, 188–199.
[41]Breuel, T. M. 2003. High performance document layout analysis. In Symposium on Document Image Understanding Technology, Greenbelt, MD.
[42]Antonacopoulos, A., Gatos, A., and Karatzas, D. 2003. ICDAR 2003 page segmentation competition. In Proceeding of 7th International Conference on Document Analysis and Recognition, Edinburgh, UK, 688–692.
[43]Mao, S., Rosenfeld, A., and Kanungo, T. 2003. Document structure analysis algorithms: a literature survey. In Proceeding of SPIE Electronic Imaging, vol. 5010, 197– 207.
[44]Antonacopoulos, A., Gatos, B., and Bridson, D. 2005. ICDAR 2005 page segmentation competition. In Proceeding of 8th International Conference on Document Analysis and Recognition, Seoul, Korea, 75–80.
[45]Antonacopoulos, A., Gatos, B. and Bridson, D. 2007. ICDAR2007 page segmentation competition. In Proceeding of ICDAR2007, Curitiba, Brazil, 1279-1283.
[46]Cao, H., Prasad, R., Natarajan, P., MacRostie, E. 2007. Robust page segmentation based on smearing and error correction unifying top-down and bottom-up approaches. Ninth International Conference on Document Analysis and Recognition, IEEE, 392-396.
[47]Marinai, S., Marino, E., and Soda, G. 2005. Layout based document image retrieval by means of XY tree reduction. In Proceeding of 8th International Conference on Document Analysis and Recognition, Seoul, Korea, 432– 436.
[48]Shafait, F., Keysers, D., and Breuel, T. M. 2006. Performance comparison of six algorithms for page segmentation. In Proceeding of 7th IAPR Workshop on Document Analysis Systems, Nelson, New Zealand, 368– 379.
[49]Keysers, D., Shafait, F., and Breuel, T. M. 2007. Document image zone classification - a simple high-performance approach. In Proceeding of 2nd International Conference on Computer Vision Theory and Applications, Barcelona, Spain, 44–51.
[50]Smith, R. 2009. Hybrid page layout analysis via tab-stop detection. In Proceeding of International Conference of Document Analysis of Recognition, Barcelona, Spain, 241-245.