Mammographic Microcalcifications Detection
using Discrete Wavelet Transform
Nizar Ben Hamad
Ur: SETIT-University of Sfax ISBS Rte La Soukra km 4,5 BP261, 3038 Sfax Tunisia
Khaled Taouil
ISECS-University of SfaxISECS Rte Mzl Chaker km 0,5 BP 868-3018 Sfax
Med Salim Bouhlel
Ur: SETIT-University of Sfax ISBS Rte La Soukra km 4,5 BP 261,3038 Sfax Tunisia
ABSTRACT
Breast cancer can be diagnosed with an early training course by detecting the presence of microcalcifications in screening mammograms. The multiresolution analysis using discrete wavelet transform presents characteristics which can be exploited to develop tools for detection of microcalcifications. The objective of this work is to study the best type of wavelet and the optimal level of decomposition for a better detection. The approach is divided into two phases. The first phase of the algorithm consists on multiresolution analysis based on 1-D discrete wavelet transform over profiles of microcalcifications extracted from mammographic images. This analysis is carried out with several families of wavelets. The second phase of the algorithm is interested in the validation of the results of the first. In this stage, we apply 2-D discrete wavelet transform in analysis and synthesis on screening mammograms extracted from the mini-MIAS database (Mammographic Image Analysis Society) in order to detect the microcalcifications.
Keywords
Breast cancer, Digital Mammograms, Microcalcification, Discrete Wavelet Transform, Multiresolution analysis.
1.
INTRODUCTION
With more than 10 million new cases every year, cancer has become one of the most devastating diseases world-wide (Stewart et al. 2003). Early detection of breast cancer provides successful treatment. SCREEN–FILM mammography is recognized as being the best means of early detection of the breast cancer. Currently, there is a consensus on the fact that the mammography of tracking may reduce mortality by breast cancer at least 30% (Murgo 2002). Mammograms are the most difficult of radiological images to interpret since they are of low contrast. Also, features in mammograms indicative of breast disease, such as microcalcifications, are often very small. Therefore, a computer system has already been used to help the radiologists to pre-screen mammograms (Wang et al. 1998). During the last twenty years, considerable research has been undertaken in the development of automated detection of microcalcifications. Several image processing methods were proposed (a thorough review of various methods can be found in (Thangavel et al. 2005) and (Cheng et al. 2003)).
Among these, there are many promising wavelet approaches based on the discrete wavelet transform multiresolution analysis.
Although, there are various wavelet decomposition approaches microcalcifications detection algorithms, the study of the optimal level of decomposition is of great interest to perform computer aided detection of microcalcifications based on multiresolution wavelet transform.
The remaining of the paper is organized as follows. First, an overview of some wavelet-based approaches is provided in section II. Next, we introduce the principles of wavelet transform and multiresolution approach in Section III. The proposed approach is developed in Section IV. Results and applications are presented in Section V. Finally, conclusion and some suggested directions for future work are given in Section VI.
2.
OVERVIEW OF SOME
WAVELET-BASED APPROACHES
Several types of wavelet transforms were employed in algorithms to achieve automated detection of microcalcifications. In this section, a few most important techniques for microcalcification detection are reviewed. (Wang et al. 1998) presented an approach for detecting microcalcifications in digital mammograms employing wavelet-based subband image decomposition. Given that the microcalcifications correspond to high-frequency components of the image spectrum, microcalcifications can be extracted form the original mammograms by suppressing the subband of the wavelet-decomposed image that carries the lowest frequencies, before the reconstruction of the image.
(Sersic et al. 1998) introduce a novel approach based on redundant wavelet transform to enhance digital mammography images. The procedure consists of three steps: low-frequency tissue density component removal, noise filtering and microcalcification enhancement. The experimental results have shown good properties.
(Chan et al. 1999) developed an enhancement algorithm relying on multiscale wavelet analysis and extracted oriented information at each scale of analysis was investigated. The evolution of wavelet coefficients across scales characterized well the local shape of irregular structures. This concept appears to be a promising approach for enhancing complex structures and subtle tissues of the breast.
(Zadeh et al. 2000) extracted three kinds of features from ROIs: wavelet features, multi-wavelet features, and co-occurrence based features. Using a neural network, it could classify benign and malignant microcalcification clusters. The test results on a set of 103 regions containing microcalcifications show that the multi-wavelet method has better performance, and gets an area of 0.91 under the ROC curve.
analysis of the histogram is used to classify the susceptible zones containing microcalcifications.
(Sentelle et al. 2002) shows that a multiresolution FCM-based segmentation combined with wavelet processing can be employed to quickly detect and segment calcifications as a possible pre-processing step for a classifier. This algorithm exhibits difficulty with the detection of some subtle calcifications. Overall, it is expected that the addition of linear structure detections, fined tuned fuzzy rules, local measurement of standard deviation and enhanced use of the FCM algorithm output during the pre-processing stage could result in significant improvements in performance.
(Heinlein et al. 2003) presented a new algorithm for enhancement of microcalcifications in mammograms. The main novelty was the application of techniques developed for construction of filterbanks derived from the continuous wavelet transform. These discrete wavelet decompositions, called integrated wavelets, are optimally designed for enhancement of multiscale structures in images. These techniques were applied to the detection of microcalcifications. The algorithm was positively evaluated in a clinical study. It has been implemented in a mammography workstation developed by IMAGETOOL. Since microcalcifications appear as singularities in mammograms, (Lemaur et al. 2003) provide new wavelets with a higher Sobolev regularity compared the classical wavelets, assuming the same support width. The results show that the detection of clustered calcifications in digitized mammograms is improved by the use of wavelets with a high Sobolev regularity.
3.
WAVELET TRANSFORM AND
MULTIRESOLUTION APPROACH
Because of a powerful underlying mathematical theory, wavelet methods of analysis and representation are presently having a significant impact on the science of medical imaging and the diagnosis of disease and screening protocols. They offer exciting opportunities for the design of new multiresolution image processing algorithms (Unser et al. 2003). The interesting properties are as follows (Sajda et al. 2002): Wavelet transform gives the both frequency and time information of the analyzed signal.
Inversibility: We must be able to reconstruct an image from its discrete wavelet coefficients.
Admissibility: wavelet transform can be used for first analyze and then reconstruct a signal without loss of information. Regularity: Wavelet regularity is a key property to improve the detection of singularities.
Translation covariance: Shifting the original image produces a wavelet coefficient shifting without changing its structure. This section describes the procedure of implementing the one-dimensional wavelet transform.
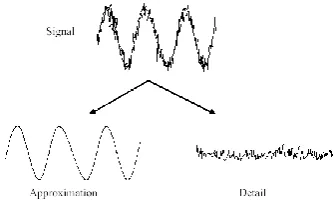
Most images correspond to signals which have high-frequency components of short duration (details) and low-frequency components of long duration (approximations) (figure 1). Bearing these consi-derations, a multiresolution analysis works best with this kind of signals.
3.1
1-D Wavelet analysis filter bank:
The 1-D wavelet transform analysis is the first step in the multiresolution approach.
Consider a multiresolution hierarchy with j levels. Each level contains an approximation, Aj, and details Dj. The original data can be thought of as A0. Approximation A1 is the low frequency components of A0, and D1 is the high frequency components of A0. The detail can be thought of as the difference between A1 and A0 so that A0=A1+D1=A2+D2+D1 etc…
Since the analysis process is iterative, in theory it can be continued indefinitely. In reality, the decomposition can proceed only until the individual details consist of a single observation.
The mathematical description of the multiresolution hierarchy follows:
j1 k
k j
0
(
t
)
a
(
t
)
d
(
t
)
a
)
t
(
d
)
t
(
a
)
t
(
a
j
j1
j1Two closely related basic functions are needed for the multiresolution formulation. The first basic function is the wavelet function (t) and the other one is called the scaling function and denoted by (t) (Sajda et al. 2002). All other wavelets are obtained by simple scaling and translating of (t) as follows:
In the most common formulation, the scaling is discrete and dyadic, a=2-j. The translation is discretized with respect to each scale by using =k2-jT. A one-dimensional orthonormal wavelet basis is generated from dyadic dilation and integer translation of the two basic functions, the ‘‘father’’ wavelet
and the ‘‘mother’’ wavelet.
The collection:
0,1
k
2
0
,1
k
2
,
j
j
0
jk j j k
j
forms an orthonormal wavelet basis (Reza 1999).
)
(
1
,
a
t
a
a
(3))
2
(
2
/2,
t
kT
j j k
j
(4))
2
(
2
/2,
t
kT
j j k
j
[image:2.595.342.510.85.185.2]
(5)Figure 1: Details and Approximation signals
(1)
The two-parameter wavelet expansion for signal x(t) is given by the following decomposition series in which the scaling and wavelet functions are utilized.
k j j
k j k j k j k
k
t
cD
t
cA
t
S
0
0
(
)
(
)
)
(
, ,
,In this expansion, ck coefficients are referred to as approximation coefficients at scale j0. The set of dj,k coefficients represents details of the signal at different scales.
x
t
t
x
t
t
dt
cD
j,k(
),
j,k(
)
(
)
j,k(
)
x
t
t
x
t
t
dt
cA
k(
),
j ,k(
)
(
)
j ,k(
)
0
0
These coefficients can be found using discrete wavelet transform filter bank.
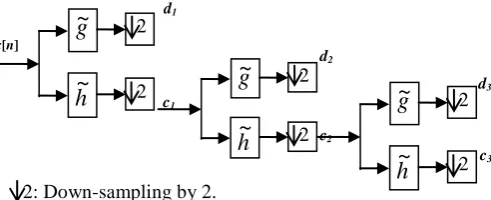
The hierarchical model can be illustrated as follows (figure 2): (Erickson 2005).
Mallat demonstrates that the dyadic nature of multiresolution approximations, in orthogonal basis, is closely related to the possibility of implementing the discrete wavelet transform (DWT) using filter bank. Further more, there is a recursive relation between cj and cj+1, also between dj and cj+1.
]
2
[
~
1n
k
h
c
c
n j k jk
]
2
[
~
1n
k
g
c
d
n j k jk
Where:
[
]
[
]
~
&
]
[
]
[
~
n
g
n
g
n
h
n
h
The above procedure, which is also known as the subband coding, can be repeated for further decomposition. At every level, the filtering and subsampling will result in half the number of samples (and hence half the time resolution) and half the highpass and lowpass filters are not independent of each other, and they are related by:
]
1
[
)
1
(
]
[
n
h
n
g
n
The implementation of the discrete wavelet transform using
2: Down-sampling by 2.
3.2
2-D Wavelet analysis and reconstruction
filter bank:
For the processing of images, the 1-D DWT is extended to 2-D DWT. Using tensor product wavelets, one performs the 1-D decomposition process along both x (row) and y (column) axes. A total of four subband images HH, HL, LH and LL are generated (figure 4). Different subband images contain different information and they may be processed individually using different algorithms. The subband image LL corresponds to the lowest frequencies. It contains the smooth information and the background intensity of the image. The subbands HL, LH, HH contain the detail information of the image. The subband HL gives the vertical high frequencies (horizontal edges), LH gives the horizontal high frequencies (vertical edges) and HH gives the high frequencies in both directions (corners and diagonal edges).
LL3 LH3
LH
2LH
1
HL3
HH3 1,2,3…..:Level of decomposition
HL
2HH
2 H……….: High frequency bandHL
1
HH
1
L………: Low frequency bandFor reconstruction Filters, we denote the importance of choosing the right filters. In fact, the choice of filters not only determines whether perfect reconstruction is possible, it also determines the shape of the wavelet we use to perform the analysis.
The reconstruction can be performed from each level and each subimage while keeping the size of the reconstructed image the same as the original image.
4.
PROPOSED APPROACH
[image:3.595.316.562.75.175.2]One of the important symptoms of breast cancer in the mammograms is the appearance of microcalcification clusters, which have a higher X-ray attenuation than the normal breast tissue and appear as group of small localized granular bright spots in the mammograms (Yu et al. 2000).These bright spots, presented as singularities, appear in the frequency domain as (6) (7) (8) (9) (10) (11)
Figure 3: 1-D DWT filter bank implementation
g
~
1h
~
1 2 2x[n]
d1 c1 d2 d3 c3 c2
g
~
2h
~
2 2 2g
~
3h
~
3 2 2Figure2: Multiresolution Hierarchical Model.
[image:3.595.307.534.399.559.2]S is the original image.
an image can be recovered locally using the wavelet-based subband decomposition. In each subband, the coefficients of details which have high modulus correspond to singularities in the image. In order to recognize with exactitude clustered microcalcifications regions on mammograms, we asked for the opinion of the expert radiologist who marked us manually the position of the pixels corresponding to the microcalcifications. The knowledge of the band or the frequency bands occupied by the microcalcifications makes it possible to define a level of decomposition which will constitute important information a priori for the development of computer aided detection of microcalcification based on wavelet subband decomposition. Different wavelet families are available and it is not always evident to decide the best wavelet to use for the detection of microcalcifications (Gendron et al.) We propose the use of 1-D wavelet transform to find out this level.
The algorithm consists of two main phases.
Phase 1: based on 1-D WT and composed of four steps:
Dimension reduction of the image to reduce the dimensions of a data set. This work is performed by a cropping matlab function to delimitate the region of interest (ROI) which contains microcalcifications and a limit background area.
The localization of microcalcifications is performed according to notes of an expert radiologist. Then, profiles of microcalcifications were extracted in two directions (vertical and horizontal).
1-D WT with different families of wavelet is applied on the signal up to the sixth level.
Comparison between details coefficients of each level is done to carry out the best wavelet and its optimal level from which the microcalcifications disappear.
Phase 2: To validate the results of the first phase, 2-D wavelet decomposition is performed up to this optimal level. Then, the approximations coefficients of the last level which are supposed correspond to the background of the image (breast tissues) were set at zero and finally the image is reconstituted. This image will be then filtered to keep only the frequencies corresponding to the microcalcifications. Figure 5 gives an overview of all the stages of the approach.
By applying the step described above, we noted that the number of false detections due to the noises and the nature of the breast tissues were relatively important. To reduce the number of false positives, we perform two types of operations.
First, a binary thresholding at all details subbands images. The details coefficients of all levels, which have modulus less than 50% of the maximum absolute value modulus of each level, are set to zero. This technique will decrease the rate of false detection due to noise, blood vessels, artifacts and dense breast tissue in the mammograms. Then, we reconstruct image, at the original size to preserve localization of microcalcifications. In the second operation, we used a method of local thresholding based on moments of order one and two. The rebuilt image is divided into blocks of size 5x5. The blocks which do not present a strong variance or wide amplitude of the gray level are put at zero. We obtain a matrix of zeros and ones which we call matrix of the blocks. We carry out then a product between the matrix of blocks and the matrix of rebuilt image.
The results obtained with the two operations are presented in the following paragraph.
5.
EXPERIMENTAL RESULTS
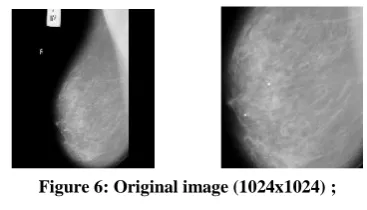
The first step in phase 1 is the dimension reduction of the image to reduce the dimensions of a data set. (figure 6).
The Second step is the extraction of microcalcification profile from digital mammograms. (figure 7 a,b).
Next, 1-D multiresolution wavelet transform is applied until the sixth level. Different wavelet families with different null moments have been used. The best one, performed on mammograms would be the one which would provide very small detail coefficients when analyzing the normal areas whereas abnormal areas would give detail coefficients with high modulus.
Initial
Image selection R.O.I 1-D wavelets transform
Best wavelet and optimal level choice
2-D wavelets transform (Optimal level)
Zero setting of approximation coefficients Details
coefficients thresholding Image
reconstruction Microcalcifications
detection
Figure 6: Original image (1024x1024) ;
Cropped image (550x540)
Figure 7: Microcalcification profile along; a: Horizontal direction; b: Vertical direction.
[image:4.595.328.512.295.400.2]Figure 7(b) Figure 7(a)
[image:4.595.307.526.461.633.2] [image:4.595.63.283.532.689.2]The results show that the maximum details signal, are obtained using the biorthogonal 2.4 wavelet at the third level.
[image:5.595.354.477.130.245.2]At the second phase of the approach, 2-D wavelet subband decomposition is performed up to level 4.
Figure 8 shows the different subbands images obtained.
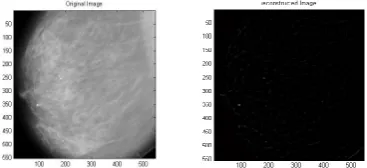
Then, the approximation coefficients of the LL4 were set to zero. Finally, the image is rebuilt. The reconstituted image is given on figure 9.
Binary thresholding is applied on the image in order to have a more readable one. The result is presented at figure 10. This image presents a certain number of false positive detections (light points which does not correspond to microcalcifications).
To reduce the number of false positive detections, a binary thresholding is performed at all details subbands images. The result is presented at figure 11.
In this figure, some microcalcifications are missed with this technique. For this reason, a local thresholding involving moments of order one and two on the reconstructed image is performed. The result is presented at figure 12.
The approach is tested on a set of 40 images containing 317 mammographic microcalcifications. Table 1 gives the different parameter values TP (true positive), TN (true negative) and FP (false positive). These results are given for both thresholding techniques used before.
Thresholding technique
Total No. of
microcalcifications TP TN FP Moments
order 1 317 302 15 12
Moments
order 2 317 307 10 8
The positive predictive value PPV and The specificity S of the system were calculated for the two techniques of thresholding.
FP VP
VP VPP
VN FP
VN S
In the case of variances thresholding, PPV = 96% and S = 55.6%, whereas for extended thresholding, PPV = 97.5% S = 55.6%.
6.
CONCLUSIONS
Multiresolution analysis based on 2-D discrete wavelet transform was used in our algorithm for the development of computer aided detection of microcalcifications to help radiologists in the diagnosis of breast cancer. In this paper, we studied in a first stage the optimal level of decomposition and we chose the wavelet which appears most suitable with our problems. This study showed that from a certain level of decomposition, we lose information which corresponds to the microcalcifications. In the second stage, we perform a multiresolution decomposition filter banks of the mammograms. The binarisation of the reconstituted image as well as the local thresholding gave a clear reduction in the number of false positives.
[image:5.595.102.255.141.253.2]For further studies, it seems important to develop algorithms to find optimal size of blocks when using local thresholding. Also, we denote that classifier algorithms will improve the false positive rate.
[image:5.595.84.268.312.396.2]Figure 8: 4 levels decomposition
[image:5.595.305.563.337.417.2]Figure 9: Original and reconstructed image
Figure 10: Thresholded reconstructed image
Figure 11: Reconstructed image with thresholded details
Figure 12: Local thresholded image
Table 1. Results for both thresholding techniques
(12)
[image:5.595.128.224.469.563.2] [image:5.595.109.204.632.731.2]7.
REFERENCES
[1] Bernard W.Stewart and Paul Kleihues, “World cancer Report”, International Agency for research on Cancer, 2003.
[2] Salvator MURGO “Classifications des Anomalies Mammographiques”, Université libre de Bruxelles, 2002. [3] Ted C. Wang and Nicolaos B. Karayiannis, “Detection of
Microcalcifications in Digital Mammograms Using Wavelets”, IEEE Tran. on Medical Imaging, vol. 17 pp. 498-509, Aug. 1998.
[4] K.Thangavel, M.Karnan, R.Sivakumar, A.Kaja Mohideen, “Automatic Detection of Microcalcifications in Mammograms- A Review”, ICGST, 2005.
[5] H.D. Cheng, Xiaopeng Cai, Xiaowei Chen, Liming Hu and Xueling Lou, “Computer-aided Detection and Classification of Microcalcification in Mammgrams: A survey”, Pattern Recognition, Vol 36, pp. 2967-2991, 2003.
[6] Damir Sersic and Sven Loncaric, “Enhancement of Mammographic Images for Detection of Microcalcifications”, Fac. of Electrical Engineering and Computing, Zagreb, Croatia, 1998.
[7] Chun-Ming Chang and Andrew Laine, “Coherence of Multiscale Features for Enhancement of Digital Mammograms”, IEEE Tran. on Information Technology in Biomedical, vol. 3, n 1, pp. 32-46, 1999.
[8] H.S. Zadeh, S.P. Nezhad and F.R. Rad, “Texture Feature Extraction Methods for Microcalcification Classification in Mammgrams”, Proc. SPIE 3979, pp. 982-989, 2000. [9] Raul Mata, Enrique Nava, Fransisco Sendra,
“Microcalcification Detection Using Multiresolution Methods”, icpr, vol. 04, no. 4, pp. 4344, 2000.
[10] S.Sentelle, C.Sentelle and M.A.Sutton, “Multiresolution-Based Segmentation of Calcifications for the Early
Detection of Breast Cancer”, Elsevier Science Ltd, Tran. on Real-Time Imaging, vol. 8, pp. 237-252 2002.
[11] Peter Heinlein, Johan Drexl and Wilfried Schneider, “Integrated Wavelets for Enhancement of Microcalcifications in Digital Mammograms”, IEEE Tran. on Medical Imaging, vol. 22, n. 3, pp. 402-413 March 2003.
[12] G.Lemaur, K.Drouiche and J.DeConinck, “Highly Regular Wavelets for the Detection of Clustered Microcalcifications in Mammograms”, IEEE Tran. on Medical Imaging, vol. 22, n. 3, pp. 393-401 March 2003. [13] Michael Unser, Akram ALDROUBI and Andrew Laine
“Wavelet in Medical Imaging”, IEEE Tran. on Medical Imaging, vol. 22, n. 3, pp. 285-288 March 2003.
[14] Paul Sajda, Andrew Laine and Yehoshua Zeevi, “Multi-resolution and wavelet representations for identifying signatures of disease”, IOS press, pp 339-363, 2002. [15] Ali. M.Reza, “Wavelet Characteristics”, Lab UWM White
paper, Oct. 1999.
[16] Carissa ERICKSON, “Automated Detection of Breast Cancer using SAXS Data and Wavelet Features”, Master dissertation, University of saskatchewan. Saskatoon, July 2005.
[17] Songyang Yu and Ling Guan, “A CAD System for the Automatic Detection of Clustered Microcalcifications in Digitized Mammogram Film”, IEEE Tran. on Medical Imaging, vol. 19, n. 2, pp. 115-126 February 2000. [18] Marlin L. GENDRON and Dr. Juliette W. IOUP “Wavelet