http://dx.doi.org/10.4236/pp.2014.511111
How to cite this paper: Obih, P.O. and Oyekan, A. (2014) Proteomic Analysis of Salt-Induced Changes in Protein Expression in PPARα Null Mice. Pharmacology & Pharmacy, 5, 996-1005. http://dx.doi.org/10.4236/pp.2014.511111
Proteomic Analysis of Salt-Induced Changes
in Protein Expression in PPARα Null Mice
Patience O. Obih
1*, Adebayo Oyekan
21College of Pharmacy, Xavier University of Louisiana, New Orleans, USA
2College of Pharmacy and Health Sciences, Texas Southern University, Houston, USA
Email: *[email protected]
Received 27 August 2014; revised 22 September 2014; accepted 8 October 2014
Copyright © 2014 by authors and Scientific Research Publishing Inc.
This work is licensed under the Creative Commons Attribution International License (CC BY).
http://creativecommons.org/licenses/by/4.0/
Abstract
PPARs are ligand-activated nuclear transcription factors that regulate β-oxidation of fatty acids in the cardiovascular system and PPARα isoform is a putative target for regulation of cardiovascular function. High salt diet is an injurious stimulus to cardiovascular function but its effect on PPARα and PPARα–associated profile of proteins is unknown. Quantitative proteomics involving a two- dimensional electrophoresis (2D-DIGE) followed by LC-MS/MS technology was used to character-ize the changes in protein expression profile in the kidney, heart, and blood vessels from PPARα null (KO) and wild type (WT) mice placed on normal (0.3%, NS) or high salt (4% NaCl, HS) diet. In-itial biological variation analysis using DeCyder software (v. 6.0) revealed the presence of 20 upregulated proteins and 9 proteins that are downregulated in the kidney, aorta, and heart tissues from KO and WT mice. A multimodality comparison of the differentially expressed proteins show-ing ≥ 1.5-fold change, ≥20% appearance at P ≤ 0.05 between strains (WT vs KO) and treatment (NS vs HS) revealed that HS diet affected 20 proteins in WT mice and 17 proteins in KO mice. However, 9 proteins were altered between WT and KO placed on NS and 7 proteins were altered by HS be-tween WT and KO mice. The identified proteins include but not limited to those involved in fatty acid oxidation (FAO), mitochondrial electron transport chain, amino acid metabolism, stress re-sponse, DNA synthesis, and programmed cell death. HS diet led to upregulation of FAO enzymes viz: acyl-coenzyme A dehydrogenase, transketolase, and electron-transferring-flavoprotein dehydro-genase to different extents in WT and KO mice. These data showed differential and protein-spe- cific responses to HS diet in PPARα WT and KO mice that probably reflect the functional capacities of PPARα as a means to limiting any salt-induced injury to the heart, kidney, and blood vessels.
Keywords
PPARα, β-Oxidation, Salt Diet, Proteome
1. Introduction
Peroxisome proliferator-activated receptors (PPARs) are ligand-dependent nuclear transcription factors that form a subfamily of the nuclear receptor belonging to the steroid-thyroid hormone superfamily. PPARs com-prise 3 isoforms, viz., α, β/δ, and γ that exhibit tissue-specific distribution and ligand-specific effects [1]. PPARα is expressed in tissues with very active fatty acid metabolism such as the heart, kidney, liver, endothelium, and vascular smooth muscle cells [2] [3] [4] [5]. PPARα is involved not only in peroxisomal and mitochondrial fatty acid oxidation, but also in microsomal fatty acid hydroxylation by cytochrome P450 enzymes, lipoprotein, bile and amino acid metabolism, glucose homeostasis, biotransformation, inflammation control, hepato-carcinoge- nesis and other pathways [1] [6].
In animal cells, mitochondria and peroxisomes oxidize fatty acids via β-oxidation, with long chain fatty acids (LCFAs) and very long chain fatty acids (VLCFAs) being preferentially oxidized by peroxisomes [7] [8]. On the other hand, mitochondrial β-oxidation involves metabolism (dehydrogenation reactions) by a family of four chain-length-specific acyl-CoA dehydrogenases, which include very long chain, long chain, medium chain, and short chain acyl-CoA dehydrogenases (VLCAD, LCAD, MCAD, and SCAD respectively) [7] [8]. Evidence for the importance of PPARα in fatty acid metabolism was provided in studies that demonstrated a reduction in the constitutive levels of mitochondrial fatty acid β-oxidation though the constitutive or basal oxidation of VLCFAs by peroxisomal β-oxidation system appears unaffected by PPARα deficiency [9] [10]. LCFAs constitute the bulk of fatty acids in animals, and their abundance makes them the only significant source of metabolic fuel for mitochondrial β-oxidation system [8]. Under normal physiologic conditions, mitochondrial β-oxidation is the dominant metabolic pathway, whereas the extramitochondrial fatty acid oxidation occurring within peroxisomes and endoplasmic reticulum assumes a minor role [7] [8]. Accordingly, decreased mitochondrial fatty acid β- oxidation has been considered one of the major mechanisms underlying the disturbances in lipid metabolism in liver leading to steatosis [11] [12]. However, oxidation of fatty acids by mitochondria depends not only upon the capacity of β-oxidation enzymes and substrate concentration but is also influenced by other factors such as changes in carnitine content and oxidative phosphorylation [11] which are affected in turn by salt status and ATP-dependent Na+ transport [13] [14].
The above information is consistent with emerging data that demonstrated physiologic and pathological roles for PPARα in tissues that depend on oxidation of fatty acids for energy production (see [6] [13] [15]), a re-quirement for meeting the metabolic needs of such tissues. We therefore tested in this study, the hypothesis that PPARα plays a major role in triggering fatty acid utilization for adaptive responses to changes in dietary salt in the kidney, heart, and blood vessels. The goal of the present study was to evaluate the role of PPARα and iden-tify the proteins that are differentially expressed in response to high salt diet in PPARα wild type (WT) and knock out (KO) mice. In this study, using MS-based proteomics methodologies to characterize the proteome of mouse tissues harvested from animals given a high salt diet, we identified various candidate proteins including but not limited to those involved in fatty acid metabolism or biogenesis, isoprenoid biosynthesis, collagen syn-thesis, amino acid metabolism, stress response, and DNA synthesis.
2. Materials and Methods
2.1. Experimental Design
This study was approved by the Animal Care Committee of the Texas Southern University and conforms to the institutional guidelines on animal care and use. Age- and weight-matched adult (18 - 22 gm) male PPARα knockout (−/−; KO) mice (Jackson Laboratory, Bar Harbor, ME) or their wild type (129S1/Sv; +/+; WT) litter-mates were used for the study. The animals were maintained in a 12:12-hr light:dark cycle at 23˚C - 25˚C. They were randomly divided into groups (n = 5 - 7 per group) and assigned to normal rat chow (0.3% NaCl diet [normal salt (NS) diet], Harlan Tekland, Houston, USA) or high salt (HS) (4.0% NaCl) diet. These resulted in the following experimental groups:
Group 1 PPARα KO mice (n = 5) placed on normal salt (0.3% NaCl) diet Group 2 PPARα KO mice (n = 6) placed on high salt (4% NaCl) diet Group 3 PPARα WT mice (n = 6) placed on normal salt (0.3% NaCl) diet Group 4 PPARα WT mice (n = 5) placed on high salt (4% NaCl) diet
they were anesthetized (sodium pentobarbital, 60 mg/kg i.p.). Tissues including the kidney, the heart and the blood vessels were collected from each animal and stored at −80˚C until subjected to proteomic analysis. Unless specified otherwise in the text, all chemicals used in this study were obtained from Sigma-Aldrich (St Louis, MO, USA) and are of the highest analytical grade.
2.2. Identification of Differentially Expressed Proteins
A comparative proteomics approach using the two-dimensional difference in gel electrophoresis (2D-DIGE) technology was adopted to identify proteins that showed differential expression as a function of the strains of the mice and salt content of the diet. Briefly, total protein was isolated from each tissue using the protocol described in ToPI-DIGE kit protein isolation kit (ITSI Biosciences, Johnstown, PA). The ToPI-DIGE lysis buffer con-tained 7 M urea, 2 M thiourea, 30 mM TRIS, 4% CHAPS, 5 mM magnesium acetate tetrahydrate and 1% Non-ylphenylpolyethylene Glycol (NP40). Proteins were quantified with the Total Protein Assay kit (ToPA) a Brad-ford-based protein assay reagent (ToPA, ITSI Biosciences, Johnstown, PA) using bovine serum albumin (BSA) as standard. 50 µg of each sample was labeled with 200 pmol of either Cy3 or Cy5 fluorescent dye and an equal amount of each tissue sample was combined in a tube and labeled with Cy2 dye at the same concentration as above. The Cy2 labeled sample served as the universal internal standard to allow normalization and multiple gel comparisons. Equal amounts of the Cy3, Cy5 and Cy2 labeled samples were mixed and subjected to 2D-DIGE as previously described (Somiari et al., 2003). For iso electric focusing (IEF), the labeled samples were loaded on a 24 cm, pH 3 - 11 NL immobilized pH gradient (IPG) strips. The strips were re-hydrated for 12 hours with the sample buffer consisting of 7 M urea, 2 M thiourea, 30 mM TRIS, 4% CHAPS, 5 mM magnesium acetate tetrahydrate and 1% NP40 and focused for 65,000 vhrs. Following IEF, the strips were equilibrated in SDS equilibration buffer (6 M Urea, 30% glycerol, 15 mM TRIS and 2%) and placed on a 24 cm × 20 cm SDS- PAGE gel (12.5%) for second dimension separation. The second dimension separation was carried out at 15 watts/gel for approximately 4.5 hours. The 2D gels were scanned with the Typhoon Trio Variable Mode Imager (GE Healthcare) at there wavelengths to generate Cy2, Cy3 and Cy5 signals. Images were imported into De-Cyder version 6.0 (GE Healthcare) and analyzed with the Difference In-gel Analysis (DIA) and Biological Var-iation Analysis (BVA) modules. Candidate protein spots on the gel that showed statistically significant differ-ence in abundance between the “test” e.g. Cy3 labeled sample and “referdiffer-ence” e.g. Cy5 labeled sample were automatically identified and selected for picking and identification by tandem mass spectrometry.
2.3. Sequencing of Differentially Expressed Proteins by Tandem Mass Spectrometry
The candidate protein spots of interest were picked from preparatory gels with a spot-picking robot (Ettan Spot Picker, GE Healthcare) and in-gel digested using the Ettan Digester (GE Healthcare) proteomics grade trypsin (Promega, Madison, WI) as previously described [16]. Digested peptides were reconstituted with ultra pure wa-ter and sequenced by tandem mass spectrometry to identify the proteins using nano flow capillary Liquid Chro-matography Mass Spectrometry (LC/MS/MS). The LC/MS/MS was carried out with 10 cm nanobore electro-spray column that is constructed from 360 mm o.d., 75 mm i.d. fused silica capillary with the column tip tapered to a 15 mm opening, and packed with 200 Å 5 μm C18 beads (Michrom BioResources, Auburn, CA). The mo-bile phase used for gradient elution consisted of (A) 0.3% acetic acid, 99.7% water and (B) 0.3% acetic acid, 99.7% acetonitrile. The flow through the column was split pre-column to achieve a constant flow rate of 350 nL/min. All the tandem mass spectra were acquired on a Thermo LTQ ion trap mass spectrometer (Thermo Corp., San Jose, CA). Needle voltage was set at 3 kV and ion signals above a predetermined threshold automat-ically triggered the instrument to switch from MS to MS/MS mode for generating fragmentation spectra. The obtained MS/MS spectra were searched against the NCBI non-redundant protein sequence database using the SEQUEST computer algorithm to establish the protein identity [17]. In order to evaluate the interactions of salt and PPARα as well as the global effect of PPARα on genes that are regulated by salt, multimodal comparisons were made for each organ (kidney, heart, or aorta) for genes that are differentially but commonly expressed in the kidney, heart, and the aorta in four groups of WT or KO mice placed on NS or HS diet: 1) WT (NS vs HS diet); 2) WT vs KO (NS diet); 3) WT vs KO (HS diet); 4) KO (NS vs HS diet).
2.4. Analysis
WT and KO mice. Criteria for differential expression were a P < 0.05, a difference > 1.5-fold, and ≥20% ap-pearance of the spots on the gel.
3. Results
3.1. Proteomic Results on Kidney, Heart, and Liver
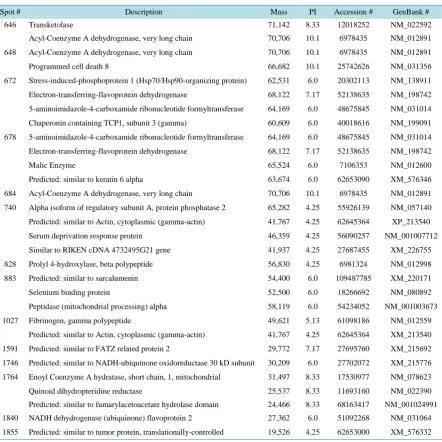
[image:4.595.95.538.252.695.2]Proteomic profiles were compared in the kidney, heart, and aorta of PPARα WT and KO mice fed 0.3% NaCl (NS) or 4% NaCl (HS) diet for 3 weeks. A summary of the throughput of the proteomic analysis is shown in Table 1. Note that a protein might be identified in multiple spots, and changes in individual spots can occur with no change in the total amount of a given protein. Additional information for each differentially expressed protein spot, including standardized gene name, mass, isoelectric points, number of peptide hits, accession numbers (NCBI data base) are also shown.
Table 1. Proteins identified by MS/MS spectra.
Spot # Description Mass PI Accession # GenBank # 646 Transketolase 71,142 8.33 12018252 NM_022592
Acyl-Coenzyme A dehydrogenase, very long chain 70,706 10.1 6978435 NM_012891
648 Acyl-Coenzyme A dehydrogenase, very long chain 70,706 10.1 6978435 NM_012891
Programmed cell death 8 66,682 10.1 25742626 NM_031356
672 Stress-induced-phosphoprotein 1 (Hsp70/Hsp90-organizing protein) 62,531 6.0 20302113 NM_138911
Electron-transferring-flavoprotein dehydrogenase 68,122 7.17 52138635 NM_198742
5-aminoimidazole-4-carboxamide ribonucleotide formyltransferase 64,169 6.0 48675845 NM_031014
Chaperonin containing TCP1, subunit 3 (gamma) 60,609 6.0 40018616 NM_199091
678 5-aminoimidazole-4-carboxamide ribonucleotide formyltransferase 64,169 6.0 48675845 NM_031014
Electron-transferring-flavoprotein dehydrogenase 68,122 7.17 52138635 NM_198742
Malic Enzyme 65,524 6.0 7106353 NM_012600
Predicted: similar to keratin 6 alpha 63,674 6.0 62653090 XM_576346
684 Acyl-Coenzyme A dehydrogenase, very long chain 70,706 10.1 6978435 NM_012891
740 Alpha isoform of regulatory subunit A, protein phosphatase 2 65,282 4.25 55926139 NM_057140
Predicted: similar to Actin, cytoplasmic (gamma-actin) 41,767 4.25 62645364 XP_213540
Serum deprivation response protein 46,359 4.25 56090257 NM_001007712
Similar to RIKEN cDNA 4732495G21 gene 41,937 4.25 27687455 XM_226755
828 Prolyl 4-hydroxylase, beta polypeptide 56,830 4.25 6981324 NM_012998
883 Predicted: similar to sarcalumenin 54,400 6.0 109487785 XM_220171
Selenium binding protein 52,500 6.0 18266692 NM_080892
Peptidase (mitochondrial processing) alpha 58,119 6.0 54234052 NM_001003673
1027 Fibrinogen, gamma polypeptide 49,621 5.13 61098186 NM_012559
Predicted: similar to Actin, cytoplasmic (gamma-actin) 41,767 4.25 62645364 XM_213540
1591 Predicted: similar to FATZ related protein 2 29,772 7.17 27695760 XM_215692
1746 Predicted: similar to NADH-ubiquinone oxidoreductase 30 kD subunit 30,209 6.0 27702072 XM_215776
1764 Enoyl Coenzyme A hydratase, short chain, 1, mitochondrial 31,497 8.33 17530977 NM_078623
Quinoid dihydropteridine reductase 25,537 8.33 11693160 NM_022390 Predicted: similar to fumarylacetoacetate hydrolase domain 24,466 8.33 68163417 NM_001024991 1840 NADH dehydrogenase (ubiquinone) flavoprotein 2 27,362 6.0 51092268 NM_031064
1855 Predicted: similar to tumor protein, translationally-controlled 19,526 4.25 62653000 XM_576332
Based on the criteria of ≥1.5-fold change in expression, ≥20% appearance on the gel, and a P value ≤ 0.05, at least 24 proteins were positively identified from 14 master spots (Table 1). 8 of the master spots contained more than 1 protein, namely, spot #s 646, 648, 672, 678, 740, 883, 1027, and 1764. The proteins identified include those that participate in fatty acid oxidation and mitochondrial electron transport chain e.g. acyl-CoEnzyme A dehydrogenase, transketolase, electron-transferring-flavoprotein dehydrogenase, NADH-ubiquinone oxidore-ductase. The other proteins identified include those involved in other cellular activities not directly related to fatty acid metabolism, e.g. prolyl 4-hydroxylase, program cell death 8, stress-induced-phosphoprotein 1, etc., re-flecting the pleiotropic nature of the PPARα gene. Based on the criterion that proteins identified in more than one master spot are considered unique, there were 4 unique proteins, namely; acyl-CoEnzyme A dehydrogenase, electron-transferring-flavoprotein dehydrogenase, 5-aminoimidazole-4-carboxamide ribonucleotideformyltrans-ferase, and NADH flavoprotein dehydrogenase/ubiquinone-oxidoreductase. Of these, the most unique is acyl- CoEnzymeA dehydrogenase which appeared in three spots, namely; spot numbers 646, 648, and 684.
3.2. Comparison of the Proteomic Profile in PPARα KO and WT Mice on Normal Diet
Table 2shows that in KO and WT mice placed on normal salt diet, proteomic profiling of the kidney, heart, and aorta harvested from these animals revealed a significant differential expression in 4 of the 14 master spots ana-lyzed, namely; spot #s 646, 648, 672, and 678. Compared to tissues from PPARα KO mice, there were increases in proteins in WT mice in spot #s 672 (1.68-fold increase) and 678 (1.95-fold increase). The proteins associated with these spots are: electron-transferring-flavoprotein dehydrogenase (EFTDH) and malate dehydrogenase. On the other hand, there was a decrease in proteins associated with spot #s 646 (−2.41) and 648 (−1.53) namely; acyl-Coenzyme A dehydrogenase and transketolase, respectively.
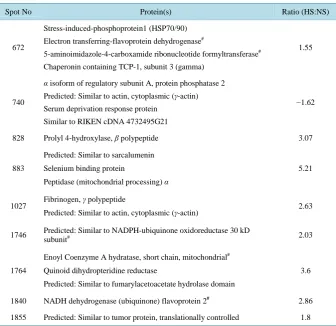
3.3. Effect of High Salt Diet on Proteomic Profile in PPARα WT Mice
When the expression of the different proteins was compared in the kidney, heart, and aorta of PPARα WT mice placed on high or normal salt diet, there was a significant difference in the expression in 9 of the 14 master spots, Table 3. Compared to PPARα WT mice on normal salt, HS diet elicited an increase in proteins associated with 8 of the master spots: 4 of these spots, namely; spot #s 672, 1746, 1764, and 1840 contained proteins involved in fatty acid metabolism, namely; electron-transferring-flavoprotein dehydrogenase, NADPH-ubiquinone oxidore-ductase, enoyl-coenzyme hydratase, and NADH dehydrogenase (ubiquinone) flavoprotein 2. However, there was a down regulation of proteins associated with master spot # 740 which contained proteins that are not in-volved in fatty acid metabolism.
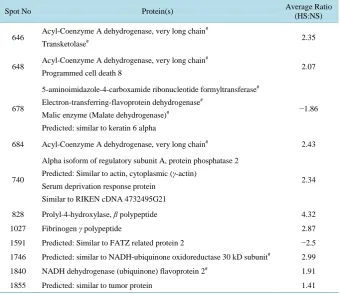
3.4. Proteomic Profile in PPARα KO Mice on High Diet
When the expression of the different proteins was compared in the kidney, heart, and aorta of PPARα KO mice placed on high versus normal salt diet,Table 4 shows that HS diet in KO mice led to a significant difference in the expression of the proteins in 11 of the 14 master spots. The three spots that did not show significance in ex-pression were spot #s 672, 883, and 1764. Compared to PPARα KO mice placed on normal salt diet, HS diet elicited an increase of proteins associated with 10 of the master spots, namely; spot #s 646, 648, 678, 684, 740, 828, 1027, 1591, 1746, 1840, and 1855. Only 5 of these spots, namely: spot #s 646, 648, 684, 1746, and 1840 contained proteins that are directly involved in fatty acid metabolism. These are: acyl-Coenzyme A dehydroge-nase (spot #s 646, 648, 684), NADPH-ubiquinone oxidoreductase, and NADH dehydrogedehydroge-nase (ubiquinone) fla-voprotein 2. There was a decrease in the level of proteins associated with spot #678 i.e. electron transferring- flavoprotein dehydrogenase.
3.5. Comparison of the Effect of High Salt Diet on Proteomic Profile in PPARα KO and WT
Mice
Comparison of the effect of high salt diet on proteomic profile in PPARα KO and WT mice
Table 2. Spots in tissues from WT or KO mice placed on 3% NaCl.
Spot No Protein(s) Ratio (KO:WT)
646 Acyl-Coenzyme A dehydrogenase, very long chain #
Transketolase# −2.41
648 Acyl-Coenzyme A dehydrogenase, very long chain #
Programmed cell death 8 −1.53
672
Stress-induced-phosphoprotein1 (HSP70/90) Electron transferring-flavoprotein dehydrogenase#
5-aminoimidazole-4-carboxamide ribonucleotideformyltransferase# Chaperonin containing TCP-1, subunit 3 (gamma)
1.68
678
5-aminoimidazole-4-carboxamide ribonucleotideformyltransferase# Electron-transferring-flavoprotein dehydrogenase#
Malic enzyme (Malate dehydrogenase)# Predicted: similar to keratin 6 alpha
1.95
Spots that showed significant differences in protein levels in the gel samples in tissues harvested from WT or KO mice placed on 0.3% NaCl (normal salt) diet. The average ratio of the levels of the proteins in KO relative to WT mice is presented: + indicates increase; − indicates decrease; # indicates proteins that are directly involved in fat-ty acid oxidation.
Table 3. Spots in tissues from WT mice.
Spot No Protein(s) Ratio (HS:NS)
672
Stress-induced-phosphoprotein1 (HSP70/90) Electron transferring-flavoprotein dehydrogenase#
5-aminoimidazole-4-carboxamide ribonucleotide formyltransferase# Chaperonin containing TCP-1, subunit 3 (gamma)
1.55
740
α isoform of regulatory subunit A, protein phosphatase 2 Predicted: Similar to actin, cytoplasmic (γ-actin) Serum deprivation response protein
Similar to RIKEN cDNA 4732495G21
−1.62
828 Prolyl 4-hydroxylase, β polypeptide 3.07
883
Predicted: Similar to sarcalumenin Selenium binding protein
Peptidase (mitochondrial processing) α
5.21
1027 Fibrinogen, γ polypeptide
Predicted: Similar to actin, cytoplasmic (γ-actin) 2.63
1746 Predicted: Similar to NADPH-ubiquinone oxidoreductase 30 kD
subunit# 2.03
1764
Enoyl Coenzyme A hydratase, short chain, mitochondrial#
Quinoid dihydropteridine reductase
Predicted: Similar to fumarylacetoacetate hydrolase domain
3.6
1840 NADH dehydrogenase (ubiquinone) flavoprotein 2# 2.86
1855 Predicted: Similar to tumor protein, translationally controlled 1.8
[image:6.595.145.482.356.682.2]Table 4. Spots in tissues from KO mice.
Spot No Protein(s) Average Ratio
(HS:NS)
646 Acyl-Coenzyme A dehydrogenase, very long chain #
Transketolase# 2.35
648 Acyl-Coenzyme A dehydrogenase, very long chain #
Programmed cell death 8 2.07
678
5-aminoimidazole-4-carboxamide ribonucleotide formyltransferase# Electron-transferring-flavoprotein dehydrogenase#
Malic enzyme (Malate dehydrogenase)# Predicted: similar to keratin 6 alpha
−1.86
684 Acyl-Coenzyme A dehydrogenase, very long chain# 2.43
740
Alpha isoform of regulatory subunit A, protein phosphatase 2 Predicted: Similar to actin, cytoplasmic (γ-actin)
Serum deprivation response protein Similar to RIKEN cDNA 4732495G21
2.34
828 Prolyl-4-hydroxylase, β polypeptide 4.32
1027 Fibrinogen γ polypeptide 2.87
1591 Predicted: Similar to FATZ related protein 2 −2.5
1746 Predicted: similar to NADH-ubiquinone oxidoreductase 30 kD subunit# 2.99
1840 NADH dehydrogenase (ubiquinone) flavoprotein 2# 1.91
1855 Predicted: similar to tumor protein 1.41
The spots that showed significant differences in tissues from KO mice placed on 0.3% (normal, NS) or 4% NaCl (high salt, HS) diet. The average ratio of the levels of the proteins in mice placed on HS diet is presented: + indi-cates increase; − indiindi-cates decrease; # indiindi-cates proteins that are directly involved in fatty acid oxidation.
Table 5. Spots in tissues from WT or KO mice placed on 4% NaCl.
Spot No Protein(s) Ratio (WT: KO)
648 Acyl-Coenzyme A dehydrogenase, very long chain #
Programmed cell death 8 1.61
740
Alpha isoform of regulatory subunit A, protein phosphatase 2 Predicted: Similar to actin, cytoplasmic (γ-actin)
Serum deprivation response protein Similar to RIKEN cDNA 4732495G21
2.78
1591 Predicted: Similar to FATZ related protein 2 −1.45
The spots that showed significant differences in protein levels in tissues from WT or KO mice placed on 4% NaCl in (high salt, HS) diet. The average ratio of the levels of the proteins in mice placed on HS diet is presented: + indicates increase; − indicates decrease; # indicates proteins that are directly involved in fatty acid oxidation.
and 740 (2.78-fold). The only protein of significance in relation to fatty acid metabolism is acyl-Coenzyme A dehydrogenase (spot # 648).
4. Discussion
[image:7.595.142.488.447.566.2]energy metabolism, and cytoskeleton. These include heat shock protein e.g. HSP70/90, mitochondrial enzymes, transcriptional factors, structural proteins such as prolyl 4-hydroxylase and others.
PPARα is well characterized in cardiovascular tissues/organs including the heart, blood vessel, and kidney. A protective role has long been established for PPARα in the heart and blood vessel [2] [18] but only recently in the kidney where studies demonstrated that PPARα KO mice were more prone to renal ischemia-reperfusion (I/R) injury than their WT counterparts [19]. In a follow up study, increased renal fatty acid oxidation was sug-gested to be a cytoprotective mechanism during cisplatin-mediated nephrotoxicity [20]. In a recent study, we established a role for PPARα in renal function and provided evidence that PPARα gene is salt-responsive in as much as PPARα KO mice had an impaired ability to excrete a saline load [21]. The current study evaluated the effect of high salt diet and the resulting differential in the profile of proteins in organs from PPARα KO and WT mice as a means to providing an insight into the molecular mechanisms involved in salt-sensitivity as related to the status of PPARα expression and/or fatty acid oxidation.
Fatty acid oxidation was long known to be important in organs with high metabolism such as the heart, liver, blood vessels [2]. Considering the widely recognized protective role for PPARα in the cardiovascular system [2] [18], we hypothesized that increased salt load will result in adaptive changes in proteins associated with in-creased fatty acid oxidation and mitochondrial electron transport chain as a means to handling an excessive so-dium load and thereby limiting the injury that may result from a greater than normal soso-dium intake. Thus, pro-teins associated with fatty acid oxidation will respond with a greater increase to HS diet in WT and KO mice. A priori, reduced fatty acid oxidation compromises the body’s ability to adequately carry out normal functions and by extension the body’s ability to mitigate against the effects of deleterious injury as seen in exacerbation of renal I/R injury [22] and impaired ability to excrete a saline load [21] in PPARα null mice. Proteomic analysis of the kidney, heart, and aorta of animals exposed to high salt diet in this study revealed a differential expression of 24 proteins. On account of their appearance in more than 1 spot, four of these proteins are considered unique These are: acyl-CoEnzyme A dehydrogenase (MCAD) which is involved in the first step of beta oxidation of fatty acid metabolism during which acyl-coA is converted to enoyl-coA, electron-transferring-flavoprotein de-hydrogenase (EFTDH), a third entry point to the electron transport chain which accepts electrons from electron- transferring-flavoprotein in the mitochondrial matrix and uses them to reduce ubiquinone in the inner mitochon-drial membrane [23] thereby helping to build the electrochemical potential used to produce ATP. The other unique proteins are: 5-aminoimidazole-4-carboxamide ribonucleotide (AICAR) formyltransferase, a bifunctional enzyme that catalyzes the last two steps in the de novo purine biosynthetic nucleotide pathway, NADPH-ubi- quinone-oxidoreductase and NADH dehydrogenase (also known as NADH-coenzyme Q oxidoreductase or complex I), the first protein in the electron transport chain that is involved in the two electron reduction by NADH of coenzyme Q10 or ubiquinone [24].
The present study focused on proteins that are directly associated with fatty acid oxidation. Thus, comparison between tissues from WT and KO mice placed on NS diet revealed a surprising decrease in protein levels of acyl-Coenzyme A dehydrogenase and transketolase in WT mice, an observation at odds with our hypothesis and inconsistent with an intact PPARα gene in WT mice to effect metabolism of long chain fatty acids. By contrast, there were increases in the levels of malic enzyme, EFTDH, and AICAR in KO mice as expected. Malic enzyme is involved in the oxidative decarboxylation of malate to produce pyruvate and CO2 coupled with the reduction
signifi-cantly altered while that of AICAR formyltransferase, ETFDH, and malic enzyme was decreased in KO mice, indicating the coupling of these other proteins to the PPARα gene. Comparing the spectrum of the proteomic profile of WT and KO mice placed on HS diet, Table 5, acyl-Coenzyme A dehydrogenase was the only fatty acid oxidation-related protein that was increased in response to HS diet. This suggests a pivotal role for this en-zyme involved in the 1st step of fatty acid oxidation as the frontline enzymatic reaction protecting the body from injurious stimuli.
The increase in FAO enzyme in response to HS diet in this study is in agreement with the findings that HS di-et affected a number of proteins in the Dahl salt-sensitive rat kidney including fumarate hydratase and other proteins involved in the metabolism of fatty acids [25]-[27]. The similarity in the profile of these proteins in the present study and the studies by Tian et al. [25] suggests that these differentially expressed proteins might con-tribute to the differences in the susceptibility to injurious stimuli in PPARα KO mice as it does in Dahl salt-sen- sitive rats. Proteomic studies also have revealed changes in the heart of diet-induced pre-diabetic mice [28]. The significance of our study is that it demonstrated a role for PPARα in the body’s adaptive (protective) responses to changes in dietary salt in organs such as the heart, liver and kidney that depend on FAO for energy production. High salt diet is known to increase blood pressure in people that have salt-sensitive hypertension and our pre-vious study showed that absence of PPARα gene leads to lack of its renal protective effect rendering the kidneys more injury-prone and interfering with the normal reabsorptive capacity of the kidney. This therefore leads to reduced sodium excretion and higher blood pressure in PPARα KO mice [21]. The significance of this proteo-mic study is the possible use of gene therapy (PPARα gene) in the management of cardiovascular disease.
5. Conclusion
PPARα appears to be a salt-responsive gene controlling multiple gene targets through changes in the expression of different proteins that mitigate any possible injury to the heart, kidney, and the blood vessel. These multiple proteins and/or targets involve fatty acid oxidation, lipid and amino acid metabolism, and other cellular path-ways that serve critical protective roles in the body.
References
[1] Lemberger, T., Desvergne, B. and Wahli, W. (1996) Peroxisome Proliferator Activated Receptors: A Nuclear Receptor Signaling Pathway in Lipid Physiology. Annual Review of Cell and Developmental Biology, 12, 335-363.
http://dx.doi.org/10.1146/annurev.cellbio.12.1.335
[2] Bishop-Bailey, D. (2000) Peroxisome Proliferator-Activated Receptors in the Cardiovascular System. British Journal of Pharmacology, 129, 823-834. http://dx.doi.org/10.1038/sj.bjp.0703149
[3] Yang, T., Michele, D.E., Park, J., Smart, A.M., Lin, Z., Brosius III, F.C., Schnermann, J.B. and Briggs, J.P. (1999) Ex-pression of Peroxisomal Proliferator-Activated Receptors and Retinoid X Receptors in the Kidney. American Journal of Physiology, 277, 966-973.
[4] Guan, J. (2002) Targeting Peroxisome Proliferator-Activated Receptors (PPARα) in Kidney and Urologic Disease.
Minerva Urologica e Nefrologica, 54, 65-79.
[5] Guan, Y., Zhang, Y., Davis, L. and Breyer, M.D. (1997) Expression of Peroxisome Proliferator-Activated Receptors in Urinary Tract of Rabbits and Humans. American Journal of Physiology, 273, 1013-1022.
[6] Djouadi, F. and Bastin, J. (2001) PPARα Gene Expression in the Developing Rat Kidney: Role of Glucocorticoids.
Journal of the American Society of Nephrology, 12, 1197-1203.
[7] Hashimoto, T. (1999) Peroxisomal β-Oxidation Enzymes. Neurochemical Research, 24, 551-563. http://dx.doi.org/10.1023/A:1022540030918
[8] Reddy, J.K. and Mannaerts, G.P. (1994) Peroxisomal Lipid Metabolism. Annual Review of Nutrition, 14, 343-370. http://dx.doi.org/10.1146/annurev.nu.14.070194.002015
[9] Aoyama, T., Peters, J.M., Iritani, N., Nakajima, T., Furihata, K., Hashimoto, T. and Gonzalez, F.J. (1998) Altered Constitutive Expression of Fatty Acid-Metabolizing Enzymes in Mice Lacking the Peroxisome Proliferator-Activated Receptor Alpha (PPAR). Journal of Biological Chemistry, 273, 5678-5684. http://dx.doi.org/10.1074/jbc.273.10.5678 [10] Hashimoto, T., Fujita, T., Usuda, N., Cook, W., Qi, C., Peters, J.M., Gonzalez, F.J., Yeldandi, A.V., Rao, M.S. and
[11] Ockner, R.K., Kaikaus, R. and Bass, N.M. (1993) Fatty-Acid Metabolism and the Pathogenesis of Hepatocellular Car-cinoma: Review and Hypothesis. Hepatology, 18, 669-676. http://dx.doi.org/10.1002/hep.1840180327
[12] Formenty, B. and Pessayre, D. (1995) Inhibition of Mitochondrial Beta-Oxidation as a Mechanism of Hepatotoxicity.
Pharmacology & Therapeutics, 67, 101-154. http://dx.doi.org/10.1016/0163-7258(95)00012-6
[13] Ghadiminejad, I. and Saggerson, D. (1992) Physiological State and the Sensitivity of Liver Mitochondrial Outer Mem-brane Carnitine Palmitoyltransferase to Malonyl-CoA. Correlations with Assay Temperature, Salt Concentration and Membrane Lipid Composition. International Journal of Biochemistry, 24, 1117-1124.
[14] Rachamim, N., Latter, H., Malinin, N., Asher, C., Wald, H. and Garty, H. (1995) Dexamethasone Enhances Expression of Mitochondrial Oxidative Phosphorylation Genes in Rat Distal Colon. American Journal of Physiology, 269, C1305- C1310.
[15] Wirthensohn, G. and Guder, W.G. (1983) Renal Lipid Metabolism. Mineral Electrolyte Metabolism, 9, 203-211. [16] Somiari, R.I., Sullivan, A., Russell, S., Somiari, S., Hu, H., Jordan, R., George, A., Katenhusen, R., Buchowiecka, A.,
Arciero, C., Brzeski, H., Hooke, J. and Shriver, C. (2003) High-Throughput Proteomic Analysis of Human Infiltrating Ductal Carcinoma of the Breast. Proteomics, 3, 1863-1873. http://dx.doi.org/10.1002/pmic.200300560
[17] Yates, J.R.D., Eng, J.K., McCormack, A.L. and Schieltz, D. (1995) Method to Correlate Tandem Mass Spectra of Modified Peptides to Amino Acid Sequences in the Protein Database. Analytical Chemistry, 67, 1426-1436.
http://dx.doi.org/10.1021/ac00104a020
[18] Braissant, O., Foufelle, F., Scotto, C., Dauca, M. and Wahli, W. (1996) Differential Expression of Peroxisome Prolife-rator-Activated Receptors (PPARα): Tissue Distribution of PPAR-α, -β, and -γ in the Adult Rat. Endocrinology, 137, 354-366.
[19] Portilla, D., Dai, G., Peters, J.M., Gonzalez, F.J., Crew, M.D. and Proia, A.D. (2000) Etomoxir-Induced PPAR -Modulated Enzymes Protects during Acute Renal Failure. American Journal of Physiology—Renal Physiology, 278, F667-F675.
[20] Li, S., Wu, P., Yarlagadda, P., Vadjunec, N.M., Proia, A.D, Harris, R.A. and Portilla, D. (2004) PPARα Ligand Pro-tects during Cisplatin Induced Acute Renal Failure by Preventing Inhibition of Renal FAO and PDC Activity. Ameri-can Journal of Physiology-Renal Physiology, 286, F572-F580. http://dx.doi.org/10.1152/ajprenal.00190.2003
[21] Obih, P. and Oyekan, A.O. (2008) Regulation of Blood Pressure, Natriuresis and Renal Thiazide/Amiloride Sensitivity in PPARα Null Mice. Blood Pressure, 17, 55-63.
[22] Negishi, K., Noiri, E., Sugaya, T., Li, S., Megyesi, J., Nagothu, K. and Portilla, D. (2007) A Role of Liver Fatty Acid- Binding Protein in Cisplatin-Induced Acute Renal Failure. Kidney International, 72, 348-358.
[23] Ramsay, R.R., Steenkamp, D.J. and Husain, M. (1987) Reactions of Electron-Transfer Flavoprotein and Electron- Transfer Flavoprotein: Ubiquinone Oxidoreductase.Biochemical Journal, 241, 883-892.
[24] Hirst, J. (2005) Energy Transduction by Respiratory Complex I—An Evaluation of Current Knowledge. Biochemical Society Transactions, 33, 525-529. http://dx.doi.org/10.1042/BST0330525
[25] Tian, Z., Greene, A.S., Usa, K., Matus, I.R., Bauwens, J., Pietrusz, J.L., Cowley Jr., A.W. and Liang, M. (2008) Renal Regional Proteomes in Young Dahl Salt-Sensitive Rats. Hypertension, 51, 899-904.
http://dx.doi.org/10.1161/HYPERTENSIONAHA.107.109173
[26] Grussenmeyer, T., Meili-Butz, S., Roth, V., Dieterle, T., Brink, M., Matt, P., Carrel, T.P., Eckstein, F.S., Lefkpovits, I. and Grapow, M.T. (2011) Proteome Analysis in Cardiovascular Pathology Using Dahl Rat Model. Journal of Proteo-mics, 74, 672-682.
[27] Zheleznova, N.N., Yang, C., Ryan, R.P., Halligan, B.D., Liang, M., Greene, A.S. and Cowley Jr., A.W. (2012) Mito-chondrial Proteomic Analysis Reveals Deficiencies in Oxygen Utilization in Medullary Thick Ascending Limb of Henle in Dahl Salt-Sensitive Rat. Physiological Genomics, 44, 839-842.
http://dx.doi.org/10.1152/physiolgenomics.00060.2012