Survey of Soil Water Distribution in a Vineyard
and Implications for Subsurface Drip Irrigation Control
Reinhard NOLZ, Willibald LOISKANDL, Gerhard KAMMERER
and Margarita L. HIMMELBAUER
Department of Water, Atmosphere and Environment, Institute of Hydraulics and Rural Water Management, University of Natural Resources and Life Sciences, Vienna, Austria
Abstract
Nolz R., Loiskandl W., Kammerer G., Himmelbauer M.L. (2016): Survey of soil water distribution in a vineyard and implications for subsurface drip irrigation control. Soil & Water Res., 11: 250−258.
Controlling a subsurface drip irrigation system based on soil water monitoring is a very efficient way to supply grapevines with water for optimal thriving and high vintage quality. However, finding an adequate location for sensor installation is a great challenge due to the well-known spatio-temporal variability of soil moisture and possible measurement uncertainties. The variations depend on soil structure, soil hydraulic properties, or plant water uptake, for instance. Subsequently, these factors are influenced by management practices such as soil cultivation or cover cropping. The main objective of this study was to gain experience in order to give recom-mendations for soil water monitoring in a vineyard in accordance to local management practices. Soil moisture was surveyed across a study plot in a vineyard. A gouge auger was used to obtain soil samples from both sides of two vine rows for determining gravimetric water content. Volumetric soil water content was measured near the vine rows by inserting a portable soil water probe into pre-installed access tubes. Soil water variability was investigated under rain-fed conditions, and before and after a subsurface drip irrigation event. Differences were considered between inter-rows that were frequently tilled and those with permanent crop cover. In the first of two study years the variability of soil water content was small as the soil characteristics were relatively homo-geneous across the plot and the atmospheric conditions were rather wet. In the second year the deviations were greater due to the more dynamic outer conditions. The alternating cultivation of every second inter-row had a substantial effect on soil water distribution in both years. Representative monitoring across the entire plot should thus consider all inter-rows with distinct cultivation. However, a more efficient procedure is recommended as a basis for irrigation control, considering the uncertainties caused by spatial variability.
Keywords: gravimetric water content; Sentek Diviner; spatio-temporal variability; volumetric water content
Availability of water is vital for plant growth and development. For agricultural production optimal conditions are aspired to achieve yield stability and a good product quality (Allen etal. 1998). Grapevines – like other crops – have specific water requirements. While excessive rainfall (and irrigation) as well as severe water deficit stress are expected to reduce grape quality, moderate stress commonly supports an improved vintage quality (Van Leeuwen et al. 2009; Ruiz-Sanchez et al. 2010). An excellent quality is of particular importance when grapes are cultivated
for high-quality wine production. In this regard, an adequate irrigation management – combining an efficient irrigation system with demand-oriented scheduling – is required to optimally provide plants with water.
ef-ficiently only if soil surface is maintained dry (thus avoiding unproductive water losses arising from bare soil evaporation), and the applied amount of water does not exceed the water holding capacity of the soil within the rooting zone. Otherwise, water will percolate towards deeper zones that are out of reach for roots (Ayars etal. 1999). Therefore, it is beneficial to monitor soil water content and keep it within a range that is optimal for winegrowing according to conventional approaches or special deficit irrigation strategies that have the potential to increase both yield quality and water use efficiency (De la Hera et al. 2007; Intrigliolo & Castel 2008, 2009; Ruiz-Sanchez et al. 2010). More and more Austrian farmers and winegrowers consider controlling irrigation based on sensor readings. Due to the lack of experience no clear recommendations can be given in accordance to local management practices (e.g. inter-row cropping) under varying weather conditions. This problem was the main motivation for this study.
A central challenge when installing soil water sensors is to find a suitable place. From a practical point of view this means that fieldwork, tillage op-erations, and maintenance of the irrigation system should remain unconcerned. Of equal importance is that sensor readings adequately represent soil water dynamics of the considered area. In this regard, the well-known spatial and temporal variability of soil moisture regularly causes inconveniences. The variations follow physical principles that depend on soil characteristics, soil hydraulic properties, topography, and boundary conditions such as at-mospheric processes and plant water uptake (Starr 2005; Vereecken et al. 2008). In a natural environ-ment the influencing parameters are interrelated with considerable complexity and they change with time. Water transport and storage mainly depend on soil hydraulic properties, which are closely related to structure (pore size distribution) and to a minor extent to texture (particle size distribution). Soil texture is generally time-invariant unless layers with different soil types are mixed artificially. In contrast, soil structure is highly dynamic due to root activity, tillage operations, swelling and shrinking processes, and frost action (e.g. Jury et al. 1991; Evett et al. 2009). Apart from their temporal dynamics these processes produce heterogeneous soil conditions. Further variability of soil moisture is induced by uneven distribution of irrigation water, which is particularly critical when operating an SDI system
(Camp 1998; Dabach et al. 2015). In vineyards also the cultivation of the inter-rows – e.g. traditional tillage, cover cropping, mulching – is supposed to have an impact on soil water distribution (Celette
et al. 2008; Medrano et al. 2015).
In the presented study, soil water variability was investigated in a vineyard managed according to lo-cal practices aiming at soil and water conservation. Soil-water related actions included on the one hand occasional tillage of the uppermost soil layer of every second inter-row, and on the other hand irrigation by means of subsurface drip lines. The investiga-tions were concentrated on periods with different hydrological conditions in the years 2010 (annual precipitation: 775 mm) and 2011(450 mm). The first study year was characterized by frequent rainfall, so soil was sufficiently moist and no irrigation was required. Under such conditions, soil water distribu-tion was assumed to arise mainly from water uptake by the grapevines and from soil attributes that were relatively homogeneous within the study plot. Another focus was set on soil moisture variability before and after an irrigation event, which could be investigated in the subsequent dry year. Furthermore, it turned out that the different conditions in the inter-rows considerably affected soil water distribution. From the findings recommendations can be concluded with respect to installation and operation of soil water sensors for controlling a SDI system.
MATERIAL AND METHODS
Site description. The study plot was located within a vineyard in the eastern part of Austria (47°48'16''N, 17°01'57''E). Its elevation of 118 m is almost the low-est in Austria, the absolutely lowlow-est (114 m) lies in the same flat region.
The site is hydrologically characterized by an average annual temperature of 10.6°C and an annual precipita-tion of 570 mm (referring to the period 1996–2011). Rainfall and air temperature were measured at a weather monitoring station at a 3 km distance (op-erated by the Central Institute for Meteorology and Geodynamics, Austria, ZAMG) and also directly on the study plot using a Vaisala WXT 520 sensor (Vaisala Oyj, Helsinki, Finland) that was integrated into a wireless network (Nolz & Cepuder 2011).
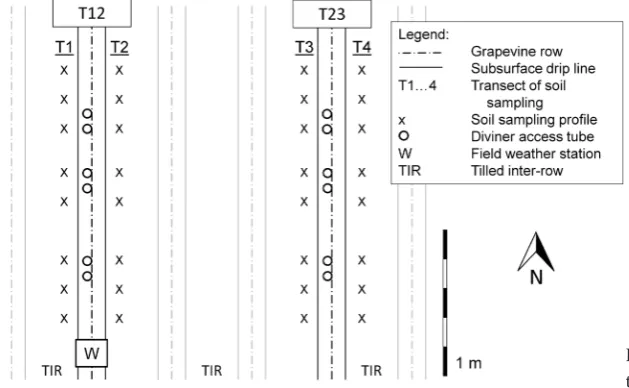
The tubes were 16 mm in diameter and comprised one pressure-compensating emitter per running meter with an outflow rate of 2.2 l/h. The study area surrounded six vine rows with 2.8 m spacing and five inter-rows, of which every second was oc-casionally cultivated (Figure 1). The rows were N–S oriented. Two vine rows were selected for the study and equipped with access tubes for soil water mea-surements.
Soil sampling in the field. Disturbed soil samples were taken for the determination of particle size distribution and gravimetric water content. Insertion spots for a gouge auger were arranged along four transects (T1, T2, T3, and T4) in parallel to the vine rows at a distance of 1 m to the latter and 0.5 m to the respective drip line (Figure 1). Eight profiles per transect were sampled. The sampling points for the replications were positioned in relation to the drip line with an estimated accuracy of 0.1 m. Each soil profile was separated into six increments, whereof the first was from 5 to 15 cm and referred to a 10 cm depth; the sixth and last was from 55 to 65 cm and referred to a 60 cm depth.
In 2010 the vineyard was not irrigated and three sampling dates were set forming similar time in-tervals: June 29, August 11, and October 1. In 2011 soil samples were taken on July 12, 14, and 16. On July 13 the vineyard was subsurface drip irrigated. The first sampling day was immediately before the irrigation event, the others shortly after it.
Soil analyses in the laboratory. Particle size dis-tribution was determined using the soil material from the first year. Samples of each depth from around the access tubes were mixed, resulting in 36 pooled samples (six layers of six mixed profiles). The soil
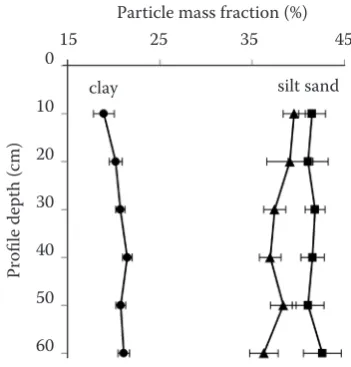
samples were fractionated using a wet sieving and a pipette method. The soil was classified as sandy loam according to the Austrian texture nomenclature with a fine fraction of 41% sand (2 mm > d ≥ 0.063 mm), 38% silt, and 21% clay. Particle size distribution was relatively homogeneous within the study plot and over depth (Figure 2): The maximum coefficient of variation was 6.4%, which is rather small compared to the potential range of 3 to 55% according to Jury
etal. (1991).
Further soil analyses discovered 2% humus content in topsoil, an average dry bulk density of 1.46 g/cm3, a particle density of 2.67 g/cm3, and a total porosity estimated from the former of 0.45 cm3/cm3.
For analyzing soil moisture the disturbed samples were weighed, dried at 105°C until mass remained constant, and weighed again. Gravimetric water con-tent w was calculated as (vaporized) mass of water (in g) divided by dry soil mass (in g), it is expressed in percent (%), being the same as g/g ×100.
Soil water sensing. A Diviner 2000 soil moisture probe (Sentek Pty Ltd, Stepney, Australia) was used to measure volumetric water content θ over mul-tiple depths. The Diviner is a portable device with a hand-held logger and a capacitance sensor that is inserted into a plastic access tube (Sentek 2009). Its performance is well documented in literature (e.g. Evett et al. 2006, 2009). The sensor consists of two encapsulated metal rings. They are parts of a highly oscillating circuit and span an electromagnetic field in the surrounding soil. The oscillation frequency is influenced by the amount of water in the adjacent volume of soil. Therefore sensor readings can be related to θ via a soil-specific calibration function (Sentek 2001, 2009). Sensor readings were
[image:3.595.65.380.562.756.2]ized to a so-called Scaled Frequency SF = (Fa – Fs)/ (Fa – Fw). Sensor-specific readings in air (Fa) and water (Fw) were determined for each sensor in the laboratory, Fs is the frequency reading in moist soil. θ was calculated from SF using the default calibration
SF (θ) = 0.2746·θ 0.3314 as recommended by the manu-facturer (Sentek 2001). It has to be noted that without site-specific calibration water content data might differ from values determined with core samples. However, in this study only comparative analyses are presented. θ is defined as volume of water per bulk volume of soil (cm3/cm3). In this paper sensor data are expressed in percent (%), which can also be interpreted as cm3/cm3 × 100.
In total twelve plastic access tubes were installed at the study site (Figure 1). The rows were named T12 and T34, illustrating their positioning in rela-tion to the transects of auger sampling. The access tubes were vertically drilled into the ground between the vine row and the adjacent drip line at a lateral distance of 0.2 m to the first and 0.3 m to the lat-ter. In accordance with the auger sampling, θ was measured at 10, 20, 30, 40, 50, and 60 cm depths, of which each value represented a soil increment of 10 cm height (5–15 cm and so on).
Data evaluation. The basics for this study are the datasets of w from auger sampling and θ from sensor measurements. In the following sections different ways of averaging w and θ are distinguished in order to illustrate differences referring to depth increments, profiles, or transects. Furthermore, standard devia-tions (SD) were calculated to point out uncertainties between depth increments and transects due to spatial variability and (to a lesser extent) due to measurement errors. SD is also the basis for estimating errors on a certain confidence interval (e.g., 2-σ-error on a 95% confidence interval). As a precondition for the de-termination of SD, data were verified to be normally distributed by applying the Shapiro-Wilk test utilizing
the open source statistical software R (R Develop-ment Core Team 2008). Shapiro-Wilk has proven to be a powerful normality test for sample sizes n > 3 (e.g., Razali & Wah 2011). The processed datasets contained 8–48 values.
For the 2010 dataset, the average gravimetric water content for a certain depth and transect wat was calcu-lated as the arithmetic mean of the values representing the corresponding depth increment of the eight sam-pling profiles. Analogously, SDwat was calculated from the eight respective values. The gravimetric profile water content wap is the arithmetic mean of the six increment values of a certain profile. The gravimetric transect water content wpt is the arithmetic mean of eight profile water contents wap of a certain transect. Deviations between the eight profile water contents of a transect are expressed by SDwpt. For the 2011 data only wpt and the respective SDwpt was determined.
[image:4.595.329.505.94.278.2]The average volumetric water content for a cer-tain depth and transect (row) θat was calculated Figure 2. Particle size distribution over depth; bars repre-sent standard deviation
Table 1. Overview of water content data from 2010 w (soil sampling)
4 transects θ (sensor readings)2 transects (rows)
Average water content
(index at) of 8 (horizontal) depth increments6 wat values per transect: mean of 6 (horizontal) sensor readings6 θat values per transect: mean Profile water content
(index ap) of 6 (vertical) depth increments8 wap values per transect: mean 6 θof 6 (vertical) sensor readingsap values per transect: mean Transect water content
(index pt) of 8 profiles and 6 depth increments1 wpt value per transect: mean of 6 profiles and 6 sensor readings 1 θpt value per transect: mean
w − gravimetric water content; θ − volumetric water content
Particle mass fraction (%)
Pr
ofile de
pt
h (
cm)
0
10
20
30
40
50
60
15 25 35 45
[image:4.595.61.534.639.742.2]as the arithmetic mean of the sensor readings at the corresponding depth of the six access tubes. The corresponding SDθat was calculated from the six respective values. The volumetric profile water content θap is the arithmetic mean of the six sensor readings of a certain profile. The volumetric tran-sect water content θpt is the arithmetic mean of six volumetric profile water contents of a certain tran-sect. The measurement dates were the same as for the soil sampling. Due to a failure, data of only ten measurement profiles could be used from 2011. The deviations between the six θap values of a transect are expressed by SDθpt.
A paired, two-sided t-test was used to check if differences of wpt and θpt were significant based on
a 95% confidence interval (P > 0.05). The test was executed using R software (R Development Core Team 2008).
RESULTS AND DISCUSSION
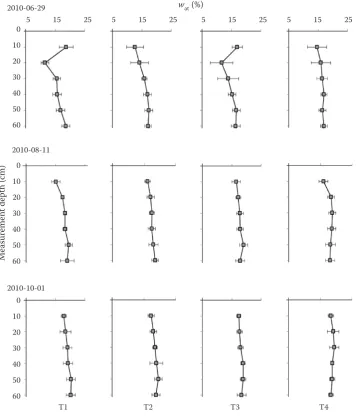
[image:5.595.124.481.311.728.2]The year 2010 was wetter than average: frequent rainfall produced moist soil conditions throughout the vegetative period, no irrigation was applied. Figure 3 illustrates wat and SDwat for all depths and transects at the three measurement dates. Vertical soil water distribution was relatively uniform, except for T1 and T3 on June 29. The non-uniform distribu-tions were induced by unintended compaction of the uppermost soil layer that obviously had an impact
Figure 3. Temporal and spatial distribution of average gravimetric water content (wat) measured in profiles along transects T1, T2, T3, and T4 at three dates in 2010
wat (%)
0 10 20 30 40 50 60
5 15 25 2010-06-29
T1 T2 T3 T4
M
ea
sur
emen
t de
pt
h (
cm) 100
20 30 40 50 60
0 10 20 30 40 50 60
5 15 25 5 15 25
2010-08-11
2010-10-01
on pore size distribution and surface roughness. However, the relation between wap values of the four transects was similar at all dates (data not shown), so all profiles were considered for calculating wpt
without restriction for further interpretation. After the first sampling date, the topsoil was tilled and the mentioned influence was eliminated. The mean over six depths, four transects, and three dates of 6 × 4 × 3 SDwat values was ± 1.5%, considering only the second and third sampling date it was ± 1.2%.
The wpt showed a considerable spatial variability, at which T1 and T4 were (partly significantly) larger than T2 and T3 (Figure 4a). The most likely expla-nation for the wetter soil in T1 and T4 is that till-ing the topsoil in the respective inter-row reduced weed growth and thus water uptake. For a better com-parison with sensor measurements of T12 and T34,
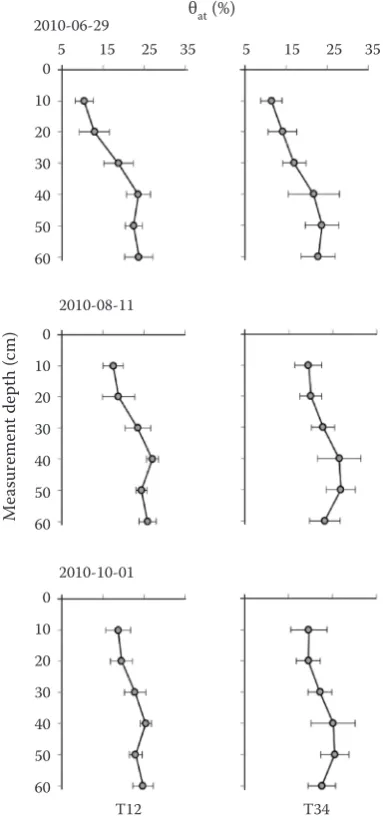
[image:6.595.85.525.97.255.2]wpt values from both sides of a vine row (T1 and T2; T3 and T4) were averaged. The result is given in Fig-ure 4b. The average of T12 was not significantly different from T34, suggesting similar water uptake near both investigated rows of grapevines. Mean wpt values of four transects at the three dates were 15.8, 17.7, and 18.7%. The respective SDwpt values were ± 0.9, ± 0.7, and ± 0.8% (± 0.8% on average). The absolute increase from one measurement date to the other was 1.9 and 1.0%. Volumetric water content θ showed a more distinct distribution over depth (Figure 5) than w values (Fig-ure 3). θ was smaller in the upper soil layers and in-creased to a maximum at a depth of 40–50 cm. The mean over six depths, two transects, and three dates of 6 × 2 × 3 SDθat values was ± 3.1%, expressing a con-siderably greater variability of sensor measurements compared to gravimetric samples. Such a large variance can complicate the analysis and interpretation of θ data.
Figure 4. Gravimetric transect water content (wpt) and standard deviation measured at three dates in 2010 (a) and com-bination of transect data (b); small letters indicate the same significance level (P > 0.05)
Figure 5. Temporal and spatial distribution of average volumetric water content (θat) measured down the profiles along the vine rows (T12 and T34) at three dates in 2010
θat (%)
0 10 20 30 40 50 60 2010-06-29
T12 T34
M
ea
sur
emen
t de
pt
h (
cm)
0 10 20 30 40 50 60 0 10 20 30 40 50 60
2010-08-11
2010-10-01
5 15 25 35 5 15 25 35
wpt
(%)
20
15
10
5
Jun 29 Aug 10 Oct 1 Jun 29 Aug 10 Oct 1
(a) (b)
20
15
10
[image:6.595.324.516.305.716.2]Reducing the uncertainty would require a consider-able greater number of measurements (Evett et al.
2012). However, this would lead to a disproportional effort, especially for field calibration. Nevertheless, the latter is often recommended by manufacturers and researchers. For irrigation control the practica-bility of an according field calibration is questionable as the experimental procedure is destructive (soil samples have to be taken very close to the access tubes) and requires adjustment of distinct soil mois-ture conditions (Sentek 2001), which is the opposite to prerequisites for monitoring.
Similar to wpt data, θpt data were not significantly different between transects (Figure 6). But the absolute difference of mean θpt data of transects T12 and T34 from one date to the next was 4% and −0.5%, which does not reflect the continuous soil moisture increase of wpt. Potential reasons are, for example, measurement inaccuracies, soil heterogeneity, and non-uniform soil water distribution. Nevertheless, the data of both vine rows reflect the same status, so the most likely causes in this case are temperature effects on the sensors readings. The latter are assumed to deliver smaller θ values at a low temperature and vice versa (Kammerer et al. 2014). To determine specific impacts in detail is beyond the scope of this study, but it has to be noted that uncer-tainties are supposed to remain due to shortcomings of sensor performance (Evett et al. 2012). The mean SD of all θ values (six depths × six access tubes × two transects × three dates) was ± 1.6%. This value indicates the mean measurement uncertainty providing helpful information for interpreting soil water data.
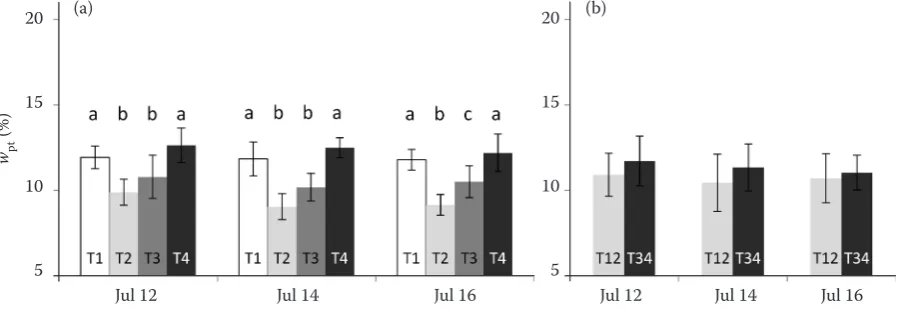
The year 2011 was generally drier than 2010. Dif-ferences between adjacent transects were significant (Figure 7a). It is obvious that tilling of the topsoil of
every second inter-row (T1 and T4) retained soil wa-ter, whereas the areas where weed could develop (T2 and T3) were drier. Similarly, Celette et al. (2008) and Monteiro and Lopes (2007), for instance, inves-tigated smaller water contents under grass and similar permanent vegetation. The rank from largest to lowest (T4 > T1 > T3 > T2) was the same at all three dates, indicating a certain temporal stability of water con-tent as described by several authors (e.g. Pachepsky
[image:7.595.308.527.97.257.2]etal. 2005). Although irrigation was applied on July 13, wpt did not increase within the measuring period, revealing that the horizontal propagation of the wet-ting front did not reach the sampling zone at a 0.5 m horizontal distance. As a consequence, installation of soil water content sensors is recommended close to the drip laterals and also close to an emitter. Based on simulations, Dabach et al. (2015) recommend an optimal placement of tensiometers for irrigation Figure 6. Volumetric transect water content (θpt) in the vine
rows (T12 and T34), 2010
Figure 7. Mean gravimetric water content (wpt) and standard deviation of transects (T1–T4) measured at three dates in 2011 (irrigation was applied on July 13) (a), combination of transect data (b); small letters indicate the same significance level (P > 0.05)
θpt
(%)
25
20
15
10
5
Jun 29 Aug 10 Oct 1
wpt
(%)
20
15
10
5
Jul 12 Jul 14 Jul 16 Jul 12 Jul 14 Jul 16
(a) 20 (b)
15
10
[image:7.595.75.526.558.713.2]control at a distance of 30 cm from dripper. That means that the exact position of a subsurface dripper has to be known before installing soil water sensors. wpt did not change significantly from one sampling date to the next (Figure 7b), but T12 was drier than T34, even though not significantly. Considering the data from 2010, where the relation between the T12 and T34 was changing (Figure 4b), it has to be concluded that the differences express a considerable spatio-temporal variability caused by the plant water uptake. In the given case, wpt ± SDwpt was 11.0 ± 1.5%.
In contrast to wat data, sensor readings reproduced clearly the irrigation event between July 12 and July 14, 2010 with an increase of mean θpt of two transects (T12 and T34) by 3% (Figure 8). After irrigation θpt was considerably (but not significantly) larger in T34. Alike the relation in Figure 7b, but in contrast to the status illustrated in Figure 4b, the soil was wetter near T34 in the investigated period. The mean difference of θpt was 1.8% between T12 and T34. SDθ pt was the largest on July 14 (± 3.3%) – soon after irrigation – indicating the greatest variability of all measurement dates (Figure 6 and Figure 8). The deviations reveal once more a certain spatio-temporal variability of soil moisture, and consequently also potential inac-curacies of sensor readings (Evett et al. 2012). Such considerable uncertainties should be considered when controlling irrigation based on soil water monitoring. Irrigation can be controlled in such a way that soil moisture is kept within a range that represents the readily plant available water stored in a certain soil profile (Allen et al. 1998). The limits are usually defined based on unsaturated hydraulic parameters (field capacity, permanent wilting point). By narrow-ing the range – reducnarrow-ing the upper limit and increas-ing the lower limit considerincreas-ing the determined SD
of water content – it can be avoided that soil water status runs out of the optimal range due to inaccurate measurements. That means that irrigation should be started and stopped before the “original” thresholds are reached, hence irrigation events and intervals are supposed to become shorter in average. In order to improve this basic adaption, further studies on the relationship between the competing water uptake of grapes and cover crops are necessary.
CONCLUSIONS
Variability of soil moisture was investigated in a vineyard by means of soil sampling (along transects on either side of a vine row) and soil water sensing (probes installed near the vine rows). In the first year the variability of water content was small due to relatively homogeneous soil characteristics and little fluctuating hydrological boundary conditions. Mean standard de-viation of all gravimetric and volumetric water content values was ± 0.8% and ± 1.6%, respectively. In the second year the respective standard deviations were ± 1.5% and ± 3.3%. The greater values compared to the first study year arose from the more dynamic outer conditions. The alternating cultivation of every second inter-row had a substantial effect on soil water distribution in both years. The impact was more pronounced in the drier year 2011, when soil moisture was significantly different on both sides of a vine row. Transect water content was generally larger in the tilled inter-rows, indicating smaller unproductive water losses. Repre-sentative monitoring across the entire plot should thus consider all inter-rows with distinct cultivation. How-ever, a more efficient procedure is recommended as a basis for irrigation control. Firstly, the focus should lie on plant water uptake; hence, soil water status should be monitored within the rooting zone of the vines very next to a subsurface emitter. Secondly, the uncertain-ties caused by spatial variability should be considered in such a way that the range of optimal water content for irrigation control is reduced in order to avoid un-intended over-irrigation as well as water deficit stress. As a consequence, irrigation will be applied on average more often and with a shorter duration.
Acknowledgements. The authors want to thank Mr. F.
[image:8.595.66.287.560.720.2]For-ster, Mr. K. Haigner, Ing. W. Sokol, and DI M. Wolf for their work in the field and in the lab, and Mr. M. Wahrmann for the allowance to conduct this study in his vineyard. The installation of the soil water probes was partly funded by the Austrian Research Promotion Agency (FFG) in the frame of the project Innovative approaches to the subsurface drip irrigation principle (SINAPSIS, PN822826).
Figure 8. Mean volumetric water content (θpt)in the vine rows (T12 and T34), 2011 (irrigation was applied on July 13)
θpt
(%)
25
20
15
10
5
References
Allen R.G., Pereira L.S., Raes D., Smith M. (1998): Crop Evapotranspiration: Guidelines for Computing Crop Water Requirements. FAO Irrigation and Drainage Paper No. 56, Rome, FAO.
Ayars J.E., Phene C.J., Hutmacher R.B., Davis K.R., Shone-man R.A., Vail S.S., Mead R.M. (1999): Subsurface drip irrigation of row crops: A review of 15 years of research at the Water Management Research Laboratory. Agricul-tural Water Management, 42: 1–27.
Camp C.R. (1998): Subsurface drip irrigation: a review. Transactions of the ASAE, 41: 1353–1367.
Celette F., Gaudin R., Gary C. (2008): Spatial and temporal changes to the water regime of a Mediterranean vineyard due to the adoption of cover cropping. European Journal of Agronomy, 29: 153–162.
Dabach S., Shani U., Lazarovitch N. (2015): Optimal ten-siometer placement for high-frequency subsurface drip irrigation management in heterogeneous soils. Agricul-tural Water Management, 152: 91–98.
De la Hera M.L., Romero P., Gomez-Plaza E., Martinez A. (2007): Is partial root-zone drying an effective irrigation technique to improve water use efficiency and fruit qual-ity in field-grown wine grapes under semiarid conditions? Agricultural Water Management, 87: 261–274.
Evett S.R., Tolk J.A., Howell T.A. (2006): Soil profile water content determination: Sensor accuracy, axial response, calibration, temperature dependence, and precision. Vadose Zone Journal, 5: 894–907.
Evett S.R., Schwartz R.C., Tolk J.A., Howell T.A. (2009): Soil profile water content determination: Spatiotemporal variability of electromagnetic and neutron probe sensors in access tubes. Vadose Zone Journal, 8: 926–941. Evett S.R., Schwartz R.C., Casanova J.J., Heng L.K. (2012):
Soil water sensing for water balance, ET and WUE. Ag-ricultural Water Management, 104: 1–9.
Intrigliolo D.S., Castel J.R. (2008): Effects of irrigation on the performance of grapevine cv. Tempranillo in Requena, Spain. American Journal of Enology and Viticulture, 59: 30–38. Intrigliolo D.S., Castel J.R. (2009): Response of Vitis vinifera
cv. ‘Tempranillo’ to partial rootzone drying in the field: Water relations, growth, yield and fruit and wine quality. Agricultural Water Management, 96: 282–292.
Jury W.A., Gardner W.R., Gardner W.H. (1991): Soil Physics. 5th Ed. New York, John Wiley & Sons.
Kammerer G., Nolz R., Rodny M., Loiskandl W. (2014): Performance of Hydra Probe and MPS-1 soil water sen-sors in topsoil tested in lab and field. Journal of Water Resource and Protection, 6: 1207–1219.
Medrano H., Tomás M., Martorell S., Escalona J.M., Pou A., Fuentes S., Flexas J., Bota J. (2015): Improving water use efficiency of vineyards in semiarid regions: A review. Agronomy for Sustainable Development, 35: 499–517. Monteiro A., Lopes C.M. (2007): Influence of cover crop
on water use and performance of a vineyard in Mediter-ranean Portugal. Agriculture, Ecosystems and Environ-ment, 121: 336–342.
Nolz R., Cepuder P. (2011): Weather data as basis for cal-culating reference evapotranspiration on an irrigation trial plot within a vineyard. In: Stredova H., Roznovsky J., Litschmann T. (eds): Int. Conf. Microclimate and Meso-climate of Landscape Structures and Anthropogenic Environment, Skalní Mlýn, Feb 2–4, 2011: 1–6.
Pachepsky Y.A., Guber A.K., Jacques D. (2005): Temporal persistence in vertical distribution of soil moisture con-tents. Soil Science Society of America Journal, 69: 347–352. R Development Core Team (2008): R: A Language and Environment for Statistical Computing. Vienna, R Foun-dation for Statistical Computing. Available at http:// www.R-project.org
Razali N.M., Wah Y.B. (2011): Power comparisons of Sha-piro-Wilk, Kolmogorov-Smirnov, Lilliefors and Ander-son-Darling tests. Journal of Statistical Modeling and Analytics, 2: 21–33.
Ruiz-Sanchez M.C., Domingo R., Castel J.R. (2010): Review. Deficit irrigation in fruit trees and vines in Spain. Spanish Journal of Agricultural Research, 8: 5–20.
Sentek (2001): Calibration of Sentek Soil Moisture Sensors. Manual. Stepney, Sentek Pty, Ltd.
Sentek (2009): Diviner 2000 User Guide version 1.5. Manual. Sentek Pty, Ltd.
Starr G.C. (2005): Assessing temporal stability and spatial variability of soil water patterns with implications for precision water management. Agricultural Water Man-agement, 72: 223–243.
Van Leeuwen C., Trégoat O., Choné X., Bois B., Pernet D., Gaudillère J.P. (2009): Vine water status is a key factor in grape ripening and vintage quality for red Bordeaux wine. How can it be assessed for vineyard management purposes? Journal International des Sciences de la Vigne et du Vin, 43: 121–134.
Vereecken H., Huisman J.A., Bogena H., Vanderborght J., Vrugt J.A., Hopmans J.W. (2008): On the value of soil moisture measurements in vadose zone hydrology: A review. Water Resources Research, 44: W00D06.
Received for publication October 1, 2015 Accepted after corrections February 12, 2016 Published online July 20, 2016
Corresponding author:
DI Dr. Reinhard Nolz, University of Natural Resources and Life Sciences, Institute of Hydraulics and Rural Water Management, Department of Water, Atmosphere and Environment, Muthgasse 18, 1190 Vienna, Austria;