JOURNAL OF FOREST SCIENCE, 59, 2013 (7): 279–287
Spatial-temporal distribution of forest fires and fire
weather index calculation from 2000 to 2009 in China
M.R. Ullah
1, X.D. Liu
1, M. Al-Amin
21College of Forestry, Beijing Forestry University, China
2Institute of Forestry and Environmental Sciences, University of Chittagong, Bangladesh
ABSTRACT:This paper describes the forest fire dynamics in the city of Sanming in Fujian province, China, from 2000 to 2009 with a view to understand the number of fires and burned areas in different counties. It also includes the spatial-temporal distribution of fires and application of the Canadian Forest Fire Danger Rating System (CFFDRS). Daily forest fire data was provided by the Department of Wildfire Prevention of Sanming Forestry Bureau. FWI calculator v.7.0.2.76 was used in this study for analysing the weather parameter data. The results showed that a total of 818 fires and burned areas of 8721.16 ha were found during the study period of 10 years. However, the highest and lowest forest fires were found in Youxi county and Sanming district, respectively. Most of the fires with large burned areas occurred at 2 p.m. Moreover, occurrences of fires were found the highest and lowest in March and June, respectively. Based on FWI calcula-tion, the highest danger rating value was found in March, 2009. This study proposes that it would be possible to manage regular forest fire occurrences through the application of CFFDRS. Finally, to plan the fire prevention and management in southern China and other tropical countries, this system has a great opportunity for further implementations.
Keywords: Sanming; spatial-temporal distribution; CFFDRS
Abbreviations: CFFDRS – Canadian Forest Fire Danger Rating System, FWI – Fire Weather Index, FFMC – Fine Fuel Moisture Code, DMC – Duff Moisture Code, DC – Drought Code, BUI – Build-Up Index, ISI – Initial Spread Index, DT – Datian, JL – Jiangle, JN – Jianning, MX – Mingxi, NH – Ninghua, SM – Sanming, SX – Shaxian, TN – Taining, QL – Qing- liu, YA – Yongan, YX – Youxi
Supported by the Ministry of Science and Technology, China (Project No. 2006BAD04B05). Forest fire becomes a major concern in the
for-estry of China after serious fire that occurred in Daxing’anling Mountain in May 1987. It caused great damage ‒ 213 persons died and 1330 ha of areas were burned (Shu et al. 2003). However, in China, 13,600 forest fires with average burned areas of 758,000 ha per year have been recorded during the last 55 de-cades (Zhang, Qingwen 2008). Zhao (2003) men-tioned that the annual fire area is about 0.8% of the whole forest area, which is eight times more com-pared to the world average level.
Understanding of the spatial and temporal variation of forest fires contributes to efficient forest fire man-agement (Gonzalez 2005; Nonaka, Spies 2005). Kasischke et al. (2002) stated that the application of forest fire statistics including the number of fires and burn area is an effective method to understand forest
fire characteristics. However, these perspectives have already been practiced in Canada (Asgary 2010), Israel (Wittenberg, Malkinson 2009), India (Ko-dandapani et al. 2008) and South Korea (Lee et al. 2006).
Liu et al. (2010) found that the variability of climate and weather influences not only the fire occurrence and spread behaviour but also fire severity at different time scales. Drought and rising temperature both are responsible for fire season lengthening, spreading and igniting. Several researchers remarked that the long-term atmospheric anomalies and forest fire activities have a close relationship (e.g. Swetnam, Betan-court 1990; Chu et al. 2002; Skinner et al. 2002; Hoinka et al. 2009).
practiced in Canada, Australia and United States for about 75 years (Stocks et al. 1989). Moreover, it is applied now mostly in Russia (Stocks et al. 1998), Mexico (Lee et al. 2002), New Zealand (National Rural Fire Authority 1993), Indonesia and Malaysia (William et al. 2006), and in European countries (San-Miguel-Ayanz et al. 2003). This system ad-dresses several fire management problems such as occurrence time, spread and damage to resources.
In the 1980s, CFFDRS was introduced in China to control and manage forest fires (Taylor 2001). It has already been practiced in some provinces of Heilongjiang, Jilin, Inner Mongolia, Liaoning, and Yunnan to understand the fire danger ratings and fire prone seasons.
A set of customizable codes makes Canada’s Spa-tial Fire Management System the only one in the world capable of being adapting to any scale, from local to global. The FWI System is based on weath-er parametweath-ers such as surface tempweath-erature,
precipi-tation, relative humidity, and wind speed to show fire danger (van Wagner 1987).
[image:2.595.62.532.86.179.2]All of these codes have numerical ratings like the Fine Fuel Moisture Code (FFMC) that measures the moisture content of the smallest forest fuels. The Duff Moisture Code (DMC) and Drought Code (DC) both indicate the average moisture content of loosely (2–10 cm) and deeply compacted (> 10 cm) organic layers on the forest floor, respectively. The Initial Spread Index (ISI) shows the expected rate of fire spread, the Build-Up Index (BUI) indicates the total amount of fuel available for combustion. The Fire Weather Index (FWI) shows the fire in-tensity that is used as a general indicator of fire danger. Maximum value of the FFMC is 101, but the DMC and DC both are ‘open ended’. The values of fire behaviour indexes such as ISI, BUI increase as fire weather severity worsens (Tian et al. 2011). The fire weather codes and indexes with ranges are shown in Table 1.
Table 1. Fire weather indexes according to the Canadian forest fire danger rating system (http://www.dnr.state.mn.us/ forestry/fire/reports/canadian_indexes_f.html)
Danger rating FFMC DMC DC ISI BUI FWI
Low 0–81 0–13 0–80 0–4 0–19 0–5
Moderate 81–88 13–28 80–210 4–8 19–34 5–14
High 88–90.5 28–42 210–274 8–11 34–54 14–21
Very High 90.5–92.5 42–63 274–360 11–19 54–77 21–33
Extreme 92.5+ 63+ 360+ 19+ 77+ 33+
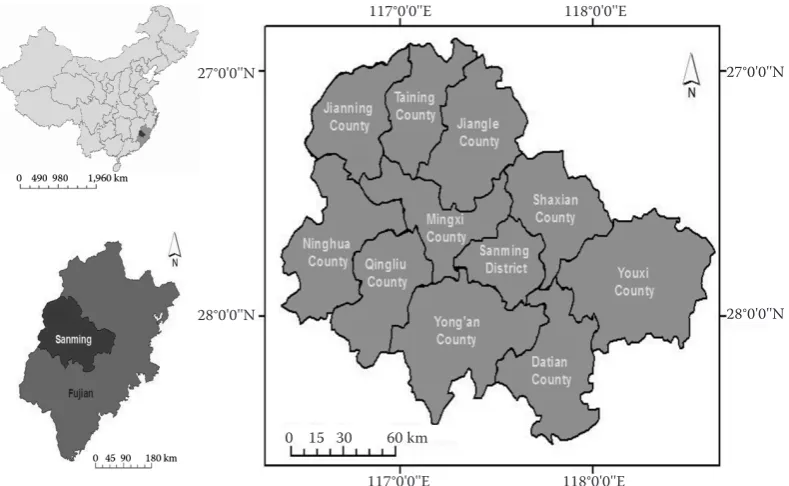
Fig. 1. Location of Sanming in China and in Fujian Province
0 15 30 60 km
117°0'0''E 118°0'0''E 117°0'0''E 118°0'0''E
27°0'0''N
28°0'0''N 27°0'0''N
[image:2.595.101.496.494.737.2]Since the Fujian province of southern China is rich in biological diversity, every year it faces small to large fires due to availability of more combus-tible fuels on the forest ground. The objectives of this study are to identify a fire prone county in Sanming, and to compare the spatial-temporal dis-tribution of forest fires. Moreover, it includes the calculation of CFFDRS codes and indexes.
MATERIAL AND METHODS
Study area
Sanming is situated in the northwest of the Fujian province, located at 116.22–118.39°E longitude and 25.30–27.07°N latitude (Fig. 1), and the total area of 2.31 mill. ha. It belongs to subtropical monsoon climate with high rainfall, mild climate, and long non-frost period with clear distinction of the four seasons. Annual average temperature is 17–19.4°C, average annual rainfall of 1,565–1,795 mm, maxi-mum annual rainfall of 2,255 mm, and minimaxi-mum annual rainfall of 1,131 mm as well as an average relative humidity of 79–94%. The forest area of the whole city is 1.90 mill. ha, and by 2000, forest cover in the city had already approached its upper limit with 71% of available lands being forested (Ying et al. 2010). About 76% of forest land is covered only by Chinese fir (Cunninghamia lanceolata) and Masson pine (Pinus massoniana). Low biological diversity hampers the ecological health of the San-ming forests (Song et al. 2004).
Data collection
The forest fire data from 2000 to 2009 was pro-vided by the Department of Wildfire Prevention of Sanming Forestry Bureau. Each fire event record comes with a list of attributes such as fire location, fire classes and occurrence time (i.e. fire starting time). Weather parameters data which include tem-perature, humidity, rainfall and wind speed was col-lected from Taining (26°54'N, 117°10'E) and Yongan (25°58'N, 117°21'E) meteorological stations. Weath-er obsWeath-ervation at noon evWeath-ery day is the input of the FWI system, and the temperature was estimated by subtracting 2°C from the daily maximum tem-perature (Williams et al. 2001). Rainfall, humidity and wind speed data was collected from these local weather stations.
Calculations for each code and index in this study using the initial value 85 for FFMC, 6 for DMC, and
15 for DC, are done because of the unavailability of initial values for all counties of Sanming. Regardless of the numbers that serve as the initial value it will not affect the final results of the calculation, there-fore, this study will use the same initial values as a previous study conducted by van Wagner (1987).
Collected spatial-temporal data was calculated and presented in graphs using the SigmaPlot v.8.02 software. Fire Weather Index was calculated using FWI Calculator v.7.0.2.76 (SoftRock, Auckland, New Zealand). Moreover, the FFMC, DMC, DC, ISI and BUI were also calculated using this calculator.
FWI calculator v.7.0.2.76
SoftRock is the producer of this software, and currently freeware at this version. This application is useful to solve an immediate need, and in doing so developed well beyond its initial scope. FWI calculator provides several facilities such as forest type. It has been added so that the user can bet-ter select the closest match. Besides, this enhances FFDC (Forest Fire Danger Code) accuracy. More-over, it manually accepts weather and environment data, and then calculates daily FWI, BUI, ISI, DC, DMC and FFMC. It saves weather data and FWI in-dexes in a recoverable data file, and displays chart-ed data for FWI, FFMC, DMC, DC, ISI, BUI, and allows them to be saved to file.
RESULTS
Distribution of three classes of forest fires
Comparative analysis of forest fires
The forest fire data were grouped in two periods (i.e. either of the periods is 5 years, one is 2000 to 2004 and the other is 2005–2009). It was consid-ered separately at a 5-year fire cycle to realize the changing pattern of total forest fires and burned areas.
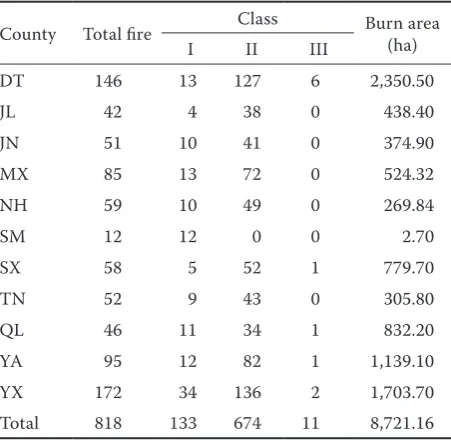
[image:4.595.305.531.86.306.2]In all counties, the number of fires and burned areas were increasing in the next 5-year period of 2005–2009 compared to the first period 2000–2004 (Fig. 2). However, within these 10 years, a remark-able number of fires and large burned areas were found in Datian, Mingxi, Qingliu, Shaxian, Yon-gan and Youxi counties. In the rest of the counties, there were few fires with small burned areas in this period. Although, within this period, the forest eas were burned in all counties but most of the ar-eas were burned in Datian and Youxi counties from 2005 to 2009. However, closely similar burned ar-eas in both periods were found in Jiangle, Jianning, Ninghua and Taining counties. Very small burned areas (only 2.70 ha) were found in Sanming district (Table 2).
Spatial-temporal distribution of forest fires
Daily variation
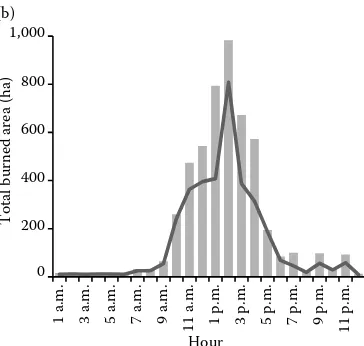
In both periods, most of the forest fires occurred from 10 a.m. (i.e. starting time) to 5 p.m. It was mainly due to favourable weather conditions and continuous human activities. In Sanming, the high-est number of fires occurred at 2 p.m., which was 78 and 86 fires in these periods of 2000–2004 and 2005–2009, respectively (Fig. 3). Considering the total burned areas, from 10 a.m. to 5 p.m., it was found 3105.78 ha for the first period and 4,490.50 ha for the second (Fig. 3). Within these periods, at 2 p.m.,
large burned areas of 982.80 ha were found in 2005–2009 whereas 807.60 ha in 2000–2004. Very small burned areas for both periods were found in the early morning from 12 a.m. to 6 p.m.
Monthly changes
Occurrences of fires were found higher in late spring and summer (January–April) compared to the other seasons in both periods. Moreover, few fires and small burned areas occurred in autumn (i.e. July–September) (Fig. 4). In winter (i.e. Octo-ber to DecemOcto-ber), fire numOcto-bers and burned areas were found higher than in the rainy season (from May to June). In March, most of the fires occurred
0 20 40 60 80 100
DT JL JN MX NH QL SM SX TN YA YX
Tot
al
num
ber
of
fi
re
[image:4.595.76.276.566.737.2]County 2000‒2004 2005‒2009 (a)
Fig. 2. Fire number (a) and burned areas (b) in two study periods (b)
0 300 600 900 1,200 1,500 1,800
DT JL JN MX NH QL SX TN YA YX
To
ta
l b
ur
ne
d
ar
ea
(ha
)
County (a)
Table 2. Forest fire statistics in the city of Sanming from 2000 to 2009
County Total fire Class Burn area (ha)
I II III
DT 146 13 127 6 2,350.50
JL 42 4 38 0 438.40
JN 51 10 41 0 374.90
MX 85 13 72 0 524.32
NH 59 10 49 0 269.84
SM 12 12 0 0 2.70
SX 58 5 52 1 779.70
TN 52 9 43 0 305.80
QL 46 11 34 1 832.20
YA 95 12 82 1 1,139.10
YX 172 34 136 2 1,703.70
Total 818 133 674 11 8,721.16
with large burned areas and it is followed by Febru-ary and JanuFebru-ary. Moreover, the lowest number of fires and small burned areas was found in June. In March, there were a total of 102 fires and 1,407 ha burned areas in 2000–2004 and 167 fires with 1,669.40 ha in 2005–2009. The second and the third largest burned areas were found in February and January for both study periods. There were few for-est fires and small burned areas in the rfor-est of the months in these periods.
Annual distributions
In 2000, 124 forest fires and 1,922.20 ha burned areas were found in the first 5 years. In the follow-ing year, there was a decreasfollow-ing trend of fire occur-rences. From that year till 2004, fire numbers and burned areas were both increasing very sharply. The lowest number of fires and the smallest burned areas were found in 2006 during this 10-year pe-riod, which was only 15 fires and 102.20 ha (Fig. 5). However, fire number and burned areas were both increasing rapidly from 2007 to 2009. In 2009, fire
numbers increased 4 times and burned areas in-creased 10 times compared to fire occurrences in 2007. Overall, in Sanming, it was observed that occurrences of fires were increasing regularly at a 5-year interval. Moreover, in this 5-year fire cycle, it is clear that if the fire occurrence rate is low in the first 2 years, it becomes high in the next 3 years.
FFMC, DMC, DC, ISI and BUI calculation
[image:5.595.326.508.56.229.2]Calculating different codes and indexes, it was identified that March and June are the high-est and the lowhigh-est fire danger months. According to danger rating, the extreme danger rating was found in March from 2005 to 2009, and the value range was 92.5+ for FFMC, 63+ for DMC, 360+ for DC, 19+ for ISI and 77+ for BUI (Table 3). In March, between 2000 and 2001, the danger rat-ing was high, and the value range was 85–90.5 for FFMC, 28–42 for DMC, 210–274 for DC, 8–11 for ISI and 34-54 for BUI. Very high fire dan-ger rating was found in March from 2002 to 2004. It amounted to 91.21, 90.20 and 88.18 for FFMC; 0 20 40 60 80 100 1 a. m . 3 a. m . 5 a. m . 7 a. m . 9 a. m . 11 a .m . 1 p. m . 3 p. m . 5 p. m . 7 p. m . 9 p. m . 11 p. m . Total n um ber of fi re Hour 2005–2009 2000–2004 (a)
[image:5.595.90.516.562.739.2]Fig. 3. Total number of forest fires (a), burned areas per day (b)
Fig. 4. Forest fire distribution with burned areas during twelve months 0 200 400 600 800 1,000 1 a. m . 3 a. m . 5 a. m . 7 a. m . 9 a. m . 11 a .m . 1 p. m. 3 p. m. 5 p. m. 7 p. m. 9 p. m. 11 p .m . Tota l b ur ne d ar ea (h a) Hour (b) (b) 0 300 600 900 1,200 1,500 1,800 Ja n Fe b Ma r Ap r Ma y Ju
n Jul
A
ug Sep Oct Nov Dec
To ta l b ur ne d ar ea (ha ) Month (a) 0 30 60 90 120 150 180 Ja n Fe b Ma r Ap r Ma y Ju
n Jul
A
ug Sep Oct Nov
61.10, 57.29 and 55.61 for DMC; and 359.32, 355.65 and 350.74 for DC in 2004, 2003 and 2002, respec-tively. Moreover, for March, the ISI was 18.59, 18.50 and 18.76; and BUI was 76.03, 72.81 and 70.48 in 2004, 2003 and 2002, respectively. From 2000 to 2009, the lowest fire danger rating was found in
June. Low danger rating was categorized as the val-ue ranges 0 to 81 for FFMC, 0–13 for DMC, 0–80 for DC, 0–4 for ISI and 0–19 for BUI. However, in June 2000–2009, the FFMC value was increasing from 60.86 to 73.16, DMC from 12.53 to 19.63, DC from 43.33 to 73.60, ISI from 0.78 to 1.57, and BUI from 13.20 to 23.37.
FWI calculation
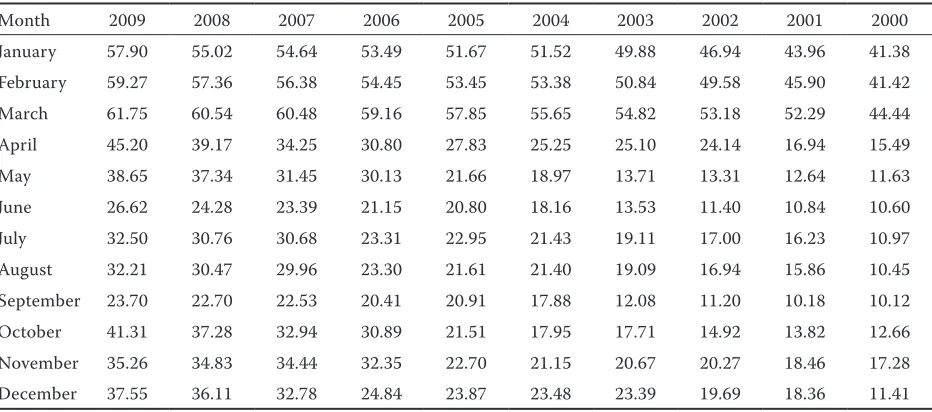
FWI calculations using four weather parameters from 2000 to 2009 are shown in Table 4. From 2000 to 2009, average FWI in January, February, March, June, November and December were found to be 50.64, 52.20, 56.02, 18.08, 25.74 and 25.15, respec-tively. March had the highest FWI, increasing from 2000 to 2009 (average value increased from 44.44 to 61.75). In this month, most of the fires during the 10-year period occurred. However, fire danger rating was extremely high at the beginning of the year, main-ly in January, February and March. In 2000 and 2001, from April to December, the fire danger ratings were
0 30 60 90 120 150 180
0 500 1,000 1,500 2,000 2,500
20
00
20
01
20
02
20
03
20
04
20
05
20
06
20
07
20
08
20
09
T
ot
al
n
um
be
r o
f fi
re
To
tal
b
ur
ned
a
re
a
(h
a)
Year
[image:6.595.326.511.58.209.2]Burned area Number of fire
[image:6.595.63.290.73.418.2]Fig. 5. Distribution of forest fires and burn areas from 2000 to 2009
Table 4. Fire Weather Index calculation in years
Month 2009 2008 2007 2006 2005 2004 2003 2002 2001 2000
January 57.90 55.02 54.64 53.49 51.67 51.52 49.88 46.94 43.96 41.38
February 59.27 57.36 56.38 54.45 53.45 53.38 50.84 49.58 45.90 41.42
March 61.75 60.54 60.48 59.16 57.85 55.65 54.82 53.18 52.29 44.44
April 45.20 39.17 34.25 30.80 27.83 25.25 25.10 24.14 16.94 15.49
May 38.65 37.34 31.45 30.13 21.66 18.97 13.71 13.31 12.64 11.63
June 26.62 24.28 23.39 21.15 20.80 18.16 13.53 11.40 10.84 10.60
July 32.50 30.76 30.68 23.31 22.95 21.43 19.11 17.00 16.23 10.97
August 32.21 30.47 29.96 23.30 21.61 21.40 19.09 16.94 15.86 10.45
September 23.70 22.70 22.53 20.41 20.91 17.88 12.08 11.20 10.18 10.12
October 41.31 37.28 32.94 30.89 21.51 17.95 17.71 14.92 13.82 12.66
November 35.26 34.83 34.44 32.35 22.70 21.15 20.67 20.27 18.46 17.28
[image:6.595.65.531.554.760.2]December 37.55 36.11 32.78 24.84 23.87 23.48 23.39 19.69 18.36 11.41
Table 3. FFMC, DMC, DC, ISI and BUI calculation
Year Month Codes and indexes
FFMC DMC DC ISI BUI
2009
March
97.06 68.55 408.55 22.45 114.03
2008 96.94 68.06 405.45 21.88 105.58
2007 96.76 67.03 390.06 21.79 100.74
2006 96.45 66.61 387.03 20.16 98.81
2005 93.36 63.39 384.23 20.01 90.23
2004 91.21 61.10 359.32 18.59 76.03
2003 90.20 57.29 355.65 18.50 72.81
2002 88.18 55.61 350.74 18.76 70.48
2001 87.61 41.23 248.45 10.35 51.26
2000 85.05 40.87 245.35 9.56 51.06
2009
June
73.16 19.63 73.60 1.57 23.37
2008 73.12 18.40 72.70 1.28 20.50
2007 72.22 18.30 71.93 1.25 20.37
2006 71.88 16.27 62.43 1.13 20.30
2005 69.95 16.23 61.83 1.11 19.00
2004 69.20 15.03 61.63 1.10 17.63
2003 68.03 14.90 57.10 1.09 17.57
2002 65.60 13.33 52.00 1.06 16.90
2001 64.18 13.23 45.17 0.98 15.80
high to moderate, and FWI value ranged from 10.12 to 18.46. However, from 2002 to 2009, the fire danger ratings for April, November and December were be-coming very high to extreme (FWI value > 18.5).
During the ten-year study period, FWI value was found very high in the first three months. It was low between April and September, and it was also high between October and December. From Janu-ary to April, high temperature and low rainfall were mainly responsible for high fire danger ratings. High rainfall with humidity from May to Septem-ber caused low to moderate fire danger ratings in these months. The winter season with low humid-ity and heavy wind speed caused severe fires from October to December resulting in very high fire danger ratings with high FWI value.
DISCUSSION AND CONCLUSIONS
Understanding of forest fire distribution
Classification of fire danger rating area all over the country is considered very important to bet-ter understand fire occurrences and dangers. More attention to this classification was given by many countries. However, China started to practice it in 1950. In 1991, the Forest Inventory Design In-stitute under Ministry of Forestry classified three fire danger ratings based on the theory of the forest burning link (Zheng, Yao 1993). This classification depends on the following four factors: forest fire behaviour (fire occurrence and burn area), distri-bution and type of forest (dominant trees and forest cover), climate, and fire resource (population den-sity and fire management). In Sanming, this classi-fication was considered properly to understand the fire behaviour. Evergreen broadleaved forest and high combustible fuels were mainly responsible for regular fire occurrences in Youxi and Datian coun-ties. High temperature and low rainfall in summer, and low humidity and high wind speed in winter during the last decade also caused large fires in Sanming. Moreover, highly populated and poor fire management system in this city was responsible for most of the fires. In Sanming, most of the forest fires occurred between 10 a.m. and 5 p.m. Huang (2009) and Liu et al. (2009) cited that most of the forest fires in the city of Wuyishan in Fujian prov-ince occurred from 11 a.m. to 2 p.m. A study con-ducted in Toronto, Canada, showed that the densi-ty of fire incidents is often changed by time (h), and afternoon and early evening hours seem to have the densest patterns of forest fire occurrences (Asgary
et al. 2010). This study also revealed that the high-est number of forhigh-est fires occurs in late spring and summer while the lowest number of incidents oc-curs in autumn. From our findings in Sanming, the late spring and summer season had a higher inci-dence of forest fires. In addition, dry weather, heavy sunshine, low humidity and high wind speed from January to April responded for this distinct differ-ence of spatial-temporal forest fire characteristics.
CFFDRS and FWI
There is a close relationship between the forest fire occurrences and changes in weather parame-ters. The large forest fire results from dry conditions due to changes in humidity and temperature. Mike Flannigan, a Canadian Forest Service researcher, found out a positive relationship between the ris-ing temperature and the increase in forest fires in Canada, and it is the same worldwide (Mukho-padhyay 2009). Valdiya (2006) reported that the increase in temperature increases the chance of fire occurrences whereas rainfall and humidity have the opposite relationship with fire.
The FFMC is commonly used as an indicator of fire starts (Martell et al. 1987; Anderson, En-glefield 2001). The FFMC scale ranges 0–99 with higher values indicating drier fine fuels and great-er fire danggreat-er. The data showed a gengreat-eral increas-ing trend of FFMC to the highest 97.06 in March, 2009 (Table 3). It was reflected by the progressive drying of fine fuels resulting in the large number of forest fires during that time in Sanming. A gradual increase in FFMC value 2000–2009 appears to in-dicate large fire occurrences with fine fuels on the landscape leaving a potential to burn.
FWI is usually used to indicate the fire intensity for most of the fuel types. It is a combination of the fire spread rate of ISI input and the total fuel consump-tion rate of BUI input (William et al. 2006). Results showed that forest fires and burned area increased from 2000 to 2009 when average FWI > 50. When average FWI < 27 during the ten-year study period, there were very few forest fires occurring in San-ming. To provide early warning, the CFFDRS identi-fies classes of increasing fire danger as the FFMC, DC, and ISI approach these key threshold values.
Recommendations
and slopes, and to collect weather and forest fire data daily. To estimate the burn area and forest vol-ume, use the FWI calculator at weather stations to calculate the fire codes and indexes, also save the fire data electronically.
Acknowledgements
The authors would like to thank the Ministry of Science and Technology, China, for supporting this research through the Forest Fire Monitoring, Pre-vention and Control Funds (No. 2006BAD04B05). The support and ideas provided by Dr. Xiejie Wang and Dr. Binhui Liu are gratefully acknowledged. The assistance by Dr. Charlotte Whitham from the Imperial College of London, U.K. is also warmly appreciated.
References
Anderson K.R., Englefield P. (2001): Quantile characteris-tics of forest fires in Saskatchewan. In: Proceedings 4th Sym-posium on Fire and Forest Meteorology. Reno, 13.–15. November, Boston, American Meteorological Society: 9−16. Asgary A., Ghaffari A., Levy J. (2010): Spatial and tem-poral analyses of structural fire incidents and their causes: A case of Toronto, Canada. Fire Safety Journal, 45: 44−57. Chu P.S., Yan W.P., Fujioka F. (2002): Fire-climate relation-ships and long-lead seasonal wildfire prediction for Hawaii. International Journal of Wildland Fire, 11: 25−31. Gonzalez M.E. (2005): Fire history data as reference
infor-mation in ecological restoration. Dendrochrononlogia, 22: 149−154.
Hoinka K.P., Carvalho A., Miranda A. (2009): Regional-scale weather patterns and wildland fires in central Por-tugal. International Journal of Wildland Fire, 18: 36−49. Huang Z.G. (2009): Study on the occurrence regularity of
for-est fires in Wuyishan. Journal of Fujian Forfor-estry, 36: 211−213. Kasischke E.S., Williams D., Barry D. (2002): Analysis
of the patterns of large fires in the boreal forest region of Alaska. International Journal of Wildland Fire, 11: 131−144. Kodandapani N., Cochrane M.A., Sukumar R. (2008):
A comparative analysis of spatial, temporal, and ecologi-cal characteristics of forest fires in seasonally dry tropiecologi-cal ecosystems in the Western Ghats, India. Forest Ecology and Management, 256: 607−617.
Lee B., Park P.S., Chung J. (2006): Temporal and spatial char-acteristics of forest fires in South Korea between 1970 and 2003. International Journal of Wildland Fire, 15: 389−396. Lee B.S., Alexander M.E., Hawkes B.C., Lynham T.J.,
Stocks B.J., Englefield P. (2002): Information systems in support of wildland fire management decision making in Canada. Computers and Electricity in Agriculture, 37: 185−198.
Liu Y., Stanturf J., Goodrick S. (2010): Trends in global wildfire potential in a changing climate. Forest Ecology and Management, 259: 685−697.
Liu X.S., Zheng W.D., Song L.Y., Chen Q.J., Weng Y.F., Zhou G.M., Yu S.Q. (2009): Current situation of forest fire and countermeasures in Hangzhou. Journal of Zhejiang Forest, 29: 63−67.
Martell D.L., Otukal S., Stocks B.J. (1987): A logistic model for predicting daily people-caused forest fire oc-currence in Ontario. Canada Journal of Forest Research, 17: 394−401.
Mukhopadhyay D. (2009): Impact of climate change on forest ecosystem and forest fire in India. Earth and Envi-ronmental Science, 6: 20−27.
National Rural Fire Authority (1993): Fire Weather Index Tables for New Zealand. Wellington, National Rural Fire Authority: 48.
Nonaka E., Spies T.A. (2005): Historical range of variability in landscape structure: a simulation study in Oregon, USA. Ecological Applications, 15: 1727−1746.
San-Miguel-Ayanz J., Barbosa P., Liberta G., Schmuck G., Schulte E., Bucella P. (2003): The European Forest Fire Information System: a European Strategy towards Forest Fire Management. In: Proceedings of the 3rd Inter-national Wildland Fire Conference, Sydney, 3.–6. October 2003. Washington, DC, U.S. Department of the Interior, Bureau of Land Management [CD-ROM]: 57.
Shu L.F., Tian X.R., Wang M.Y. (2003). A study on forest fire occurrence in China. Available at http://www.fao.org/ docrep/article/wfc/xii/0278-b1.htm (accessed November 17, 2012)
Skinner W.R., Flannigan M.D., Stocks B.J. (2002): A 500hPa synoptic wildland fire climatology for large Ca-nadian forest fires, 1959−1996. Theoretical and Applied Climatology, 71: 157−169.
Song Y., Wang G., Burch J.W.R., Rechlin M.A. (2004): From innovation to adaptation: lessons from 20 years of the SHIFT forest management system in Sanming, China. Forest Ecology and Management, 191: 225−238.
Stocks B.J., Fosberg M.A., Lynham T.J., Mearns L., Wot-ton B.M., Yang Q., Jin J.Z., Lawrence K., Hartley G.R., Mason J.A., McKenney D.W. (1998): Climate change and forest fire potential in Russian and Canadian boreal forests. Climate Change, 38: 1−13.
Stocks B.J., Lawson B.D., Alexander M.E., van Wagner C.E., McAlpine R.S., Lynham T.J., Dube D.E. (1989): Canadian Forest Fire Danger Rating System: an overview. Forest Chron, 65: 258−265.
Swetnam T.W., Betancourt J.L. (1990): Fire-southern oscillation relations in the southwestern United States. Science, 249: 1017−1020.
Corresponding author:
Mohammad Rahmat Ullah, MS, Chittagong University, Institute of Forestry and Environmental Sciences, Mohammad Wali Ullah (Benu), No. 11, Ice Factory Road (2nd floor), P.S.-Double Mooring,
P.O.-G.P.O., Chittagong/4000, Bangladesh e-mail: [email protected]
Tian X.R., Shu L.F., Wang M.Y., Zhao F.J. (2011): Forest fire danger ratings in the 2040s for northeastern China. Forestry Studies in China, 13: 85−96.
Valdiya K.S. (2006): Coping with Natural Hazards: Indian Context. Hyderabad, Orient Longman: 284.
van Wagner C.E. (1987): Development and Structure of the Canadian Forest Fire Weather Index System. Forestry Technical Report 35. Chalk River, Petawawa National Forest Forestry Institute, Canadian Forestry Service: 37. . William J.D.G., Robert D.F., Michael A.B., Orbita R.,
Maznorizan M. (2006): Development of the Indonesian and Malaysian Fire Dating Rating Systems. Global Change, 12: 165−180.
Williams A.A.J., Karoly D.J., Tapper N. (2001): The sensi-tivity of Australian fire danger to climate change. Climate Change, 49: 171−191.
Wittenberg L., Malkinson D. (2009): Spatio-temporal perspectives of forest fires regimes in a maturing Medi-terranean mixed pine landscape. Europe Journal Forest Research, 128: 297−304.
Ying Z., Irland L., Zhou X., Song Y., Wen Y., Liu J., Song W., Qiu Y. (2010): Plantation development: Economic analysis of forest management in Fujian Province, China. Forest Policy and Economics, 12: 223–230.
Zhang A., Qingwen Q. (2008): Symbology in the forest fire emergency map. International Archives of the Photogram-metry, Remote Sensing and Spatial Information Sciences, 8: 457−462.
Zhang A, Qingwen Q. (2008): Symbology in the forest fire emergency map. In: Jun Ch., Jie J., Peled A. (eds): XXIst ISPRS Congress. Beijing, 3.–11. July. Beijing, Interna-tional Society for Photogrammetry and Remote Sensing: 457−462.
Zhao X.S.L. (2003): El Nino and forest fire in Yunnan province, Southwest China – New way to study three es-sential factors of forest fire. Chinese Forestry Science and Technology, 2: 16−23.
Zheng H.N., Yao S.R. (1993): Classification of fire danger rating area in China. Journal of Northeast Forestry Uni-versity, 4: 72−76.