The “Barley1” microarray continues a tradition of cooperation and sharing within the worldwide barley community. It is my pleasure to provide some insights about the contributions of many people who participated in the development of this new resource. I will also take this opportunity to provide some simple numerical assessments of the “Barley1” array, which is far from being a “whole-genome” device, so that we do not become complacent by falsely thinking that we have the ultimate expres-sion profiling tool. Certainly we do not, but we can and will do be�er in the future by continuing to work together as a community. Finally, I will briefly describe some of the experiments that my group has conducted using the “Barley1” microarray
to study the transcriptional response of barley to drought stress, one of several abiotic stresses includ-ing drought, low temperature and salinity that we have studied using the Barley1 microarray.
The period of 1998 to 2002 was an incubation time for the Barley1 microarray. During this time representatives of the international barley ge-nomics community met formally and informally at the annual Plant and Animal Genome (PAG) Conference in San Diego, California, where we exchanged information about progress and new initiatives in the development of barley genome resources, and to identify mechanisms to share them. During this period there was a consensus that a standard for parallel expression
profil-The Barley Microarray. A Community Vision
and Application to Abiotic Stress
T������ J. CLOSE
Department of Botany & Plant Sciences, University of California, Riverside, CA, USA
Abstract: A microarray chip representing approximately 20 000 barley unigenes was produced as part of a USA project entitled “An integrated physical and expression map of barley for Triticeae improvement”. The content of the chip was derived from more than 400 000 barley “Expressed Sequence Tag” (EST) sequences received from cooperators in USA, Germany, Australia, Japan, Scotland, and Finland, plus about 1000 sequences retrieved from the GenBank nr database or GrainGenes. All EST sequences were trimmed to high quality regions, contaminants were identified and removed, and the remaining information was compiled using the CAP3 assembly program. A “stringent” assembly (paralogs separated) contained about 53 000 “unigenes” (the sum of contigs plus sin-gletons), among which about 50% had reliable 3' ends and were therefore suitable for chip content. From these, probe sets were designed and the “Barley1” chip fabricated by Affymetrix. Complete details on the content of the barley microarray, and enhanced probe-set annotations, can be obtained using the software HarvEST:Barley, available from http://harvest.ucr.edu. The availability of an Affymetrix barley microarray has facilitated the study of gene expression on a large scale. Replicated experiments have revealed commonalities and differences between responses to abiotic stresses, and inherent differences between barley genotypes. The design and a brief summary of the results of drought stress experiments are stated.
Keywords: genomics; ESTs; microarray; abiotic stress
ing in barley was needed. The diploid nature of barley, together with a tradition of cooperation in genetic resource development, gave us the sense that barley held an advantageous position as a model for Triticeae plants. This team spirit helped to drive us forward.
There was considerable discussion about what would be the most appropriate first large-scale microarray for barley. If a barley-only array were produced, then would barley become isolated from other Triticeae transcriptome research? If an all-Triticeae array (we used the term “Trit-chip”) were produced from A, B, D, H, R, S and possibly other Triticeae genomes, then would it adequately sup-port any single Triticeae genome, including barley? We debated whether there should be a single bar-ley genotype, or several ones, represented on the array. If just one, then which one, my favourite or yours? If more than one, then what would be the mechanism of representing different alleles? There was also considerable debate over the appropriate format for a microarray. Should it be composed of whole cDNAs, 3' ends of cDNAs, oligonucleotides (oligos) in the 60–70 length range, or smaller oli-gos? Whole cDNAs would hybridise across many Triticeae genomes and therefore a cDNA-based chip might be most broadly useful, but precision would be compromised by cross-hybridisation between signals from paralogs within any single genome and by homoeologs in polyploid Trit-iceae. On the other extreme, multiple gene-specific 25-mers would provide excellent gene-specifi-city but require (at the time) some hundreds of thousands of dollars for the design fee alone. The literature of the period contained impres-sive research articles with data from each format. Images of thousands of green, red and yellow spots that could be scanned by the human eye with the assistance of image analysis software were popular in the late 1990’s. Larger datasets and attention to statistical validity had become more prominent elements of microarray publica-tions by 2002. Where would barley place its first community chips? The merits and limitations of each scenario were debated at PAG, every other venue that I can remember, and through waves of emails preceding various grant proposal dead-lines. In retrospect, the discussion process was extremely useful as a mechanism of community education, preparing us to recognize and seize tangible opportunities. But, the decision to pro-duce an Affymetrix chip for barley was ultimately
a pragmatic choice made by a few rather than a declaration of worldwide consensus. Engage-ment in this plan by worldwide colleagues came naturally from our habits of collegiality. Without a doubt, this had a positive outcome on the qual-ity of the final product.
A group of US investigators including Andris Kleinhofs (Principal Investigator, Washington State University), Gary Muehlbauer (University of Min-nesota), Rod Wing (Clemson University), Roger Wise (Iowa State University) and me, received grant funds in 2001 from the United States Depart-ment of Agriculture Initiative for Future Agricul-ture and the Food Supply Program that allowed us to move forward. Roger Wise, in particular, deserves credit for spearheading the decision to place most of the resources from this grant on the development of a microarray and its immediate use. Within this group, we had quite some debate over chip format. Our initial plan was to use a commercial provider to spot 10 000 whole cDNAs, each representing a single “unigene”. From my own perspective, as one who has an interest in a multigene family related to abiotic stress, the dehydrin gene family (C��� et al. 1999), whole-cDNA arrays did not appear to be a satisfactory format. Just one or a few cDNAs from this family would represent them all. There would then be no possibility to examine the expression of each gene individually. This same concern applied to resistance gene analogues and all other multigene families. I advocated against the whole-cDNA format. For a brief time, our plan shifted to the use of 3' ends of unigenes (truncated cDNA clones), but this required a different databasing method and sequencing strategy than we had initiated. Our shift of plans in favour of gene-specificity prompted Roger Wise to explore options to have commercial providers produce single 60- to 70-mer or multiple 25-mer arrays. We nearly chose the single long oligo method but in the end we were swayed by several apparent advantages of mul-tiple short 25-mers. These advantages included: (1) considerable cost savings in chip fabrication, (2) representation of a larger number of unigenes, each with more probes per unigene, and (3) less chance of bias in signal detection by multiple oligos versus a single oligo. The latter has since been validated in the literature (for example, R������� et al. 2003).
catch was that we had to provide our own infor-matics up to the point of delivery of “exemplars” (trimmed unigene sequences). The separation of paralogs and determination of orientation of unigene sequences to support the gene-specific oligo design demanded further changes in our databasing methods. Fortunately, my colleague Steve Wanamaker and I had already developed a relational database for barley and other Triticeae ESTs (HarvEST, http://harvest.ucr.edu) that could be readily adapted to accommodate these needs. HarvEST originated as an in-house tool for EST data management related to the design of oligos for PCR and BAC library probing. The HarvEST database became our informatics engine and sub-sequently provided foundational data for other viewing tools, foremost among which is BarleyBase (http://www.barleybase.org/), an excellent product of colleagues at Iowa State University.
It was an enlightening and enjoyable experi-ence to be deeply engaged in the development of content for the Barley1 microarray (C���� et al. 2004). It was also gratifying to turn our attention back to abiotic stress, and to see many colleagues succeeding with their use of this new resource.
MATERIAL AND METHODS
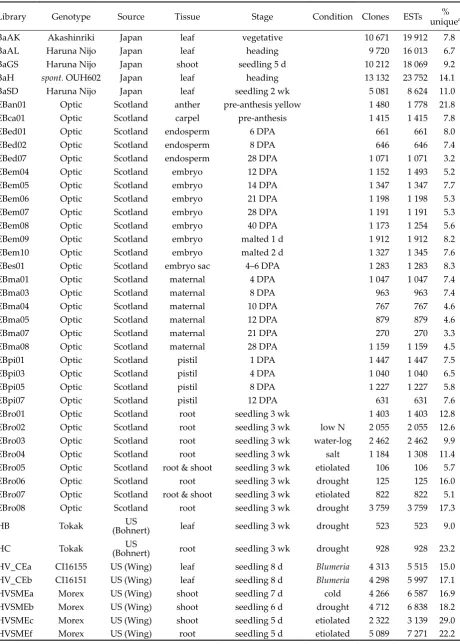
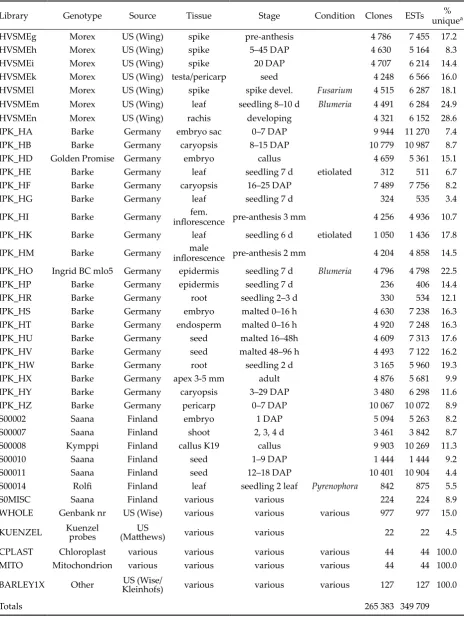
ESTs and other sequences. The first objective in the design of a microarray was to create a considerable “Expressed Sequence Tag” (EST) resource, from which chip content principally could be drawn. From January to October 2002, each project transmitted their EST data to my group at University of California, Riverside. This included either a pair of matching sequence and quality value files generated using the base-call-ing software “phred” from each EST (E���� & G���� 1998; http://www.phrap.org/) or the original chromatogram from which we then extracted the two phred files. By the end of 2002, worldwide projects had contributed approximately 350 000 high-quality barley ESTs originating from more than 400 000 raw sequences, constituting about 25 000 “unigenes” with satisfactory 3' ends for chip content. These came from 84 cDNA libraries representing various developmental stages, in addition to abiotic- and biotic-stress treatments (Table 1). Most of the EST data contributors and their barley EST projects are cited below.
Clemson University Genomics Institute, Clem-son, South Carolina, USA: Rod Wing and Dorrie
Main, with EST production support from Dilara Begum, David Frisch, Michael Atkins, Yeisoo Yu, D. Henry, M. Palmer, T. Rambo, J. Simmons and R. Oates. Supported by the United States Department of Agriculture – National Research Initiative project, “Establishment of a Genetically and Physically Anchored EST Resource for Bar-ley Genomics” (Andris Kleinhofs, PI; Rod Wing, Timothy Close, Roger Wise).
Institute of Plant Genetics and Crop Plant Re-search (IPK), Gatersleben, Germany: Andreas Graner, Nils Stein and Winfriede Weschke with support from Hangning Zhang, Elena Potokina, Volodya Radchuck and Jelena Perovic. Barley ESTs from the project “Partial Sequencing of cDNAs for the Generation of Expressed Sequence Tags (ESTS) of Barley” funded by the state of Saxony-Anhalt. Libraries and funding for these ESTs were also provided by the project “An Expressed Sequence Tagged (EST) database of barley”(Andreas Graner and Peter Landrigde PIs), funded by the Grains Research and Development Corporation, Govern-ment of Australia.
Okayama University, Japan: Kazuhiro Sato, Daisuke Saisho and Kazuyoshi Takeda. Nation-al Institute of Genetics, Japan: Yuji Kohara and Tadasu Shin-i. ESTs from the collaborative project between the Barley Germplasm Centre, Okayama University and Centre for Genetic Resource In-formation, National Institute of Genetics. This project has been supported by a Grant-in-aid for Scientific Research on Priority Areas C from the Ministry of Education, Culture, Sports, Science and Technology (MEXT) of Japan and by CREST (Core Research for Evolutional Science and Tech-nology) of JST (Japan Science and Technology Corporation).
Scottish Crop Research Institute (SCRI), Inver-gowrie, Dundee, Scotland, UK: Robbie Waugh, Peter Hedley, H. Liu, D. Caldwell, Luke Ramsay, David Marshall, and Linda Cardle. Developed as part of the barley transcriptome resources of BBSRC/SEERAD funded by Cereal Investigating Gene Function project.
R. Kelley, S. A. Sant, H. McLaughlin, and M. A. Fredricksen.
Institute of Biotechnology, University of Helsin-ki, HelsinHelsin-ki, Finland and MTT Agrifood Research, Jokioinen, Finland: Alan Schulman, Ari-Matti Sarén, Jaakko Tanskanen, and Lars Paulin with support from Tanja Horko and Ursula Lönnqvist. ESTs from the project “Production of EST tools for barley gene discovery and exploitation” funded by major contributions of TEKES, the National Technology Agency of Finland, and Boreal Plant Breeding Ltd., as well as by contributions from Polttimo Companies Ltd., and the Raisio Group, Ltd. Additional in-kind contributions from CSC- Scientific Computing Ltd., and Visipoint OY.
In addition, Dan Ashlock at Iowa State Uni-versity extracted complete barley cDNA and gene sequences from the National Center for Biotechnology “nr” database, and David Mat-thews, head curator of GrainGenes at Cornell University, provided sequences from Gottfried Kuenzel (IPK Gatersleben) that were available only from the GrainGenes database (http://wheat. pw.usda.gov/cgi-bin/graingenes/browse.cgi). The final sequences represented on the chip included commonly used transgenes suggested by Peggy Lemaux and Shibo Zhang, University of California, Berkeley and several disease resistance genes and additional control sequences provided by Roger Wise, Stacey Turner and Rico Caldo at Iowa State University and by Andris Kleinhofs.
Several barley genotypes were the source of tissues for cDNA libraries and ESTs (Table 1). In general, each group chose a spring malting barley popular in their own country as the main source of ESTs. Most of the US libraries were from Morex, the German from Barke, the Japanese from Haruna Nijo, the Scottish from Optic, and the Finnish from Saana. A few other genotypes also contributed to the EST dataset, including: Golden Promise, a two-row spring barley popu-lar for transformation; Kympii, a Finnish two-row spring malting barley that was a convenient source of callus tissue; one wild barley accession H. vulgare ssp. spontaneum OUH602; Akashinriki, another Japanese barley; Tokak, a Turkish barley chosen for drought studies (O����� et al. 2002); Rolfi, a Finnish spring feed barley studied for net blotch disease; and other genotypes containing resistance determinants in essentially a Morex or Ingrid background. The tissues spanned the range from roots to leaves to highly specialized
reproductive structures. Stages of development covered the gamut from germinated seed to ma-ture spike. Treatments included abiotic stresses and pathogen challenge in addition to normal growth. Further information on source materi-als is displayed within HarvEST:Barley and in GenBank accessions for each EST.
Library Genotype Source Tissue Stage Condition Clones ESTs unique% a
BaAK Akashinriki Japan leaf vegetative 10 671 19 912 7.8
BaAL Haruna Nijo Japan leaf heading 9 720 16 013 6.7
BaGS Haruna Nijo Japan shoot seedling 5 d 10 212 18 069 9.2
BaH spont. OUH602 Japan leaf heading 13 132 23 752 14.1
BaSD Haruna Nijo Japan leaf seedling 2 wk 5 081 8 624 11.0
EBan01 Optic Scotland anther pre-anthesis yellow 1 480 1 778 21.8
EBca01 Optic Scotland carpel pre-anthesis 1 415 1 415 7.8
EBed01 Optic Scotland endosperm 6 DPA 661 661 8.0
EBed02 Optic Scotland endosperm 8 DPA 646 646 7.4
EBed07 Optic Scotland endosperm 28 DPA 1 071 1 071 3.2
EBem04 Optic Scotland embryo 12 DPA 1 152 1 493 5.2
EBem05 Optic Scotland embryo 14 DPA 1 347 1 347 7.7
EBem06 Optic Scotland embryo 21 DPA 1 198 1 198 5.3
EBem07 Optic Scotland embryo 28 DPA 1 191 1 191 5.3
EBem08 Optic Scotland embryo 40 DPA 1 173 1 254 5.6
EBem09 Optic Scotland embryo malted 1 d 1 912 1 912 8.2
EBem10 Optic Scotland embryo malted 2 d 1 327 1 345 7.6
EBes01 Optic Scotland embryo sac 4–6 DPA 1 283 1 283 8.3
EBma01 Optic Scotland maternal 4 DPA 1 047 1 047 7.4
EBma03 Optic Scotland maternal 8 DPA 963 963 7.4
EBma04 Optic Scotland maternal 10 DPA 767 767 4.6
EBma05 Optic Scotland maternal 12 DPA 879 879 4.6
EBma07 Optic Scotland maternal 21 DPA 270 270 3.3
EBma08 Optic Scotland maternal 28 DPA 1 159 1 159 4.5
EBpi01 Optic Scotland pistil 1 DPA 1 447 1 447 7.5
EBpi03 Optic Scotland pistil 4 DPA 1 040 1 040 6.5
EBpi05 Optic Scotland pistil 8 DPA 1 227 1 227 5.8
EBpi07 Optic Scotland pistil 12 DPA 631 631 7.6
EBro01 Optic Scotland root seedling 3 wk 1 403 1 403 12.8
EBro02 Optic Scotland root seedling 3 wk low N 2 055 2 055 12.6
EBro03 Optic Scotland root seedling 3 wk water-log 2 462 2 462 9.9
EBro04 Optic Scotland root seedling 3 wk salt 1 184 1 308 11.4
EBro05 Optic Scotland root & shoot seedling 3 wk etiolated 106 106 5.7
EBro06 Optic Scotland root seedling 3 wk drought 125 125 16.0
EBro07 Optic Scotland root & shoot seedling 3 wk etiolated 822 822 5.1
EBro08 Optic Scotland root seedling 3 wk drought 3 759 3 759 17.3
HB Tokak (Bohnert)US leaf seedling 3 wk drought 523 523 9.0
HC Tokak (Bohnert)US root seedling 3 wk drought 928 928 23.2
HV_CEa CI16155 US (Wing) leaf seedling 8 d Blumeria 4 313 5 515 15.0
HV_CEb CI16151 US (Wing) leaf seedling 8 d Blumeria 4 298 5 997 17.1
HVSMEa Morex US (Wing) shoot seedling 7 d cold 4 266 6 587 16.9
HVSMEb Morex US (Wing) shoot seedling 6 d drought 4 712 6 838 18.2
HVSMEc Morex US (Wing) shoot seedling 5 d etiolated 2 322 3 139 29.0
[image:5.595.67.528.103.748.2]HVSMEf Morex US (Wing) root seedling 5 d etiolated 5 089 7 271 22.2
Table 1 to be continued
Library Genotype Source Tissue Stage Condition Clones ESTs unique% a
HVSMEg Morex US (Wing) spike pre-anthesis 4 786 7 455 17.2
HVSMEh Morex US (Wing) spike 5–45 DAP 4 630 5 164 8.3
HVSMEi Morex US (Wing) spike 20 DAP 4 707 6 214 14.4
HVSMEk Morex US (Wing) testa/pericarp seed 4 248 6 566 16.0
HVSMEl Morex US (Wing) spike spike devel. Fusarium 4 515 6 287 18.1
HVSMEm Morex US (Wing) leaf seedling 8–10 d Blumeria 4 491 6 284 24.9
HVSMEn Morex US (Wing) rachis developing 4 321 6 152 28.6
IPK_HA Barke Germany embryo sac 0–7 DAP 9 944 11 270 7.4
IPK_HB Barke Germany caryopsis 8–15 DAP 10 779 10 987 8.7
IPK_HD Golden Promise Germany embryo callus 4 659 5 361 15.1
IPK_HE Barke Germany leaf seedling 7 d etiolated 312 511 6.7
IPK_HF Barke Germany caryopsis 16–25 DAP 7 489 7 756 8.2
IPK_HG Barke Germany leaf seedling 7 d 324 535 3.4
IPK_HI Barke Germany inflorescence pre-anthesis 3 mmfem. 4 256 4 936 10.7
IPK_HK Barke Germany leaf seedling 6 d etiolated 1 050 1 436 17.8
IPK_HM Barke Germany inflorescence pre-anthesis 2 mmmale 4 204 4 858 14.5 IPK_HO Ingrid BC mlo5 Germany epidermis seedling 7 d Blumeria 4 796 4 798 22.5
IPK_HP Barke Germany epidermis seedling 7 d 236 406 14.4
IPK_HR Barke Germany root seedling 2–3 d 330 534 12.1
IPK_HS Barke Germany embryo malted 0–16 h 4 630 7 238 16.3
IPK_HT Barke Germany endosperm malted 0–16 h 4 920 7 248 16.3
IPK_HU Barke Germany seed malted 16–48h 4 609 7 313 17.6
IPK_HV Barke Germany seed malted 48–96 h 4 493 7 122 16.2
IPK_HW Barke Germany root seedling 2 d 3 165 5 960 19.3
IPK_HX Barke Germany apex 3-5 mm adult 4 876 5 681 9.9
IPK_HY Barke Germany caryopsis 3–29 DAP 3 480 6 298 11.6
IPK_HZ Barke Germany pericarp 0–7 DAP 10 067 10 072 8.9
S00002 Saana Finland embryo 1 DAP 5 094 5 263 8.2
S00007 Saana Finland shoot 2, 3, 4 d 3 461 3 842 8.7
S00008 Kymppi Finland callus K19 callus 9 903 10 269 11.3
S00010 Saana Finland seed 1–9 DAP 1 444 1 444 9.2
S00011 Saana Finland seed 12–18 DAP 10 401 10 904 4.4
S00014 Rolfi Finland leaf seedling 2 leaf Pyrenophora 842 875 5.5
S0MISC Saana Finland various various 224 224 8.9
WHOLE Genbank nr US (Wise) various various various 977 977 15.0
KUENZEL Kuenzel probes (Ma�hews)US various various 22 22 4.5
CPLAST Chloroplast various various various various 44 44 100.0
MITO Mitochondrion various various various various 44 44 100.0
BARLEY1X Other Kleinhofs)US (Wise/ various various various 127 127 100.0
Totals 265 383 349 709
a % unique is defined as the number of contigs and singletons that are unique to the library divided by the number of
(13) sequences with reliable 3' ends were deter-mined, (14) reverse orientation unigene sequences were converted to forward-oriented sequences, (15) multiple poly(A) sites were trimmed to their first poly(A) site to define “exemplars” that were transmitted to Affymetrix for probe set (oligo) design, (16) several unigenes were designated as standards for labelling controls, (17) additional sequences were added as controls and for other anticipated research purposes. All information from these steps was recorded in a Visual FoxPro relational database, from which the HarvEST: Barley software is an extraction product. Anno-tations of the probe sets (rice gene model, etc.) can be exported from HarvEST:Barley using the “Search the Barley Chip” function.
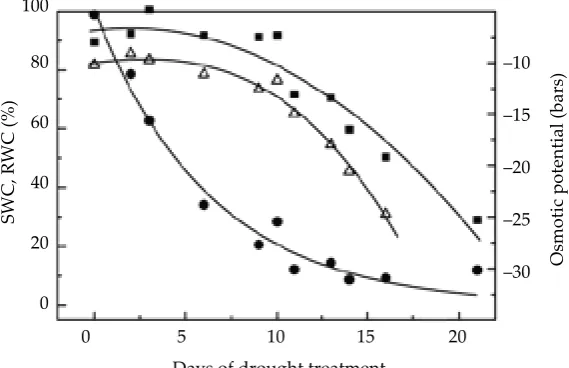
Drought stress. Morex barley seeds were sown in pots filled with a standard soil mixture at a density of 40 seeds per pot. Plants were grown in a growth chamber with 23/20°C day/night tem-peratures and 12 h photoperiod. Ten days after sowing, water was withheld from “stressed” mate-rial, while watering was continued for unstressed reference material. The pots were weighed at regular intervals for calculation of the soil water content (SWC). SWC was determined as the water content relative to the total soil water content 16 h after complete hydration. For each of three fully replicated experiments, samples were taken when the SWC was approximately 70, 35, 20, 12 and 8%. Leaf relative water content (RWC) was measured in two fully expanded leaves. Osmotic potential was measured in pressure-extruded leaf-sap using a vapour pressure osmometer (model 5100C, Wescor Inc. Logan, Utah) with sugar so-lutions as a calibration curve. Experiments were
also conducted on low temperature, salinity and abscisic acid treatment (not shown). Total RNA was isolated from crown tissue using TRIzol Rea-gent following the procedure described in the Arabidopsis consortium web site (http://www. arabidopsis.org/info/2010_projects/comp_proj/ AFGC/RevisedAFGC/site2RnaL.htm). Further purification was achieved using an RNeasy spin column (Qiagen, Chatsworth, CA) with on-col-umn DNase treatment, following the manufac-turer’s instructions, to remove contaminating DNA and tRNAs, 5S RNA and most RNA less than 200 bases.
RESULTS AND DISCUSSION
Barley unigenes and microarray content
A previous description of the content and per-formance of the Barley1 microarray summarized categories of exemplar sequences and data related to error rates and applicability of the Barley1 microarray to other cereal plants (C���� et al. 2004). We stated in that publication that the Barley1 chip represents more than 21 000 non-redundant exemplar sequences. While this is correct in the context of the sequence assembly that we used, a more conservative estimate of the number of barley genes represented by the Barley1 chip is about 14 000, or about 30% of the barley genome if we assume that barley and rice have about the same number of genes. A BLASTX search of rice coding sequences available from TIGR (ftp://ftp. tigr.org/pub/data/Eukaryotic_Projects/o_sativa/anno-tation_dbs/pseudomolecules/version_2.0/all_chrs/all. cds) revealed that 85.5% of 21 350 unigenes
repre-0 5 10 15 20
Days of drought treatment
–10
–15
–20
–25
–30 O
sm
ot
ic
p
ot
en
tia
l (
ba
rs
)
SW
C
, R
W
C
(%
)
100
80
60
40
20
[image:7.595.63.348.567.751.2]0 SWC – circles; RWC – squares; leaf sap osmotic potential, triangles
sented by Barley 1 probe sets (18 523) match a rice coding sequence at an e-score of -5 or better, but only 11 805 rice coding sequences account for all of these matches. If we assume that the remaining 14.5% of barley unigenes (those without a high match to rice) have a similar compression rate (11 805/18 523), then the Barley1 chip may rep-resent about 13 200 barley genes. This would be an overly conservative estimate, however, since the rice genome has not yet been fully annotated and the number of barley unigenes that match rice genes is higher if the e-score threshold is relaxed. In addition, alternative polyadenylation sites and other splice variants are often represented by the Barley1 probe sets. A conservative estimate of the number of barley genes represented on the Barley1 microarray is therefore about 14 000. From the per-spective of abiotic stress, it is interesting to make an equivalent assessment considering 17 “osmotic stress related” libraries including drought, low temperature, salinity, embryo dehydration and pollen maturation. Together, these 17 libraries contributed 8 068 non-redundant unigenes (of about 21 400), among which 89.9% (7 254) match rice version 2.0 coding sequences at an e-value of -5 or better. Furthermore, these stress-related libraries account for 51.4% (6072/11 805) of rice coding sequences identified as highest BLASTX match with barley genes represented on the chip. The Barley1 microarray therefore seems to be an excellent tool for initial investigations of abiotic stress responses.
Drought stress
In the experiments described in Materials and Methods and illustrated in Figure 1, it was ob-served (Edmundo Rodriguez, University of Cali-fornia, Riverside, unpublished) that there were clear, reproducible differences in the categories of genes that were expressed at different stages of the stress treatment. For example the dehydrin genes, which are a favourite topic in my laboratory (C��� et al. 1999), were expressed mainly during the most severe stages of the stress treatment. In contrast, changes in the expression of transcrip-tion factors were a prominent theme of the early stage of the stress treatment. The location of some of these genes on the barley linkage map, and on the rice linkage map using orthology and synteny relationships between barley and rice, provide some intriguing examples of stress-regulated genes
that are candidates for stress tolerance traits. For example, the drought-up-regulated dehydrin gene Dhn6 is located within a region of chromosome 4H recently associated by SSR markers with drought tolerance (I������ et al. 2003).
CONCLUSION
The Barley1 microarray provides an excellent starting point for global analysis of gene expres-sion in abiotic stress and other aspects of barley, representing some 30% of the genes in the barley genome. Major changes in transcriptional activity can readily be measured using this new device, and the standardised platform facilitates data sharing. It is now appropriate for the barley community to engage in the design of a microarray representing a larger number of barley genes.
Acknowledgments. Excellent advice of the Affymetrix chip design team, especially A��� W������� and E��� S�����, is also gratefully acknowledged.
References
A������� S.F., M����� T.L., S������� A.A., Z���� J., Z���� Z., M����� W., L����� D.J. (1997): Gapped BLAST and psi-BLAST: A new generation of protein database search programs. Nucleic Acids Research,
25: 3389–3402.
C��� D.W., Z�� B., C���� T.J. (1999): The barley (Hordeum
vulgare L.) dehydrin multigene family: sequences,
allelic variation, chromosome assignments, and
ex-pression characteristics of 11 Dhn genes of cv. Dicktoo.
Theoretical and Applied Genetics, 98: 1234–1247.
C���� T.J., W�������� S., C���� R., T����� S.M., A������ D.A., D�������� J.A., W��� R.A., M����-����� G.J., KM����-�������� A., W��� R.P. (2004): Global expression profiling in cereals: 22K barley GeneChip
comes of age. Plant Physiology, 134: 960–968.
E���� B., G���� P. (1998): Base-calling of automated sequencer traces using Phred II. Error probabilities.
Genome Research, 8: 186–194.
H���� X., M���� A. (1999): CAP3: a DNA sequence
assembly program. Genome Research, 9: 868–877.
I������ V., T����� W.T.B., N��� E., Z���� Z., F��-���� B.P. (2003): Associations of simple sequence repeats with quantitative variation including biotic
and abiotic stress tolerance in Hordeum spontaneum.
Plant Breeding, 122: 300–304.
Abstrakt
C���� T. J. (2005): DNA pole ječmene. Společná vize a aplikace na studium abiotických stresů. Czech J. Genet. Plant Breed., 41: 144–152.
DNA čip (microarray) reprezentující přibližně 20 000 genů ječmene byl vytvořen v USA jako část projektu, který má název „ Integrovaná fyzikální a expresní mapa ječmene pro šlechtění Triticeae“. Obsah čipu byl odvozen z více než 400 000 EST (Express Sequence Tag) získaných od spolupracovníků v USA, Německu, Austrálie, Japonsku, Skotsku a Finsku a 1000 sekvencí obdržených z databází GenBank nr nebo GrainGenes. Všechny EST sekvence byly vybrány na základě vysoké kvality, příměsi byly identifikovány a odstraněny, a zbývající informace byla zkompletována s využitím programu CAP3. Stringentní soubor (s odstraněnými „paralogy“ sekvencí) obsahoval okolo 53 000 „unigenů“ (suma „contigů a singletonů“), z nichž 50 % mělo spolehlivé 3' konce a byly proto vhod-né pro obsah čipu. Z této sestavy byl navržen zkušební „Barley 1“ čip, vyrobený firmou Affymetrix. Kompletní detaily, pokud jde o obsah DNA čipu ječmene, včetně rozšířených anotací použitých sond mohou být získány pomocí softwaru HarvEST:Barley, který je dostupný z http://harvest.urc.edu. Dostupnost DNA čipu ječmene fir-my Affymetrix umožnila studium exprese genů ve velkém rozsahu. Opakované pokusy odhalily shodu i rozdíly v reakcích na abiotické stresy a dědičně podmíněné rozdíly mezi genotypy ječmene. V práci je uvedeno pokusné uspořádání, jakož i stručné výsledky pokusů zaměřených na studium vlivu stresu sucha.
Klíčová slova: genomika; ESTS; microarray; abiotický stres
Corresponding author:
Prof. Dr. T������ J. C����, University of California, Department of Botany & Plant Sciences, 2150 Batchelor Hall, Riverside, CA, USA 92521-0124
tel.: + 951 827-4619; fax: + 951 827-4437, e-mail: [email protected] B������ H.J. (2002): Monitoring large-scale changes
in transcript abundance in drought- and salt-stressed
barley. Plant Molecular Biology, 48: 551–573.
R������� A.T., O�� W.E., S��� B.K., G������ E.E. (2003): Comparing the use of Affymetrix to spot-ted oligonucleotides microarrays using two retinal
pigment epithelium cell lines. Molecular Vision, 9:
482–496.
Z���� Z., S������� S., W����� L., M����� W. (2000): A greedy algorithm for aligning DNA sequences.
Journal of Computational Biology, 7: 203–214.