ISSN Online: 2167-9541 ISSN Print: 2167-9533
Research on P2P Network Loan Risk Evaluation
Based on Generalized DEA Model and R-Type
Clustering Analysis under the Background of
Big Data
Ximing Lv
1,2, Lan Zhou
3, Rui Zhang
3, Xiaona Guo
31School of Mathematical Sciences, Inner Mongolia University, Hohhot, China
2School of Statistics and Mathematics, Inner Mongolia University of Finance and Economics, Hohhot, China 3School of Finance, Inner Mongolia University of Finance and Economics, Hohhot, China
Abstract
Internet financial risk is not only directly related to the operation and devel-opment of the Internet financial system itself, but also has a very important impact on the country’s macroeconomic operation because of its rapid devel-opment speed and growing scale of develdevel-opment. As of February 2017, there were 2335 network loan platforms, among which 55 platforms for problem existed. The event, similar to the platform responsible person absconded with money frequently occurred due to lax supervision, credit risk and so on. Therefore, it is very important to evaluate the financial risks of Internet scien-tifically. This paper takes the top 100 P2P network loan platform risk controls, obtained the net loan home’s rating authentication, as the main research ob-ject. The evaluation index system is structured from three dimensions, respec-tively as follows: liquidity risk, market risk and credit risk. The R-type cluster analysis is used to reduce the dimension of the index system, and the core in-dex evaluation system is obtained finally. On the basis of this, the risk control capability efficiency of that was evaluated for the first time by the classical DEA-CCR model, and then carried out the excellent, the good, the medium and the poor risk control capacity efficiency rating according to the pre-set step size. The excellent refers to the network loan platforms whose ranking is in the first quarter of the comprehensive efficiency derived by DEA-CCR; non-excellent network loan platform refers to the study of 100 network lend-ing platforms in addition to the excellent lendlend-ing platform other than the re-search platform. Taking the Excellent P2P network loan platforms as the ref-erence set and the Non - excellent as the evaluation set, this paper also uses the new generalized DEA model to carry on the research of the “catch-up effi-ciency” and projection analysis, and obtains the projection value of the non-
How to cite this paper: Lv, X. M., Zhou, L., Zhang, R., & Guo, X. N. (2017). Re-search on P2P Network Loan Risk Evalua-tion Based on Generalized DEA Model and R-Type Clustering Analysis under the Back-ground of Big Data. Journal of Financial Risk Management, 6, 163-190.
https://doi.org/10.4236/jfrm.2017.62013
Received:April 29, 2017 Accepted: June 20, 2017 Published: June 23, 2017 Copyright © 2017 by authors and Scientific Research Publishing Inc. This work is licensed under the Creative Commons Attribution International License (CC BY 4.0).
excellent network lending platform, that is, the improvement value of the non-excellent network lending platform in each research index, and provides a feasible way for the non-excellent P2P network loan platforms to change to the excellent P2P network loan platforms.
Keywords
Generalized DEA, Cluster Analysis, Internet Finance, Risk Evaluation, P2P Network Loan, Big Data
1. Introduction
making units reference set, but also includes more unit comparison information such as average units (such as the enrollment mark), low units (such as the to-lerable limit) or some special units (such as the selected samples, standards or some special objects). Ma (2012b) proposed the construction of “generalized DEA” theory and method, and then the theory is further applied to multi- attribute decision-making unit evaluation method, fuzzy comprehensive evalua-tion method, preferred ranking method, risk assessment method, evaluaevalua-tion combination efficiency method, panel data analysis method, system analysis methods, as well as the field of biophysics and other applications. The analytical model of sample data envelopes with preference cone is given by Ma and Lv (2007), and the distribution characteristics and projection properties of the deci-sion unit in the sample are analyzed. Ma and Zhao (2016) established the gene-ralized DEA model and extended a necessary and sufficient condition for judg-ing the existence of feasible solutions to the generalized DEA model, and the condition that the unit efficiency is overrated. Effectively solve the problem of effective measurement. Ouyang and Mo (2016) pointed out the daily yield data based on the Internet index and the Shanghai Composite Index, moreover, es-tablished the Pareto extreme value distribution model and the historical simula-tion model under the VaR method to measure the financial risk value of the In-ternet. Finally, concluded that the Internet risk is greater than the risk of the en-tire stock market. Sha (2015), who puts forward the opinions of strengthening the internal risk management, external supervision of the platform, standardiz-ing the development of the industry and promotstandardiz-ing the financial innovation through analysing the collapse of P2P network loan platform. Si and Sun (2011) use MATLAB to standardize the data and find out the data index with strong correlation to reduce their dimension. Wang and Shi (2016) used CRITIC-gray relational model to construct the Internet financial risk evaluation system, using VaR method to measure the size of Internet risk. Zhang, Ramakrishnan and Livny (1996) proposed the Birch (Blanced Iterative Reducing and Clustering) algorithm to cluster large-scale data sets. The algorithm is a very effective and traditional hierarchical clustering algorithm, which can be effectively clustered with a scan and can effectively deal with outliers.
This paper discusses the Internet financial risk assessment from the aspects of constructing reasonable evaluation index system, efficiency evaluation and clas-sification, “catch-up efficiency” research and projection analysis. Based on the loan data of 95 representative P2P network loan platforms in the top 100, which obtained the net loan home’s rating authentication (of which five companies due to lack of partial data are not yet considered), on the following aspects of the In-ternet financial risk assessment issues:
which have the core influence on the Internet financial risk.
Secondly, the initial rating and classification of risk control capability effi-ciency were carried out. Selecting the selected core indicators as input-output system, the article uses the DEA-CCR model to evaluate the comprehensive effi-ciency value, pure technical effieffi-ciency value and scale effieffi-ciency value of the network loan platform, and finally obtains the ranking of network loan platform’s comprehensive efficiency, and dividing the platform into the excellent, the good, the medium and the poor four grades according to the defined step size.
Finally, the study on “catch-up efficiency” and projection analysis were car-ried out. Taking the excellent network loan platform as the reference set, the other non-excellent P2P network loan platforms is used as the evaluation set. The study uses the generalized DEA method to obtain the relative efficiency of other non - excellent P2P network loan platforms, and obtains the catch-up effi-ciency by the DEA projection formula, gives the feasible path of the transforma-tion of the non-excellent P2P network loan platforms to the excellent P2P net-work loan platforms.
2. Construction of Evaluation Index System
This paper chooses the network loan platform as the research object, carries on the wind control evaluation research to it. Because of the rapid development trend and the massive scale of China’s Internet finance, the most important is it has an unpredictable influence on our economy. The central bank has made a regulatory system on the network loan platform continuously, which marks the network loan platform has been basically incorporated into the regulatory sys-tem. The network loan platform not only plays a fueled role in the development of Internet finance, but also has a great impact on Internet Finance.
The Selection of Indicators
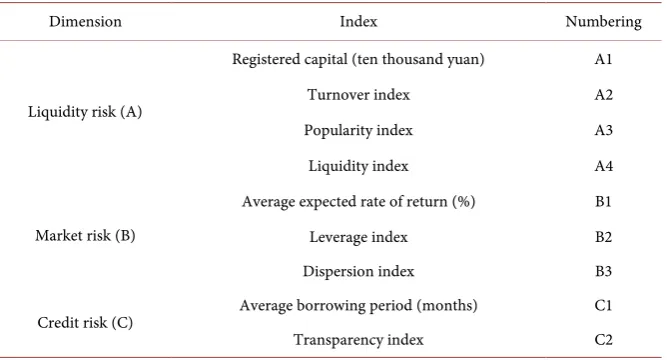
popularity index, which greatly enhances the flexibility of the Internet financial evaluation system. The Internet financial risk evaluation index system con-structed in this paper is shown in Table 1, which is a combination of Basel’s re-quirements for information disclosure of commercial banks, the enhancement of information transparency and the improvement of information asymmetry, taking into account the impact of average expected return rate, average borrow-ing period and transparency index on the Internet financial risk, and finally dif-ferent types of data were selected.
3. Research Methodology
3.1. R-Type Cluster Analysis Model
3.1.1. Data NormalizationUsing MATLAB software to assist the model to calculate the average of the data after its standardization
, 1, 2, , −
= ij j =
ij j
a a
b i n
s (1)
(
)
21 1
1 , 1
1
= =
= = −
−
∑
m∑
mj ij j ij j
i i
a a s a a
m m (2)
3.1.2. Determine the Variable Similarity Measure
Using MATLAB software to assist the model and find the correlation coefficient between the data. The value of the variable xj is determined by
(
x x1j, 2j, , xrj)
,n
T R∈
(
j=1, 2, , m)
. Then can use of sample correlation coefficient of the two variables x and y as its variables with similarity. That is:(
)(
)
(
) (
)
1 1 2 2 2 1 1 = = = − − = − − ∑
∑
∑
nij j ik k
i ij
n n
ij j ik k
i i
x x x x
r
x x x x
[image:5.595.208.542.531.711.2](3)
Table 1. Interne financial risk assessment index system.
Dimension Index Numbering
Liquidity risk (A)
Registered capital (ten thousand yuan) A1 Turnover index A2 Popularity index A3 Liquidity index A4
Market risk (B)
Average expected rate of return (%) B1 Leverage index B2 Dispersion index B3 Credit risk (C) Average borrowing period (months) C1 Transparency index C2
3.1.3. Calculate the Similarity Measure
The similarity of the data index is obtained by using the averaging method
(
1 2)
(
)
1 2
1
, ,
∈ ∈
=
∑ ∑
i i j j
i j x G x G
D G G d x x
n n (4)
It is equal to the average of the distance between the two sample points, where the number of sample points is the number.
3.1.4. Using Matlab to Draw Clustering Tree Write code in matlab modeling software:
clear
load yuanshishuju.txt
d = pdist (‘yuanshishuju’, ‘correlation’); z = linkage (d, ‘average’);
h = dendrogram (z);
set (h, ‘Color’, ‘k’, ‘Line Width’, 1.3) T = cluster (z, ‘maxclust’, 4) for i = 1:4
tm = find (T == i);
tm = reshape(tm, 1, length (tm)); fprintf (‘%dth%s\n’, i, int2str (tm)); End
The R-type clustering tree analysis map is obtained, the dimension of the se-lected data index is reduced, the core data index which affects the borrowing platform is selected, and the input and output index system is established to car-ry on the concrete analysis.
3.2. Classical DEA - CCR Model
Through the classical DEA-CCR model, the input and output systems was estab-lished on the six indexes, among which the registered capital and the average expected yield were taken as the input index, and the leverage index, the disper-sion index, the liquidity index and the transparency index were used as the out-put index, obtained the comprehensive efficiency values of each loan platform and the classification efficiency of the network loan platform. According to the final DEA results, the loan platform listed in this paper is divided into four grades: the excellent, the good, the medium and the poor. Then, efficiency of the network loan platform in the department can be derived according to the fre-quency of the various departments in each level.
3.2.1. Establishment of Decision-Making Unit
Table 2. Input and output data of the decision unit.
Decision unit 1 2 .... j .... n
In the table,
ij
x is the input of the j-th decision unit to the i-th input; xij >0
rj
y is the output of the j-th decision unit to the r-th output; yrj >0 i
v is a measure of the i-th input (or the right); r
u is a measure of the r-th output (or the right),
Among them,
i
=
1,2, ,
m
,r
=
1,2, ,
s
, j=1, 2, , n. For the sake of con- venience, sign(
)
T1, , ,2 , 1, 2, , ,
= =
xj x xj j xmj j n
(
)
T1 , 2 , , , 1, 2, , ,
= =
yj y yj j ysj j n
(
)
T1, , ,2 ,
=
v v v vm ,
(
)
T1, , ,2 .
=
u u u us
3.2.2. Selection of Weighting Coefficient and Establishment of CCR Model For the weighting factors v∈Em and u∈Es, (v is M-dimensional real vector, u is S-dimensional real vector), the efficiency evaluation index of decision unit j is
1
1
= =
=
∑
∑
s r rj r
j m
i ij i
u y h
v y (5)
It is always possible to appropriately select the weighting factor u and v so that it satisfies the following condition:
1, =1, 2, ,
j
h j n
when evaluating the efficiency of the j0 (1 j0 n) decision unit, with weight coefficients u and v as variables, taking the efficiency index of the j0 deci-sion-making unit as a target, take the efficiency index
1, =1, 2, ,
j
h j n
( )
0 0 2 T P T TC R T
max ,
P s.t. 1, 1, 2, , ,
, . = = ≥ ≥ u y v x u y v x v u j j j j V j n 0 0 (6)
Here “” means that each component is less than or equal to, “≤” means that each component is less than or equal to and at least one component is not equal, and “<” means that each component is less than and does not equal.
3.3. New DEA Model
—
Generalized DEA Model
Take the excellent network loan platforms as a reference set, and the other net-work loan platforms as an evaluation set. The generalized DEA model is used to obtain the catch-up efficiency value of the non-excellent network loan platform, and obtain the improvement value of the non-excellent network loan platform according to the projection analysis. Finally according to the excellent platform indicators for the non-excellent platform to provide improved strategy.
3.3.1. Establishment of Generalized DEA Model
Suppose there are n decision units to be evaluated and n sample units or stan-dards (the following collectively referred to as the sample unit), their characteris-tics can be represented by m kinds of inputs and s kinds of output indicators,
(
)
T1 , 2 , ,
=
p p p mp
x x x x Represents the input index value of the p-th decision unit,
(
)
T1 , 2 , ,
=
p p p sp
y y y y Represents the output index value of the p-th deci-sion unit,
(
)
T1 , 2 , ,
=
j j j mj
x x x x Represents the input index value of the j-th decision unit,
(
)
T1 , 2 , ,
=
j j j sj
y y y y Represents the output index value of the j-th decision unit,
And they are all positive numbers. The following generalized DEA model can be constructed for the decision unit P:
(
)
( )
T T T 2 T max ,s.t. 0, 1, , ,
G-C R 1, , . p j j p V d
d j n
= − = = y x y x 0 0 µ ω µ ω ω µ (7)
where
ω
=(
ω ω
1, , ,2ω
m)
T is the weight of the output indicator,(
)
T1, , ,2
µ µ
µ
= s
µ
is the weight of the output indicator, and d is a positive number, called the moving factor.3.3.2. The Establishment of the G-CCR Model
(
)
( )
1 2 1 min , s.t. , DG-C R ,0, 1, 2, , .
θ λ θ λ λ = = = =
∑
∑
x x y y nj j p j
n
j j p j j D d d j n (8)
It can be proved that the (G-C2R) model has the optimal solution
3.3.3. Definition of the G-DEA Model
(1) If the optimal value V d
( )
1 of G-C2R is planned, then called the deci-sion-making unit p is weakly effective relative to the dice of the leading edge of the sample data, which is referred to as G-DEA (d) weakly effective (G-C2R);(2) If the optimal value of (G-C2R) is planned as one of the following situation: ①
ω
0>0,µ
0>0, make V d( )
=1;② V d
( )
>1It is said that the decision unit is effective for the d-times movement of the sample data’s leading edge, referred to as G-DEA (d) effective (G-C2R).
In particular, when
d
=
1
, say G-DEA (1) weakly effective is G-DEA weakly effective, say G-DEA effective is G-DEA effective.3.3.4. “Catch up with the Object” and “Catch the Object” to Establish It can be determined that the excellent network loan platforms are pursued ob-ject through the rating results, set it as a reference set; determine the non-excellent loan platforms as chasing object, set it as an evaluation set.
3.4. The “Projection Analysis” Based on the “Catch-up Efficiency”
Definition of projection analysis:Can be retrieved by the DEA projection formula:
ˆ =
θ
− −,ˆ = + +i i i i i i
x x s y y s (9) The value of the improved object can be achieved:
(
)
ˆ 1 θ −; ˆ +
∆ =xi xi−xi = − xi+si ∆ =yi yi−yi =si (10)
4. Empirical Results and Analysis
4.1. Clustering Analysis Model
By using R-type clustering analysis to classify the indicators, the conclusion that there may be a strong correlation between some indexes which can be obtained by qualitatively examining the nine evaluation indexes of the reaction sample network loan platform. In order to verify this idea, using MATLAB software added model to calculate the correlation coefficient, and then further analysis of the problem.
Calculate the average of the nine-indicator data for the 95 network loan plat-forms in February 2017, and change the standard to
[
x x1, , ,2 x9]
.(2) Data standardization
In order to ensure the reliability of the results, it is necessary to standardize the data of each index. In practical problems, the measurement units of discrete variables are often dissimilar, in the multi-index evaluation system, the nature, dimension and magnitude of each index are often altered especially. In the case of substantial differences, it will lead to a larger index in the comprehensive analysis has a strong influence if use original data for analysis directly, while the smaller indicators of the impact are smaller. In order to eliminate the dimen-sional effect of the variables, so that each variable has the same expressive force, and to ensure the reliability of the results, it is necessary to standardize the data of each index. That is
, 1, 2, , ; 95, 9
−
= ij j = = =
ij j
a a
b i n m n
s (11)
Among them,
(
)
21 1
1 , 1 .
1
= =
= = −
−
∑
m∑
mj ij j ij j
i i
a a s a a
m m (12)
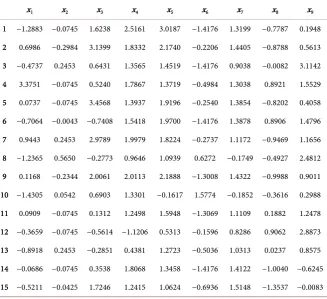
[image:10.595.210.538.412.711.2]The results of the standardized treatment are shown in Table 3 below:
Table 3. Data after the standardized results.
x1 x2 x3 x4 x5 x6 x7 x8 x9
1 −1.2883 −0.0745 1.6238 2.5161 3.0187 −1.4176 1.3199 −0.7787 0.1948 2 0.6986 −0.2984 3.1399 1.8332 2.1740 −0.2206 1.4405 −0.8788 0.5613 3 −0.4737 0.2453 0.6431 1.3565 1.4519 −1.4176 0.9038 −0.0082 3.1142 4 3.3751 −0.0745 0.5240 1.7867 1.3719 −0.4984 1.3038 0.8921 1.5529 5 0.0737 −0.0745 3.4568 1.3937 1.9196 −0.2540 1.3854 −0.8202 0.4058 6 −0.7064 −0.0043 −0.7408 1.5418 1.9700 −1.4176 1.3878 0.8906 1.4796 7 0.9443 0.2453 2.9789 1.9979 1.8224 −0.2737 1.1172 −0.9469 1.1656 8 −1.2365 0.5650 −0.2773 0.9646 1.0939 0.6272 −0.1749 −0.4927 2.4812 9 0.1168 −0.2344 2.0061 2.0113 2.1888 −1.3008 1.4322 −0.9988 0.9011 10 −1.4305 0.0542 0.6903 1.3301 −0.1617 1.5774 −0.1852 −0.3616 0.2988 11 0.0909 −0.0745 0.1312 1.2498 1.5948 −1.3069 1.1109 0.1882 1.2478 12 −0.3659 −0.0745 −0.5614 −1.1206 0.5313 −0.1596 0.8286 0.9062 2.8873 13 −0.8918 0.2453 −0.2851 0.4381 1.2723 −0.5036 1.0313 0.0237 0.8575 14 −0.0686 −0.0745 0.3538 1.8068 1.3458 −1.4176 1.4122 −1.0040 −0.6245 15 −0.5211 −0.0425 1.7246 1.2415 1.0624 −0.6936 1.5148 −1.3537 −0.0083
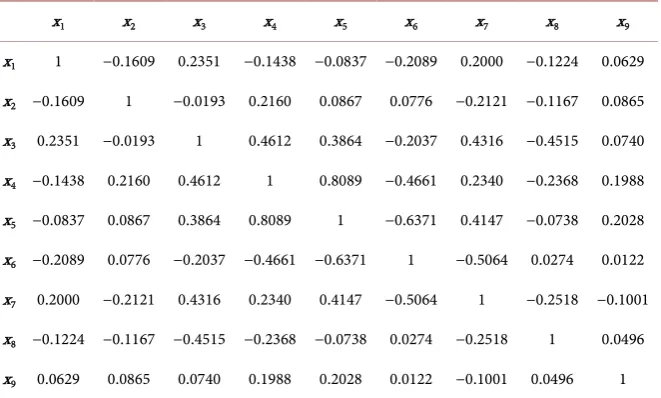
4.1.2. Determine the Variable Similarity Measure
In the case of clustering analysis of variables, we should first establish the simi-larity measure of the variables, which we showed by the correlation coefficient there. The value of the variable x is determined by
(
x x1j, 2j, , xnj)
, T R∈ n(
j=1,2, , m)
. Then can use of sample correlation coefficient of the two va-riables x and y as its variables with similarity. That is:(
)(
)
(
) (
)
1 1 2 2 2 1 1, 9, 95.
= = = − − = = = − −
∑
∑
∑
nij j ik k
i ij
n n
ij j ik k
i i
x x x x
r n m
x x x x
(13)
The correlation coefficient matrix is shown in Table 4 below:
4.1.3. Calculate the Similarity Measure
The similarity of the data index as follows is obtained by using the group average method:
(
)
(
)
1 2 1 2 1 2 1 , , ∈ ∈ =∑ ∑
i j i j x G x GD G G d x x
n n (14)
It is equal to the average distance between two sample points, in the formula are the number of sample points in respectively.
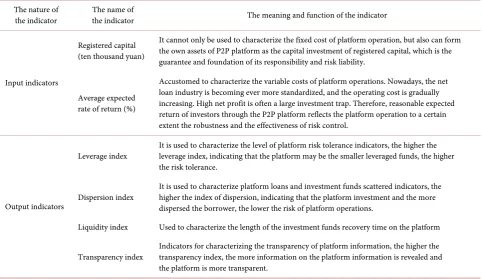
[image:11.595.209.540.516.715.2]Using MATLAB software, get the cluster tree is shown in Figure 1 below. It can be seen from the cluster diagram that the four indicators have a greater correlation, including the average borrowing period (month), transaction index, popularity index and the index of divergence index. If the nine indicators are di-vided into three types of risk dimensions: liquidity risk, market risk and credit risk, six core indicators can be selected from nine indicators as well, and it can be used as DEA model of input and output index system for further study. The meaning of the indicator is shown in Table 5 below.
Table 4. Correlation coefficient matrix.
x1 x2 x3 x4 x5 x6 x7 x8 x9
x1 1 −0.1609 0.2351 −0.1438 −0.0837 −0.2089 0.2000 −0.1224 0.0629
x2 −0.1609 1 −0.0193 0.2160 0.0867 0.0776 −0.2121 −0.1167 0.0865
x3 0.2351 −0.0193 1 0.4612 0.3864 −0.2037 0.4316 −0.4515 0.0740
x4 −0.1438 0.2160 0.4612 1 0.8089 −0.4661 0.2340 −0.2368 0.1988
x5 −0.0837 0.0867 0.3864 0.8089 1 −0.6371 0.4147 −0.0738 0.2028
x6 −0.2089 0.0776 −0.2037 −0.4661 −0.6371 1 −0.5064 0.0274 0.0122
x7 0.2000 −0.2121 0.4316 0.2340 0.4147 −0.5064 1 −0.2518 −0.1001
x8 −0.1224 −0.1167 −0.4515 −0.2368 −0.0738 0.0274 −0.2518 1 0.0496
x9 0.0629 0.0865 0.0740 0.1988 0.2028 0.0122 −0.1001 0.0496 1
Figure 1. Indicator cluster tree.
Table 5. Internet financial risk assessment core index systems.
The nature of
the indicator The name of the indicator The meaning and function of the indicator
Input indicators
Registered capital (ten thousand yuan)
It cannot only be used to characterize the fixed cost of platform operation, but also can form the own assets of P2P platform as the capital investment of registered capital, which is the guarantee and foundation of its responsibility and risk liability.
Average expected rate of return (%)
Accustomed to characterize the variable costs of platform operations. Nowadays, the net loan industry is becoming ever more standardized, and the operating cost is gradually increasing. High net profit is often a large investment trap. Therefore, reasonable expected return of investors through the P2P platform reflects the platform operation to a certain extent the robustness and the effectiveness of risk control.
Output indicators
Leverage index It is used to characterize the level of platform risk tolerance indicators, the higher the leverage index, indicating that the platform may be the smaller leveraged funds, the higher the risk tolerance.
Dispersion index It is used to characterize platform loans and investment funds scattered indicators, the higher the index of dispersion, indicating that the platform investment and the more dispersed the borrower, the lower the risk of platform operations.
Liquidity index Used to characterize the length of the investment funds recovery time on the platform
Transparency index Indicators for characterizing the transparency of platform information, the higher the transparency index, the more information on the platform information is revealed and the platform is more transparent.
[image:12.595.57.540.438.717.2]4.2. The Classical DEA-CCR Model Solution
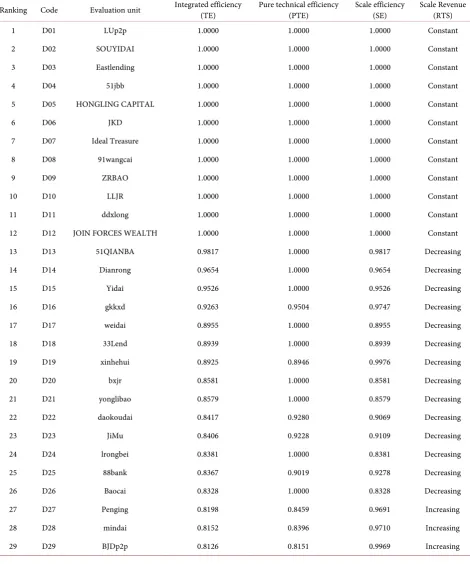
4.2.1. Calculation of Efficiency Values [image:13.595.64.535.180.745.2]Three efficiency values (comprehensive, pure technology, scale) and scale in-come of each P2P network loan company are obtained by the classical DEA- CCR model. The calculation results are shown in Table 6:
Table 6. P2P network loan companies is three efficiency values and scale income calculation.
Continued
Continued
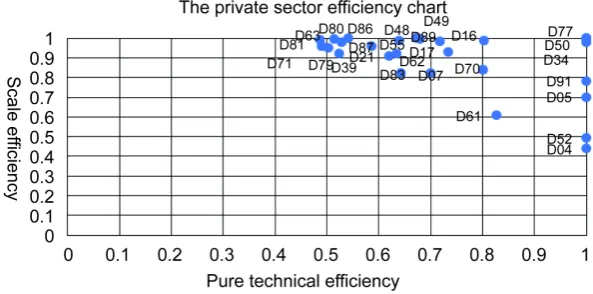
All the network loan platforms Table 6 are divided into five departments ac-cording to the department, which is divided into five parts: the private sector, the banking sector, the state-owned sector, the listed company sector and the venture capital sector. According to their pure technical efficiency and scale effi-ciency values, making the following Figures 2-5 of which only two network loan platforms (LUp2p, LLJR) below the banking department, so this is not particu-larly listed.
[image:16.595.223.521.376.530.2] [image:16.595.231.522.576.713.2]Figure 2. Private sector in an efficient spectrum distribution chart.
Figure 3. State-owned sector in an efficient spectrum distribution chart.
4.2.2. Rating Classification
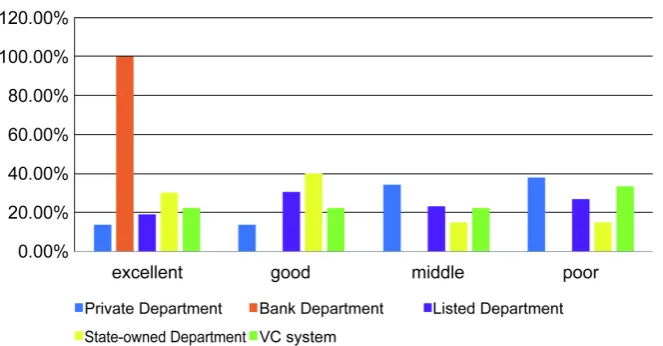
Depending on the comprehensive efficiency values in Table 5, the efficiency of the amplitude “A = the maximum value of efficiency - the minimum value of ef-ficiency”, and A = 0.5976. The step size of the classification is “d = A/n”, ac-cording to this step, the network loan platform can be divided into n categories, for the time being referred to in this article 95 network loan platform is divided into four grades, respectively excellent, good, medium and poor, so get the boundaries of the various types were 0.5518, 0.7012, 0.8506. The percentage of frequency distribution as showed in Figure 6, the rating classification frequency distribution is generated as showed in Table 7.
4.2.3. Result Analysis
From the comprehensive level, the efficiency of the bank loan platform is the highest. The efficiency level of the venture capital sector and the state-owned capital sector is higher than that of the private sector and the listing sector.
[image:17.595.211.536.343.497.2]From the above figures can be seen, the private sector network loan platform comprehensive efficiency is not high, 13.79% at an excellent level, 13.79% at a
Figure 5. Venture capital sector in an efficient spectrum distribution chart.
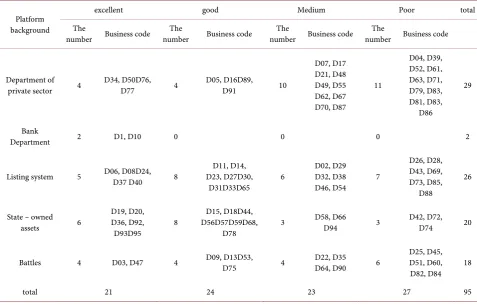
[image:17.595.210.542.543.716.2]Table 7. Rating classification frequency.
Platform background
excellent good Medium Poor total The
number Business code number The Business code number Business code The number Business code The
Department of
private sector 4 D34, D50D76, D77 4 D05, D16D89, D91 10
D07, D17 D21, D48 D49, D55 D62, D67 D70, D87
11
D04, D39, D52, D61, D63, D71, D79, D83, D81, D83,
D86
29
Bank
Department 2 D1, D10 0 0 0 2
Listing system 5 D06, D08D24, D37 D40 8 D23, D27D30, D11, D14, D31D33D65 6
D02, D29 D32, D38
D46, D54 7
D26, D28, D43, D69, D73, D85,
D88
26
State – owned assets 6
D19, D20, D36, D92,
D93D95 8
D15, D18D44, D56D57D59D68,
D78 3
D58, D66
D94 3 D42, D72, D74 20
Battles 4 D03, D47 4 D09, D13D53, D75 4 D22, D35 D64, D90 6 D25, D45, D51, D60, D82, D84 18
total 21 24 23 27 95
good level, 34.48% at the middle level, 37.93% at the poor level; The banking sector has only two network loan platforms, all at the level of excellent. The listed company sector 19.23% at the excellent, 30.77% at the good, 23.08% at the middle, 26.92% at the poor level; the state-owned network loan platform 30% at the excellent level, 40% at the good level, 15% at the middle level, 15% at the poor level; venture capital loan platform, the excellent, the good, the medium respectively 22.22%, while the poor level in 33.33%.
4.3. New DEA - Generalized DEA Model
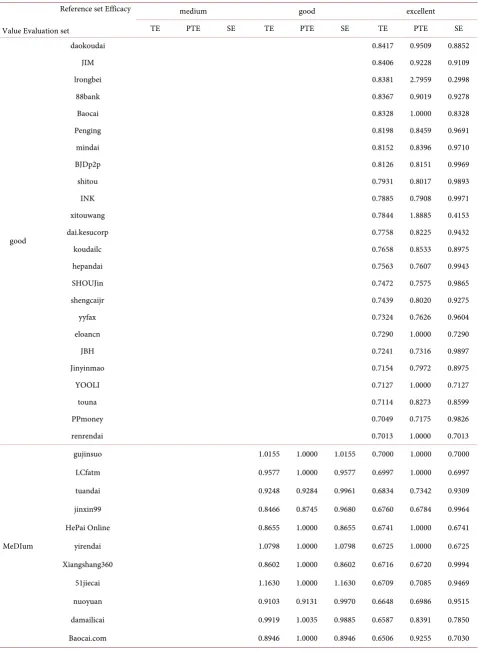
Calculation of “Catch-up Efficiency” Based on Generalized DEA Model Classical DEA method of reference system is an effective decision-making unit, but in fact people need to compare the object is not limited to the outstanding unit, it may be the general unit. Therefore, we use the generalized DEA method to calculate the “catch-up efficiency” value by using the excellent, good and me-dium network loan platforms as the reference set and the poor network loan platforms as the evaluation set, as showed in Table 8.
4.4. Based on the “Catch-up Efficiency” of the “Projection
Analysis”
Projection Analysis Results
Table 8. Good, medium and poor network loan platforms up to the level of “catch up efficiency” of the calculation results.
Reference set Efficacy Value Evaluation set
medium good excellent TE PTE SE TE PTE SE TE PTE SE
good
daokoudai 0.8417 0.9509 0.8852 JIM 0.8406 0.9228 0.9109 lrongbei 0.8381 2.7959 0.2998 88bank 0.8367 0.9019 0.9278 Baocai 0.8328 1.0000 0.8328 Penging 0.8198 0.8459 0.9691 mindai 0.8152 0.8396 0.9710 BJDp2p 0.8126 0.8151 0.9969 shitou 0.7931 0.8017 0.9893 INK 0.7885 0.7908 0.9971 xitouwang 0.7844 1.8885 0.4153 dai.kesucorp 0.7758 0.8225 0.9432 koudailc 0.7658 0.8533 0.8975 hepandai 0.7563 0.7607 0.9943 SHOUJin 0.7472 0.7575 0.9865 shengcaijr 0.7439 0.8020 0.9275 yyfax 0.7324 0.7626 0.9604 eloancn 0.7290 1.0000 0.7290 JBH 0.7241 0.7316 0.9897 Jinyinmao 0.7154 0.7972 0.8975 YOOLI 0.7127 1.0000 0.7127 touna 0.7114 0.8273 0.8599 PPmoney 0.7049 0.7175 0.9826 renrendai 0.7013 1.0000 0.7013
MeDIum
Continued
MeDIum
JINLIANCHU 0.8019 0.8122 0.9873 0.6307 0.6381 0.9884 ZHUBAODAI 0.8573 1.0000 0.8573 0.6254 0.6624 0.9441 RRJC 0.9073 0.9349 0.9704 0.6125 0.6814 0.8988 ycd360 0.8109 0.8456 0.9590 0.5884 0.5986 0.9829 migang 0.7952 0.8774 0.9064 0.5882 0.6547 0.8984 NEW Union Online 0.8495 1.0000 0.8495 0.5844 0.7957 0.7345 duanrong 0.9673 1.2487 0.7747 0.5829 0.6022 0.9679 IQIANJIN 0.7547 1.0000 0.7547 0.5774 1.0000 0.5774 KDW 0.7236 1.0000 0.7236 0.5656 1.2271 0.4609 niwodai 0.7399 0.7732 0.9570 0.5638 0.6196 0.9099 HYJF 0.9234 0.9252 0.9980 0.5608 0.5856 0.9576 Licaifan 0.7572 0.7833 0.9666 0.5604 0.5665 0.9892
poor
HELLOAN 1.0924 1.0929 0.9995 0.9299 1.0000 0.9299 0.5412 0.5413 0.9999 GUANG XIN DAI 0.8306 0.8477 0.9799 0.7346 0.7485 0.9815 0.5379 0.5508 0.9767 gzdai 0.8670 0.8969 0.9667 0.7308 0.7737 0.9445 0.5374 0.5713 0.9406 frbao 0.8460 0.9060 0.9338 0.7148 0.7419 0.9635 0.5365 0.5701 0.9411 NONOBANK 0.8080 0.8207 0.9846 0.7013 0.7041 0.9960 0.5346 0.5519 0.9687 myerong 0.8360 0.8440 0.9906 0.7759 0.7899 0.9823 0.5318 0.5319 0.9999 darenloan 2.2826 2.2841 0.9993 0.8646 1.5044 0.5747 0.5278 0.9621 0.5486 leadercf 0.8109 1.0000 0.8109 0.6864 1.0000 0.6864 0.5273 0.5290 0.9968 jiurong 1.3410 1.3435 0.9981 0.8038 0.8055 0.9979 0.5265 0.5289 0.9954 51tuodao 0.9220 1.0000 0.9220 0.8325 1.1028 0.7549 0.5193 0.6920 0.7504 yuanbao365 0.7949 0.8637 0.9203 0.7198 0.7349 0.9795 0.5162 0.5274 0.9788 xyb100 0.8071 0.8291 0.9735 0.7492 0.7530 0.9950 0.5122 0.5364 0.9549 United Financial 0.7941 1.0000 0.7941 0.6562 1.0000 0.6562 0.5111 0.5129 0.9964 uf-club 0.8373 0.8382 0.9989 0.8479 1.2860 0.6593 0.5088 0.5815 0.8749 wsloan 0.8067 0.8540 0.9446 0.7608 0.7894 0.9638 0.5048 0.5375 0.9393 liyedai 1.7481 1.7528 0.9973 0.8695 4.6464 0.1871 0.5035 1.6529 0.3046 P2phx 1.0863 1.0000 1.0863 0.7427 1.0000 0.7427 0.4946 1.0000 0.4946 hexindai 0.7553 0.7618 0.9913 0.6821 0.6825 0.9995 0.4832 0.5251 0.9202 eweidai 1.1348 1.0000 1.1348 1.0241 1.0000 1.0241 0.4816 0.4858 0.9913 Honhe 0.7792 0.7949 0.9803 0.8504 1.4839 0.5731 0.4788 0.5091 0.9405 CreditFinance 0.7267 0.7335 0.9907 0.6123 0.6199 0.9878 0.4747 0.4750 0.9992 RJS 1.1726 1.1756 0.9974 0.6940 0.6989 0.9930 0.4698 0.4897 0.9594 wanglibao 0.7220 0.8699 0.8299 0.6429 0.7293 0.8816 0.4679 0.5251 0.8910 goodsure 0.7553 0.7560 0.9990 0.7794 1.1694 0.6665 0.4669 0.8201 0.5693 ppdai 0.6816 1.0000 0.6816 0.6186 1.0000 0.6186 0.4401 1.0000 0.4401 YINHU 0.6876 0.7494 0.9176 0.5922 0.6346 0.9333 0.4368 0.4570 0.9558 WYJR168 0.6156 0.6956 0.8851 0.5747 0.6165 0.9322 0.4024 0.4329 0.9296
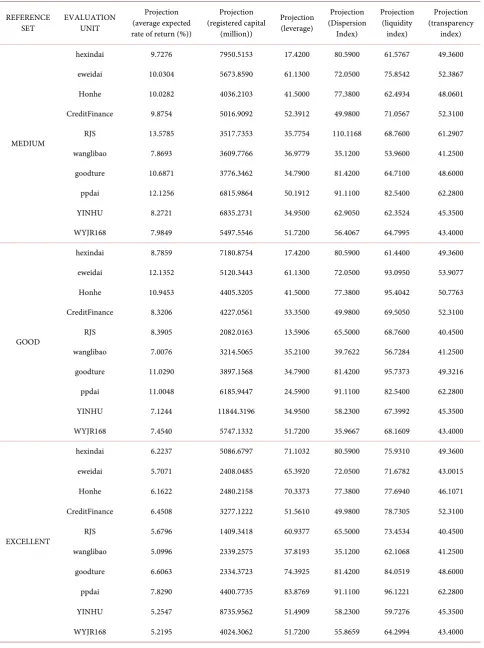
Table 9. The evaluation value of the hybrid evaluation unit on the effective frontier of the excellent reference set.
REFERENCE
SET EVALUATION UNIT
Projection (average expected rate of return (%))
Projection (registered capital
(million))
Projection (leverage)
Projection (Dispersion
Index)
Projection (liquidity
index)
Projection (transparency
index)
MEDIUM
hexindai 9.7276 7950.5153 17.4200 80.5900 61.5767 49.3600 eweidai 10.0304 5673.8590 61.1300 72.0500 75.8542 52.3867 Honhe 10.0282 4036.2103 41.5000 77.3800 62.4934 48.0601 CreditFinance 9.8754 5016.9092 52.3912 49.9800 71.0567 52.3100 RJS 13.5785 3517.7353 35.7754 110.1168 68.7600 61.2907 wanglibao 7.8693 3609.7766 36.9779 35.1200 53.9600 41.2500 goodture 10.6871 3776.3462 34.7900 81.4200 64.7100 48.6000 ppdai 12.1256 6815.9864 50.1912 91.1100 82.5400 62.2800 YINHU 8.2721 6835.2731 34.9500 62.9050 62.3524 45.3500 WYJR168 7.9849 5497.5546 51.7200 56.4067 64.7995 43.4000
GOOD
hexindai 8.7859 7180.8754 17.4200 80.5900 61.4400 49.3600 eweidai 12.1352 5120.3443 61.1300 72.0500 93.0950 53.9077 Honhe 10.9453 4405.3205 41.5000 77.3800 95.4042 50.7763 CreditFinance 8.3206 4227.0561 33.3500 49.9800 69.5050 52.3100 RJS 8.3905 2082.0163 13.5906 65.5000 68.7600 40.4500 wanglibao 7.0076 3214.5065 35.2100 39.7622 56.7284 41.2500 goodture 11.0290 3897.1568 34.7900 81.4200 95.7373 49.3216 ppdai 11.0048 6185.9447 24.5900 91.1100 82.5400 62.2800 YINHU 7.1244 11844.3196 34.9500 58.2300 67.3992 45.3500 WYJR168 7.4540 5747.1332 51.7200 35.9667 68.1609 43.4000
EXCELLENT
projection value and the improved value are discussed by using the medium, good and excellent P2P network loan platforms clusters as reference sets respec-tively.
[image:22.595.55.539.216.737.2]4.5. The Optimal Catch-up Strategy Based on “Projection Analysis”
From the Table 10 available, the poor focus on the top ten behind the P2P net-work loan platforms are as follows: hexindai, eweidai, Honhe Credit Finance,Table 10. Evaluation of the disadvantages of the site of the advantages of reference set for upgrade value.
Reference set Evaluation unit (average expected Movement return (%))
Movement (registered capital)
Movement Index
Movement (Dispersion Index)
Movement (liquidity
index)
Movement (Transparency
Index)
MEDIUM
hexindai −3.1524 −2576.4847 0.0000 0.0000 0.1367 0.0000 eweidai -- -- 0.0000 0.0000 35.1042 14.9267
Honhe −2.8418 −1143.7897 0.0000 0.0000 6.1034 5.0501 CreditFinance −3.7146 −1887.0908 19.0412 0.0000 5.8967 0.0000 RJS -- -- 24.7954 44.6168 0.0000 20.8407 wanglibao −3.0307 −1390.2234 1.7679 0.0000 0.0000 0.0000
goodture −3.4629 −1223.6538 0.0000 0.0000 0.0000 0.0000 ppdai −5.6644 −3184.0136 25.6012 0.0000 0.0000 0.0000 YINHU −3.7579 −6247.5543 0.0000 4.6750 8.0324 0.0000 WYJR168 −4.9851 −3843.5256 0.0000 21.0267 16.1895 0.0000
GOOD
hexindai −4.0941 −3346.1246 0.0000 0.0000 0.0000 0.0000 eweidai -- -- 0.0000 0.0000 52.3450 16.4477
Honhe −1.9247 −774.6795 0.0000 0.0000 39.0142 7.7663 CreditFinance −5.2694 −2676.9439 0.0000 0.0000 4.3450 0.0000 RJS −3.6995 −917.9837 2.6106 0.0000 0.0000 0.0000 wanglibao −3.8924 −1785.4935 0.0000 4.6422 2.7684 0.0000 goodture −3.1210 −1102.8432 0.0000 0.0000 31.0273 0.7216 ppdai −6.7852 −3814.0553 0.0000 0.0000 0.0000 0.0000 YINHU −4.9056 −8155.6804 0.0000 0.0000 13.0792 0.0000 WYJR168 −5.5160 −4252.8668 0.0000 0.5867 19.5509 0.0000
EXCELLENT
RJS, wanglibao, goodture, ppdai, YINHU, WYJR168, and their improvement strategies to the middle, the good, the excellent enterprise clusters as a reference set are as follows:
4.5.1. Take the Excellent Network Loan Platform as a Reference Set hexindai: the average expected rate of return decreased by 6.6563, the registered capital decreased by 54.4032 million yuan. The leverage index increased by 53.6832 and the liquidity index increased by 14.4910.
eweidai: the average expected rate of return decreased by 6.1429, registered capital decreased by 2591.9516 million yuan. The leverage index increased by 4.2620, the liquidity index increased by 30.9282, and the transparency index in-creased by 5.5415.
Honhe: the average expected rate of return decreased by 6.7078, registered capital decreased by 2699.7842 million. The leverage index increased by 28.8373, the liquidity index increased by 21.3040, and the transparency index increased by 3.0971.
CreditFinance: the average expected rate of return decreased by 7.1392, the registered capital decreased by 3626.8778 million yuan. The leverage index in-creased by 18.2110 and the liquidity index inin-creased by 13.5705.
RJS: the average expected rate of return decreased by 6.4104, the registered capital decreased by 1590.6582 million yuan. The leverage index increased by 49.9577 and the liquidity index increased by 4.6934.
wanglibao: the average expected rate of return reduced by 5.8004, the regis-tered capital decreased by 2660.7425 million yuan. The leverage index increased by 2.6093 and the liquidity index increased by 8.1468.
goodture: the average expected rate of return decreased by 7.5437, the regis-tered capital decreased by 2665.6277 million yuan. The leverage index increased by 39.6025 and the liquidity index increased by 19.3419.
ppdai: the average expected rate of return decreased by 9.9610, the registered capital decreased by 55.99226 million yuan, the leverage index increased by 59.2869, the liquidity index increased by 13.5821.
YINHU: the average expected rate of return decreased by 6.7753, the regis-tered capital decreased by 11264.0438 million, the leverage index increased by 16.5409, the liquidity index increased by 5.4076.
WYJR168: the average expected rate of return decreased by 7.7505, the regis-tered capital decreased by 5975.6938 million yuan. The dispersion index in-creased by 20.4859 and the liquidity index inin-creased by 15.6894.
4.5.2. Take the Good Network Loan Platform as a Reference Set
hexindai: the average expected rate of return decreased by 4.0941, the registered capital decreased by 3346.1246 million.
eweidai: credit index increased by 52.3450, transparency index increased by 16.4477.
39.0142, the transparency index increased by 7.7663.
CreditFinance: the average expected rate of return decreased by 5.2694, the registered capital decreased by 3626.8778 million yuan, the liquidity index in-creased by 4.3450.
RJS: the average expected rate of return decreased by 3.6995, the registered capital decreased by 917.9837 million yuan. The leverage index increased by 2.6106.
wanglibao: the average expected rate of return decreased by 3.8924, registered capital decreased by 1785.4935 million. The index of dispersion increased by 4.6422 and the liquidity index increased by 2.7684.
goodture: the average expected rate of return decreased by 3.1210, the regis-tered capital decreased by 1102.8432 million. The liquidity index increased by 31.0273 and the transparency index increased by 0.7216.
ppdai: the average expected rate of return decreased by 6.7852, the registered capital decreased by 381.455 million yuan.
YINHU: the average expected rate of return decreased by 4.9056, the regis-tered capital decreased by 815.58680 million yuan, the liquidity index increased by 13.0792.
WYJR168: the average expected rate of return decreased by 5.5160, the regis-tered capital decreased by 422.5286 million yuan. The dispersion index increased by 0.5867 and the liquidity index increased by 19.5509.
4.5.3. Take the Moderate Network Loan Platform as a Reference Set hexindai: the average expected rate of return decreased by 3.1524, registered capital decreased by 2576.4847 million yuan, the liquidity index increased by 0.1367.
eweidai: credit index increased by 35.1042, the transparency index increased by 14.9267.
Honhe: the average expected rate of return decreased by 2.8418, the registered capital decreased by 114.3788 million yuan, the liquidity index increased by 6.1034, the transparency index increased by 5.0501.
CreditFinance: the average expected rate of return decreased by 3.7146, regis-tered capital decreased by 18.8790 million yuan. The leverage index increased by 19.0412 and the liquidity index increased by 5.8967.
RJS: the leverage index increased by 24.7954, the index of dispersion increased by 44.6168, the transparency index increased by 20.8407.
wanglibao: the average expected rate of return decreased by 3.0307, registered capital decreased by 13.90233 million yuan. The leverage index increased by 1.7679.
goodture: the average expected rate of return decreased by 3.4629, registered capital decreased by 1223.6538 million.
YINHU: the average expected rate of return decreased by 3.7579, registered capital decreased by 6247.5543 million. The index of dispersion increased by 4.6750 and the liquidity index increased by 8.0324.
WYJR168: the average expected rate of return decreased by 4.9851, the regis-tered capital decreased by 3843.5256 million yuan. The dispersion index in-creased by 21.0267 and the liquidity index inin-creased by 16.1895.
4.6. Summary of Improvement Measures
In the improvement strategy of poor network loan platform to excellent, good, medium network loan platform as a reference set respectively, however, the av-erage expected yield and the registered capital should be reduced on the basis of the original amount, the leverage index, the dispersion index, the liquidity index, the transparency index and other indicators on the basis of the corresponding increase in the amount.
5. Countermeasures
The corresponding improvement measures proposed for the poor network loan platform are based on the generalized DEA results, including reduced registered capital, average expected yield and increased leverage index, liquidity index, dis-persion index and transparency index, etc. In view of the connotation of these factors and the network loan platform to improve or reduce the meaning of an index, this paper gives the following recommendations:
5.1. Establish Risk Early Warning Mechanism
Put risk control in the forefront of the development process. Currently, China’s network loan platform itself is more rapid development, but there are still many problems. One of the most serious problems is the high risk of high interest rates on the network loan platform. Therefore, the network loan platform in the con-duct of investment, should take full account of the safety of assets, within the scope of the law of normal business assets, Based on the investor’s own good economic level and risk resistance, to minimize the risk of capital investment. In the development process not only to take the opportunity, but also need to timely resist the risk, the risk control on the first place. While reducing risk while increasing capital liquidity while improving profitability and asset volume.
5.2. Improve Service Levels
5.3. Increase the Proportion of Long-Term Debt
Increase the proportion of long-term liabilities in total assets. Capital leverage is equivalent to the net debt ratio refers to the ratio of long-term debt and share-holders, capital leverage is small, indicating that the debt of the company’s low degree of capitalization, long-term debt pressure is small; On the contrary, this shows that the company’s debt capitalization is high, long-term debt pressure increases. Long-term debt is relatively stable, repayment in the next few fiscal years, so the company will not face a lot of liquidity risk, the debt pressure is small at a shorter period of time. The network loan platform can use long-term debt to raise fixed assets and expand their operations. Therefore, the platform may be appropriate to increase the proportion of long-term liabilities in total as-sets, the use of leverage bi-directional multiplier, to achieve a small investment to get a big return.
5.4. Improve the Transparency of Funds
The network loan platform shall promptly disclose the relevant financial infor-mation to the public. Transparency is an aspect of good funding, but transpa-rency is not an end in itself, it is a means of promoting efficiency, ensuring that regulatory organizations and network loan platforms take responsibility. In-creased transparency of funds includes transparency in the system, transparency of accounting and transparency of indicators. In order to improve the transpa-rency of the network loan platform, the network loan platform shall promptly disclose the financial information to the public, including the detailed descrip-tion and necessary financial matters, including the detailed structure of the net-work loan platform, the functional structure of the netnet-work loan platform, clear the legal basis, and so on. The loan platform should promptly publish the finan-cial analysis of the forecast indicators, including the finanfinan-cial structure and the cyclical balance, the financial sustainability (basic stable debt), the expected re-turn period average period, etc., in order to select the most suitable loan plat-form for investors and borrowers, in order to achieve short-term, medium and long-term funds transparent.
6. Conclusion
Eas-tlending, 51jbb and HONGLING CAPITAL. Secondly, according to the defini-tion of the step size, what will be studied by the 95 network loan platform is di-vided into excellent, good, medium and poor four grades, of which there are 21 excellent platforms and twenty-two good platforms; there are twenty-one me-dium platforms and the rest is poor. Finally, the excellent, good, and meme-dium network loan platforms as a reference set, the last ten poor network loan plat-forms as an evaluation set, figure out the relative efficiency of the last ten poor loan platforms by using the generalized DEA. According to DEA projection, analysis of the worst ten network loan platform improvements for the poor net-work loan platform reforms direction and path to provide the best strategy, such as reducing average expected yield and registered capital, increased leverage in-dex, liquidity index and so on.
Acknowledgements
This research was carried out with support of National Natural Science Founda-tion of People’s Republic of China (project 71661025 and 11602115).
References
Afsharian, M., Ahn, H., & Neumann, L. (2016). Generalized DEA: An Approach for Supporting Input/Output Factor Determination in DEA. Benchmarking: An Interna-tional Journal, 23, 1892-1909. https://doi.org/10.1108/BIJ-07-2015-0074
Charnes, A., Cooper, W. W., & Rhodes, E. (1978). Measuring the Efficiency of Decision Making Units. EuropeanJournalofOperationalResearch, 2, 429-444.
https://doi.org/10.1016/0377-2217(78)90138-8
Jain, A. K., & Dubes, R. C. (1988). Algorithms for Clustering Data. Upper Saddle River, NJ: Prentice-Hall, Inc. http://dl.acm.org/citation.cfm?id=SERIES10022.42779
Lin, X. D. (2015). Research on Credit Risk Measurement of Loan Platform in P2P Net-work Loan in China. Thesis, Guangzhou: South China University of Technology. Liu, C. Y., & Lv. X. M. (2016). Research on “Catching Efficiency” of Urban Commercial
Banks Based on Generalized DEA. Report of Inner Mongolia Finance Society, 2016, 11. Lv, X. M. (2016). Research on Evaluation of Innovation Ability of A-Share Listed Banks
under the Impact of Internet Finance—Based on Panel Data Generalized DEA Model.
JournalofAccountingandEconomic,30, 96-114.
Ma, Z. X. (2012a). DEA Model with Generalized Reference Set and Its Properties. Systems EngineeringandElectronics,34, 709-714.
Ma, Z. X. (2012b). Generalized Data Envelopment Analysis. Beijing: Science Press.
Ma, Z. X., & Lv, X. M. (2007). Research on Sample Data Envelopment Analysis Method of Preference Cone. Journal of Systems Engineering and Electronics,29, 1275-1282. Ma, Z. X., & Zhao, C. Y. (2016). Measure Method for Efficiency of Generalized DEA.
Journal of Systems Engineering and Electronics,38, 2572-2585.
Ouyang, Z. S., & Mo, T. H. (2016). Research on Internet Financial Risk Measurement and Evaluation. Journal ofHunan Universityof Science andTechnology (Social Science Edition),19, 173-178.
Si, S. K., & Sun, X. J. (2011). Mathematical Modeling Algorithm and Application. Beijing: Defense Industry Press.
Wang, L. Y., & Shi, Y. (2016). Research on Internet Financial Risk Mechanism and Risk Measurement—Taking P2P Network Loan as an Example. JournalofSoutheast Uni-versity(PhilosophyandSocialSciences), 18, 103-112.
Zhang, T., Ramakrishnan, R., & Livny, M (1996). BIRCH: An Efficient Data Clustering Method for Very Large Databases. ACMSIGMODRecord, 25, 103-114.
https://doi.org/10.1145/235968.233324
Submit or recommend next manuscript to SCIRP and we will provide best service for you:
Accepting pre-submission inquiries through Email, Facebook, LinkedIn, Twitter, etc. A wide selection of journals (inclusive of 9 subjects, more than 200 journals)
Providing 24-hour high-quality service User-friendly online submission system Fair and swift peer-review system
Efficient typesetting and proofreading procedure
Display of the result of downloads and visits, as well as the number of cited articles Maximum dissemination of your research work