GPS Workstation—A Static Point Averaging and Tracks
Mapping Application
Khalid Amin Khan1*, Gulraiz Akhter2
1
K-tron Research Inc., Rawalpindi, Pakistan; 2Department of Earth Sciences, Quaid-i-Azam University, Islamabad, Pakistan. Email: *[email protected]
Received December 16th, 2012; revised January 16th, 2013; accepted January 25th, 2013
ABSTRACT
This paper describes GPS Workstation, a general purpose navigation software which requires a low-cost GPS connected to the computer. It provides an integrated display of positioning data along with satellite positions, their signal strengths and data quality parameters. The software can be used for static point averaging of GPS data to get more precise posi- tioning and real-time mapping of roads and tracks. It supports output of data in keyhole markup language (KML) as well as other formats for visualization of acquired data on Google Earth and geographic information systems. It can also be used to determine geo-referencing errors in Google Earth imagery for an area and can compensate the error by ap- plying a constant X, Y shift. The software is available for distribution under the free software license.
Keywords: GPS; Real-Time Mapping; Google Earth; Data Averaging
1. Introduction
Global Positioning System (GPS) technology, once lim- ited to military and geoscientific applications, has now become the most common positioning and mapping tool. Due to the advancements in technology and large scale manufacturing, this extremely sophisticated tool has be- come relatively affordable and much easier to use. It is commonly available as hand held units, GPS-equipped Smartphones and vehicle navigation systems. These de- vices have limited system resources and therefore cannot be used for advanced applications. However, several types of small, low-cost GPS units are also available that can be connected to laptops and PC-tablets to run sophis- ticated applications.
The reliability and accuracy of low-cost consumer- grade GPS [1] has improved due to the demise of selec- tive availability [2] and implementation of Wide Area Augmentation System (WAAS) [3] as a Differential GPS service. Survey and mapping-grade GPS provide options for setting quality control standards such as minimum satellite reception (signal-to-noise ratio) and position dilution of precision (PDOP) [4] level necessary for reli- able position coordinates. In addition, these units also allow averaging of multiple coordinate readings for a position which gives a more statistically reliable location estimate than a single reading. On the other hand, most consumer-grade GPS do not have these capabilities and
therefore provide less positioning accuracy.
This paper presents a software application “GPS Work- station” that can be used with computer connected con- sumer-grade GPS units. It provides quality control and averaging functionality to get more accurate positioning and mapping capabilities. The software is built over a reusable ActiveX GPS component [5] which communi- cates with the GPS and receives data through the NMEA 0183 serial interface [6] and sends various segments of the data to the software through arguments of event pro- cedures. The software has an integrated interface which displays raw and processed positioning data along with their graphical plots. It also displays satellite information and data quality parameters. The acquired data can be exported to Google Earth and geographic information systems (GIS) for visualization and map generation. The software is freely available from the corresponding au- thor.
2. Software Design and Functionality
The software functions are classified into three categories: data input from GPS NMEA stream; raw data filtering, processing & display; and data export to geobrowsers [7, 8] and geographic information systems [9]. These func- tions are briefly discussed below.
2.1. NMEA 0183 Data and GPS ActiveX Component
The NMEA 0183 interfaced consists of standard
tences for each type of data. The GPS ActiveX compo- nent parses each sentence to extract the associated data and validates it through checksum. The data for various types of sentences are finally sent through specialized event procedures. In this way the data sent by the com- ponent includes: satellite positions in horizon coordinates, their signal to noise ratio, horizontal, vertical and posi- tion dilution of precision, geographic coordinates and elevation of the location as well as speed and time (UTC). The default coordinates system of GPS is the World Geodetic System 1984 (WGS-84) [10]. The GPS com-ponent also computes the projected grid coordinates in Universal Transverse Mercator (UTM) projection [11] and sends them in addition to the geographic coordinates. The component automatically identifies the UTM zone from the location longitude and sends it along with the UTM coordinates.
2.2. Quality Control, Processing and Display
The software application receives varies types of data
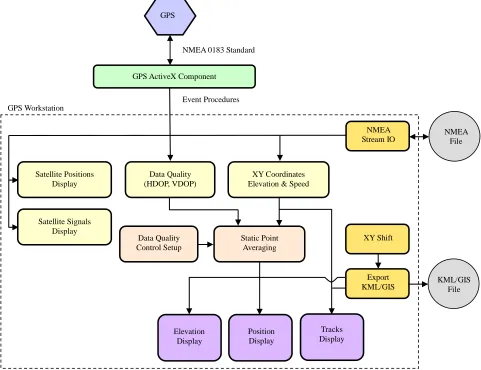
sent by the GPS component and displays it numerically as well as graphically on an integrated interface. Figure 1 shows the complete functional diagram of the GPS Workstation software application. The data directly dis- played by the application includes; polar plot of satellite positions on the user’s horizon, satellite strengths, graphs of satellites in view, satellites in use, horizontal dilution of precision (HDOP), vertical dilution of precision (VDOP), raw coordinates and speed. The raw coordi- nates are used to compute the mean and least squares averages [12] of position and elevation coordinates along with their standard deviation. These raw and averaged data points are displayed on the elevation and position maps. The averaging takes into account the data quality levels set by the user. All data samples that have a DOP value exceeding the user specified level are not included into the averaging process and are marked red on the map. The software also has a track mapping mode in which the raw coordinates are directly displayed on the map to show the track path along with speed and other
GPS
NMEA 0183 Standard
GPS ActiveX Component
Event Procedures Satellite Positions Display Satellite Signals Display Data Quality (HDOP, VDOP) XY Coordinates Elevation & Speed
[image:2.595.57.538.349.719.2]Data Quality Control Setup NMEA Stream IO Position Display Elevation Display Tracks Display Export KML/GIS XY Shift NMEA File KML/GIS File GPS Workstation Static Point Averaging
parameters. In addition to the graphical displays, the raw and averaged coordinates are also displayed numerically in the form of geographic longitude-latitude and UTM grid coordinates.
2.3. Data IO and Export
The NMEA 0183 data from the GPS can be saved into a file which can later be loaded, processed and displayed similar to the direct NMEA stream from the GPS. The software can also export the raw and processed coordi- nates data, for static point as well as tracks, in Keyhole Markup Language (KML) [13,14] for visualization on Google Earth and other geobrowsers [15]. In addition the same data can also be saved in the Integrated Geo Sys- tems [16] GIS format and then exported to a number of formats using format conversion filters written in Output Input Language [17].
3. Practical Applications
The main applications of this software are static point averaging for accurate position determination, real-time roads and tracks mapping and posting these datasets to Google Earth or GIS for visualization. These applications are discussed in the following sub-sections.
3.1. Static Point Averaging
The accuracy of data collected by low-cost GPS units can be quite variable which can be improved significantly by
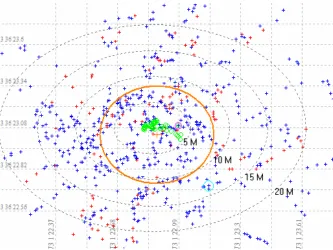
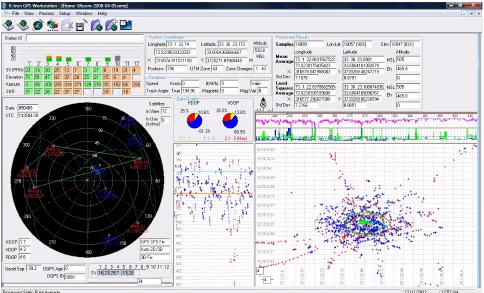
taking the average of multiple data samples acquired at a single location [18]. The software allows setup of HDOP and VDOP values for quality control. Higher DOP values indicate satellite geometric arrangement with reduced reliability of positioning data. The threshold values for both HDOP and VDOP are set to 3. Thus if any of these values are greater than 3 their related data XY coordi-nates or elevation are filtered from the averaging process. Data with DOP values less than 3 is further grouped into three categories; high quality (0.1 - 1.0 DOP), medium quality (1.1 - 2.0 DOP) and low quality (2.1 - 3.0 DOP). Statistics of averaged data quality within the three ranges is also computed and displayed along with graphs of HDOP, VDOP and satellites in use. Figure 2 shows av- eraging of data coordinates acquired at a single location for two hours, with one sample per second. It can be seen in this figure that the raw data samples are scattered within a radius of more than 25 meters while the aver-aged samples lie within a radius of only 5 meters. In this way, the averaging increases the positional accuracy and precision. The same procedure is also applied to the ele- vation data. Figure 3 shows the complete interface for static point averaging with satellite information, quality control parameters and averaging plots of XY and eleva-tion data.
3.2. Determination of Google Earth Positional Errors
[image:3.595.133.466.450.700.2]Google Earth (GE) hosts high-resolution imagery for a
Figure 3. Integrated interface for Static Point Averaging with satellites locations plot, their signal strengths, data quality pa-rameters and averaged data plots for XY positions and elevation.
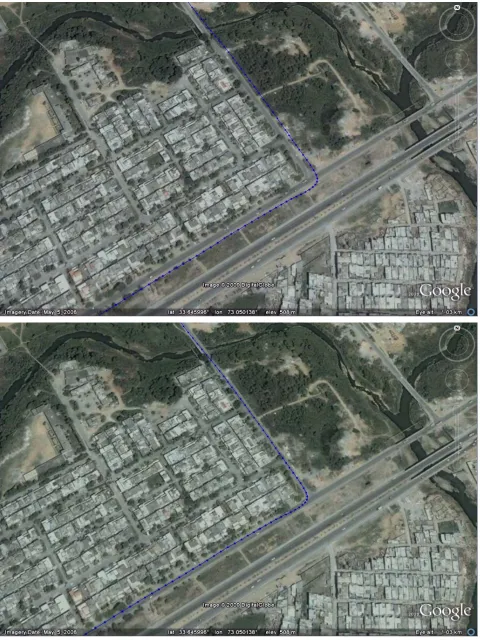
large portion of Earth’s landmass, but its horizontal posi- tional accuracy varies due to different sources of imagery and the geo-referencing used for a location. Errors in image alignment are commonly observed in the form of disjoint linear features [19]. This limits the used of Google Earth for scientific and other applications that require positional precision. The static point averaging can be used to determine the positional error in GE im- agery for a given location, which can then be used to position the data correctly on GE. The averaged data for a known location is exported as a KML file for display on Google Earth (GE). The location of this GPS point can also be easily identified on the high-resolution GE imagery. If the averaged data point does not lie over the visually identified position of GPS on the imagery, then GE has positional errors in imagery of this area. Figure 4
shows the averaged data posted on GE as point A while point B indicates the position of the GPS point identified on the imagery. GPS-Workstation uses the coordinates of both these points and computes the X, Y positional error of imagery. Once this positional error is known, the GE imagery cannot be shifted to the correct position, instead the same amount of X, Y shifts are applied to the data to display it correctly on the imagery. It must be noted that these errors are induced into the data, as X, Y shifts, only for correct visualization on GE while the original data is
maintained separately.
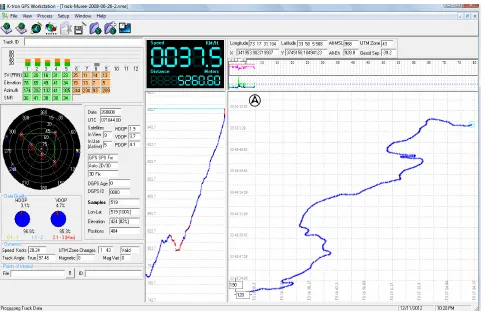
3.3. Tracks Mapping
Figure 4. Static Point Averaging data for a known point posted on Google Earth to determine the positional accuracy of im- agery. Point A indicates the GPS position computed from averaging of data and point B indicates the visual position of the GPS identified on the imagery. The dialog uses the coordinates of these two points to compute the X, Y shifts (positional er- rors in GE imagery).
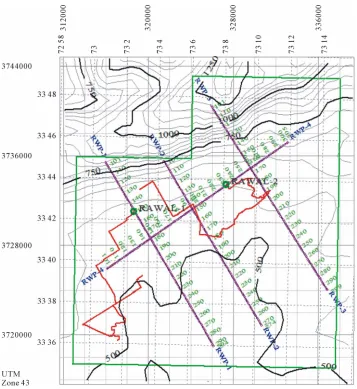
[image:5.595.58.542.409.723.2]Figure 7. Integrated base map with vehicle tracks (red), from the GPS Workstation, posted along with seismic lines (purple lines), wells (green circles), lease concession (green polygon) and topographic contours.
seismic lines, wells, lease concession and topographic contours.
4. Conclusion
A simple, easy to use software is presented that can be used with low-cost GPS units to provide more precise navigation data. Positioning data for static points and tracks can be acquired and posted on GE and other GIS applications. The software can be used for general-pur- pose as well as scientific applications such as accurate mapping in geological field work. It also provides a link between GPS-based navigation data acquisition and GE and GIS mapping applications.
REFERENCES
[1] M. G. Wing, A. Eklund and L. D. Kellogg, “Consumer- Grade Global Positioning System (GPS) Accuracy and Reliability,” Journal of Forestry, Vol. 103, No. 4, 2005,
pp. 169-173.
[2] J. F. Zumberge and G. Gendt, “The Demise of Selective Availability and Implications for the International GPS Service,” Physics and Chemistry of the Earth, Part A:
Solid Earth and Geodesy, Vol. 26, No. 6-8, 2001, pp. 637-644. doi:10.1016/S1464-1895(01)00113-2
[3] R. Loh and J. Fernow, “Integrity Concepts for a GPS Wide-Area Augmentation System (WAAS),” Proceed- ings of the 1994 National Technical Meeting on Navigat- ing the Earth and beyond, San Diego, 24-26 January 1994, pp. 127-135.
[4] R. B. Langley, “Dilution of Precision,” GPS World, Vol. 10, No. 5, 1999, pp. 52-59.
[5] K. A. Khan, G. Akhter and Z. Ahmad, “An ActiveX Con- trol for Embedding GPS Capability in Custom Applica- tions,” GPS Solutions, Vol. 15, No. 4, 2011, pp. 433-439. doi:10.1007/s10291-011-0236-6
[7] T. W. Foresman, “Evolution and Implementation of the Digital Earth Vision, Technology and Society,” Interna- tional Journal of Digital Earth, Vol. 1, No. 1, 2008, pp. 4-16. doi:10.1080/17538940701782502
[8] M. F. Goodchild, “The Use Cases of Digital Earth,” In-ternational Journal of Digital Earth, Vol. 1, No. 1, pp. 31-42. doi:10.1080/17538940701782528
[9] P. A. Longley, M. F. Goodchild, D. J. Maquire and D. W. Rhind, “Geographic Information Systems and Science,” 3rd Edition, John Wiley & Sons, Ltd., Hoboken, 2011, p. 539.
[10] F. J. Lohmar, “World Geodetic System 1984, Geodetic Reference System of GPS Orbits,” Lecture Notes in Earth Sciences, Vol. 19, 1988, pp. 476-486.
doi:10.1007/BFb0011360
[11] J. P. Snyder, “Map Projections—A Working Manual,” US Geological Survey Professional Paper 1395, US Gov- ernment Printing Office, Washington DC, 1987, pp. 38- 75.
[12] A. Bjorck, “Numerical Methods for Least Squares Prob- lems,” Society for Industrial and Applied Mathmatics, Philadelphia, 1996, p. 411.
doi:10.1137/1.9781611971484
[13] T. Wilson, D. Burggraf, R. Lake, S. Patch, B. McClendon, M. Jones, M. Ashbridge, B. Hagemark, J. Wernecke and C. Reed, “KML2.2—An OGC Best Practice,” Open Geo- spatial Consortium, Document OGC07-113r1, 2007, p. 153, Accessed December 2012.
http://portal.opengeospatial.org/files/?artifact_id=23689
[14] T. Wilson, D. Burggraf, R. Lake, S. Patch, R. Martell, B. McClendon, M. Jones, M. Ashbridge, B. Hagemark, J. Wernecke, and C. Reed, “OGCs KML,” Open Geospatial Consortium, Document OGC 07-147r2, 2008, p. 251. http://www.opengeospatial.org/standards/kml [Accessed Dec. 2012].
[15] J. Wernecke, “The KML Handbook: Geographic Visuali- zation for the Web,” Addison-Wesley Professional, Pear- son Education, Inc, Boston, 2009, p. 368.
[16] K. A. Khan, “Integrated Geo Systems—A Computational Environment for Integrated Management, Analysis and Presentation of Petroleum Industry Data,” In: T. C. Coburn and J. M. Yarus, Eds., Geographic Information
Systems in Petroleum Exploration and Development,
AAPG, Tulsa, 2000, pp. 215-226.
[17] K. A. Khan, G. Akhter and Z. Ahmad, “OIL—Output Input Language for Data Connectivity between Geoscien- tific Software Applications,” Computers & Geosciences, Vol. 36, No. 5, 2010, pp. 687-697.
doi:10.1016/j.cageo.2009.09.005
[18] P. August, J. Michaud, C. Labash and C. Smith, “GPS for Environmental Applications: Accuracy and Precision of Locational Data,” Photogrammetric Engineering and Re- mote Sensing, Vol. 60, No. 1, 1994, pp. 41-45.