Mode of delivery and its associated maternal and neonatal
outcomes
*
Aiat Shamsa#, Jun Bai, Padmini Raviraj, Rajanishwar Gyaneshwar Liverpool Hospital, Liverpool,NSW, Australia
Email: #[email protected]
Received 27 February 2013; revised 28 March 2013; accepted 7 April 2013
Copyright © 2013 Aiat Shamsa et al. This is an open access article distributed under the Creative Commons Attribution License,
which permits unrestricted use, distribution, and reproduction in any medium, provided the original work is properly cited.
ABSTRACT
Aim: To determine the association between the mode of delivery and selected neonatal and maternal mor- bidities and outcomes in NSW, during 1998-2008. Methods: This study is a retrospective review of NSW Midwives Data Collection (MDC) of 981,178 deliver- ies during 1998-2008. Maternal condition and neona- tal outcomes were compared for different modes of delivery. Results: The annual rate of caesarean sec- tion has steadily increased from 19% to 31.1% with a mean of 25.9% during the study period. The risk of neonatal death was higher for forceps-assisted deliv- ery compared to vacuum-assisted delivery (adjusted odds ratio 0.85%, 95% CI 0.52 - 1.37), caesarean sec-tion (adjusted odds ratio 1.14%, 95% CI 1.01 - 1.3) and normal vaginal delivery. Operative vaginal de- livery and caesarean section had significantly in- creased risk for maternal mortality compared to nor- mal vaginal delivery. Conclusions: There is an asso-ciation between maternal and neonatal outcome and mode of delivery. Mothers and babies with normal vaginal delivery achieved better outcomes in this community. Caesarean section and operative vaginal delivery are associated with significant maternal and neonatal risk. Breech vaginal delivery carries a sig- nificant neonatal risk. More future prospective ana- lyses, such as multicentre controlled studies, should be designed to determine whether and how much the adverse pregnancy outcomes were caused by unne- cessary surgical and operative vaginal delivery.
Keywords:Obstetric Delivery; Caesarean Section;
Obstetric Extraction; Infant Mortality; Maternal Mortality
1. INTRODUCTION
A frequent dilemma for obstetricians is to determine the best mode of delivery in order to optimize pregnancy outcome for both the mother and the neonate. If all in- dependently significant parameters can be used to con- struct a predictive model, it would be possible to identify the most appropriate mode of delivery. Controversy ex- ists as to whether the increase of intervention such as operative vaginal delivery and caesarean delivery im- prove obstetric outcomes.
There is a concern about the dramatically rising rates of caesarean delivery worldwide [1]. In NSW, between 1998-2008, the caesarean section rate increased while the rate of instrumental delivery remained stable [2,3]. One of the major reasons attributed to the overall increase in caesarean delivery is a reluctance to attempt a vaginal birth after a previous caesarean delivery. However, this is not the only factor because the increase in primary caesarean delivery parallels the total caesarean delivery rate [4].
Unnecessary caesarean sections may be associated with increased maternal and perinatal morbidity [5]. Op- erative vaginal deliveries (forceps and vacuum-assisted delivery) whilst carrying their own attendant risk [6] can often facilitate child birth in the second stage of labour, thus avoiding caesarean section and its associated mor- bidities. Although several authors have reported the rela- tive safety of operative vaginal delivery [7,8], many ob- stetricians have abandoned the use of these interventions. The complications associated with operative vaginal de- livery are dependant on case selection and the level of the experience of the obstetrician [9]. The sequential use of instruments during operative vaginal delivery and dif- ficult instrumental delivery carry an even greater risk for the neonate [10,11]. There are no published randomized clinical trials on which to base a choice between Caesar- ean and operative vaginal delivery in managing compli- cations in second stage of labour [12].
*Please note that current affiliations are different from time of study in
2011.
This current study was undertaken to compare the in- fluence of the mode of delivery on selected neonatal and maternal morbidities and outcomes in NSW over a pe- riod of 1998-2008, during which 981,178 babies were born.
2. METHODS
The New South Wales Midwives Data Collection (MDC) is a population-based surveillance system covering all births in NSW Australia public and private hospitals, as well as home births [2] and is a reliable system of col- lecting clinical information regarding obstetrics per- formance of women and clinical outcomes. A validation study of the MDC by staff of NSW Health Department showed low rates of missing data and generally high lev- els of agreement between MDC data reported to the NSW Health Department and information obtained di- rectly from the medical record. Most data items on the new MDC form were highly reliable [13].
The MCD includes demographic details, and informa- tion of maternal health, pregnancy, labour, delivery and perinatal outcomes. The accuracy of the data is depend- ant on the attending midwife or doctor to complete the standardised notification form when the birth occurs [3]. The period of the data used in this study was between 1998 and 2008. The total number of birth during this period of 11 years was 981,178. The data were analysed using the SPSS package (SPSS Inc., Chicago, IL, USA). Pregnancy and perinatal data from the MDC was used and univariate analysis was done to compare maternal conditions and neonatal outcomes in different modes of delivery, including normal vaginal delivery, forceps- assisted delivery, vacuum-assisted delivery, caesarean section and breech vaginal delivery. Further multiple- variate analyses were conducted on deliveries to compare selected maternal conditions and neonatal outcomes ad- justed for maternal age, parity, maternal hypertension, pregnancy induced hypertension, maternal diabetes and gestational age. All models were checked for effect modifications. Results are presented as odds ratios (ORs) with the associated 95% confidence interval (95% CI). Multiple logistic regression analysis was used to deter- mine the differences in probability of pregnancy outcome and maternal condition variables for different modes of delivery.
This study has been approved by South-western Syd- ney Area Health Service Ethics Committee.
3. RESULTS
Of all 981,178 births during the study period, 62.9% were normal vaginal deliveries, 10.4% were operative vaginal deliveries, including 3.8% and 6.6% for forceps and vacuum-assisted deliveries respectively, and 25.9%
of the births were by caesarean section. There was a 0.7% rate of vaginal breech delivery in the study popula- tion.
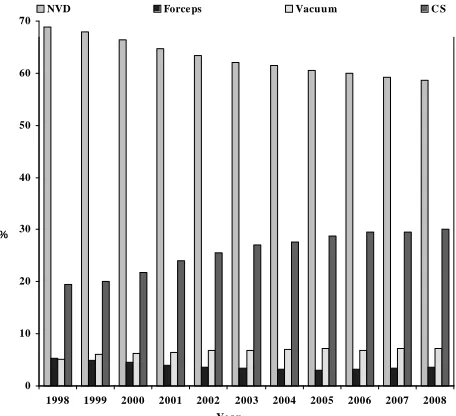
Figure 1 provides information on the trend of modes
[image:2.595.310.538.504.712.2]of delivery in NSW over the study period. It shows that the normal vaginal delivery rate has decreased from 1998 to 2008, whilst the caesarean section rate has increased. The operative vaginal delivery rate has remained con- stant, however the vacuum delivery rate has increased and the forceps delivery rate has decreased.
Table 1 shows maternal characteristics and pregnancy
outcomes comparing different modes of delivery. The rate of caesarean section in women with maternal diabe- tes mellitus, gestational diabetes mellitus, maternal hy- pertension and pre-eclampsia, were 50.5%, 33.9%, 40% and 35.8% respectively. Women who were induced had a 16.7% rate of caesarean section.
Operative vaginal delivery and breech vaginal delivery have a significantly higher risk of having episiotomy performed or having a third or fourth degree perineal tear. The data on post partum haemorrhage was available for 228,463 subjects. The rate of post partum haemorrhage was higher for operative vaginal delivery, 2.8% and 2.5% for forceps and vacuums respectively, compared to normal vaginal delivery; whereas the difference did not appear to be significant for caesarean delivery (Table 1).
The overall maternal mortality ratio was approxima- tely 4.4 per 100,000 live births. The rates were signify- cantly different depending on the mode of delivery. The absolute numbers of maternal deaths during the period was 43. Six were associated with normal vaginal delivery, one with forces-assisted delivery, two with vacuum-as- sisted delivery, 31 with caesarean delivery and 3 were associated with breech vaginal delivery.
0 10 20 30 40 50 60 70
1998 1999 2000 2001 2002 2003 2004 2005 2006 2007 2008
NVD Force ps Vacuum C S
%
Ye ar
F
Table 1. Maternal conditions and neonatal outcomes classified by mode of delivery, 1998-2008.
NVD Forceps-Assisted Delivery Vacuum-Assisted Delivery Caesarean Section Breech Delivery Total *P Value
Maternal Conditions
Maternal Age (Years)
≤20 30,332/616,666 (4.9%) 1355/37,526 (3.6%) 2459/65,049 (3.8%) 5765/253,972 (2.3%) 275/7204 (3.8%) 40,205/980,800 (4.1%)
20 - 35 481,364/616,666 (78.1%) 29,656/37,526 (79.0%) 50,625/65,049 (77.8%) 178,860/253,972 (70.4%) 5369/7204 (74.5%) 746,133/980,800 (76.1%)
≥35 104,970/616,666 (17.0%) 6515/37,526 (17.4%) 11,965/65,049 (18.4%) 69,347/253,972 (27.3%) 1560/7204 (21.7%) 194,462/980,800 (19.8%) <0.001
Primipara 211,771/616,568 (34.3%) 30,650/37,529 (81.7%) 48,281/65,038 (74.2%) 114,287/253,834 (45.0%) 2684/7203 (37.3%) 407,845/980,558 (41.6%) <0.001
Maternal DM 2105/616,926 (0.3%) 188/37,536 (0.5%) 234/65,071 (0.4%) 2628/254,050 (1.0%) 51/7206 (0.7%) 5207/981,178 (0.5%) <0.001
GDM 23,357/616,962 (3.8%) 1531/37,536 (4.1%) 2680/65,071 (4.1%) 14,233/254,050 (5.6%) 215/7206 (3.0)% 42,022/981,178 (4.3%) <0.001
Maternal HTN 4611/616,926 (0.7%) 357/37,536 (1.0%) 596/65,071 (0.9%) 3773/254,050 (1.5%) 84/7602 (1.2%) 9422/981,178 (1.0%) <0.001
Pre-Eclampsia 23,117/482,811 (4.8%) 2561/29,407 (8.7%) 3823/48,717 (7.8%) 16,623/185,050 (9.0%) 311/6011 (5.2%) 46,436/752,093 (6.2%) <0.001
Smoking 109,054/615,515 (17.7%) 3610/37,474 (9.6%) 6692/64,920 (10.3%) 31,941/253,318 (12.6%) 1628/7180 (22.7%) 152,982/978,785 (15.6%) <0.001
Induction 161,620/616,854 (26.2%) 13,316/37,527 (35.5%) 22,466/65,058 (34.5%) 42,519/253,990 (16.7%) 2186/7206 (30.3%) 242,231/981,011 (24.7%) <0.001
Episiotomy 62,494/616,912 (10.1%) 27,097/37,535 (72.2%) 27,674/65,070 (42.5%) 0/254,050 (0%) 1499/7206 (20.8%) 118,842/981,153 (12.1%) <0.001
3rd-4th Degree Perineal Tear
5349/482,658 (1.1%)
1351/29,403 (4.6%)
1660/48,710 (3.4%)
0/185,047 (0%)
27/6010 (0.4%)
8387/751,828
(1.1%) <0.001
Post Partum Haemorrhage Requiring Blood
Transfusion
2098/133,935
(1.6%) 225/8122 (2.8%) 404/16,344 (2.5%) 1212/68,870 (1.8%) 32/1192 (2.7%) 3971/228,463 (1.7%) <0.001
Maternal Death (per 100,000)
6/616,734 (0.97)
1/37,531 (2.66)
2/65,056 (3.07)
3/7199 (12.21)
31/253,967 (41.67)
43/980,487
(4.39) <0.001
Neonatal Outcomes
Birth Weight (Grams)
≤2500 28,354/616,500 (4.6%) 1411/37,517 (3.8%) 1963/65,039 (3.0%) 26,138/253,892 (10.3%) 3867/7132 (54.2%) 61,750/980,462 (6.3%)
2500 - 4000 515,607/616,500 (83.6%) 30,738/37,517 (81.9%) 55,421/65,039 (85.2%) 194,288/253,892 (76.5%) 3189/7132 (44.7%) 799,558/980,462 (81.5%)
≥4000 72,539/616,500 (11.8%) 5368/37,517 (14.3%) 7655/65,039 (11.8%) 33,466/253,892 (13.2%) 76/7132 (1.1%) 119,154/980,462 (12.2%) <0.001
Apgar min 1 < 5 19,614/614,565 (3.2%) 2039/37,524 (5.4%) 3297/65,045 (5.1%) 12,688/253,907 (5.0%) 3115/7153 (43.5%) 40,768/978,569 (4.2%)
Apgar min 5 < 7 10,300/614,846 (1.7%) 863/37,521 (2.3%) 1493/65,040 (2.3%) 5841/253,896 (2.3%) 2454/7155 (34.3%) 20,956/978,834 (2.1%) <0.001
NICU Admission 7853/482,797 (1.6%) 761/29,406 (2.6%) 796/48,712 (1.6%) 10,491/185,030 (5.7%) 806/6011 (13.4%) 20,708/752,051 (2.8%) <0.001
Perinatal Death (per 1000)
3808/482,662 (7.9)
124/29,404 (4.2)
66/48,707 (1.3)
1207/184,961 (6.5)
1680/5999 (280.0)
6885/751,829
(9.1) <0.001
Still Birth 2888/482,811 (0.60%) 81/29,407 (0.27%) 48/48,717 (0.10%) 581/185,050 (0.31%) 1226/6011 (20.40%) 4824/751,996 (0.64%) <0.001
Neonatal Death (per 1000)
920/482,811 (1.9)
43/29,407 (1.5)
18/48,717 (0.37)
626/185,050 (3.4)
454/6011 (75.5)
2061/751,996
(2.74) <0.001
*
The table shows that more than half (54.2%) of the breech deliveries were low birth weight babies. Neonates delivered vaginally for breech presentations had lower Apgar scores, greater admission rates to neonate inten- sive care unit (NICU) and higher neonatal death rates.
Table 2 lists the odds ratio for risks of maternal and
neonatal outcomes. After taking maternal age, parity, smoking, and pre-labour conditions, such as diabetes, hypertension, and bleeding, caesarean section had sig- nificantly increased risk for maternal mortality, com- pared to normal vaginal delivery (adjusted OR 12.65%, 95% CI 5.13 - 31.19). The risk of third and fourth degree perineal injury was highest for forceps-assisted delivery (OR 2.37%, 95% CI 2.22 - 2.52).
Table 2. Risk of maternal mortality and morbidity and neo- natal outcomes† by mode of delivery.
Adjusted OR
Maternal Death
Normal Vaginal Delivery (Reference) 1
Forceps-Assisted Delivery 4.9
Vacuum-Assisted Delivery 6.97
Caesarean Section 12.65
Breech Delivery 1.76
3rd and 4th Degree Perineal Tear
Normal Vaginal Delivery (Reference) 1
Forceps-Assisted Delivery 2.37
Vacuum-Assisted Delivery 1.84
Caesarean Section 0
Breech Delivery 0.78
Admission to NICU
Normal Vaginal Delivery (Reference) 1
Forceps-Assisted Delivery 2.23
Vacuum-Assisted Delivery 1.55
Caesarean Section 2.94
Breech Delivery 0.24
Neonatal Death
Normal Vaginal Delivery (Reference) 1
Forceps-Assisted Delivery 1.84
Vacuum-Assisted Delivery 0.85
Caesarean Section 1.14
Breech Delivery 2.36
OR = odds ratio. CI = Confidential Interval. NICU = Neonate Intensive
Care Unit; †Maternal conditions and neonatal outcomes are adjusted for
maternal age, parity, maternal hypertension, pregnancy induced hyperten- sion, maternal diabetes and gestational age.
Infants born by operative vaginal delivery and Caesar- ean section had increased risk of admission to NICU
compared to normal vaginal delivery as shown in Table
2. After adjusting maternal risk factor and pre-labour
conditions, the risk of neonatal death was higher for for- ceps-assisted delivery (OR 1.84%, 95% CI 1.31 - 2.59) compared to vacuum-assisted delivery (OR 0.85%, 95% CI 0.52 - 1.37), caesarean section (OR 1.14%, 95% CI 1.01 - 1.3) and normal vaginal delivery.
Breech vaginal deliveries carried a neonatal death risk of 2.36%, 95% CI 1.95 - 2.85.
4. DISCUSSION
In this study 981,178 deliveries were reviewed, specifi- cally looking at maternal and neonatal morbidity and mortality. It is observed that during the 11 years period the caesarean section rate has increased from 19% to 30.1% with a mean of 25.9%. Whilst the rate of Caesar- ean section in NSW is increasing [2], it is lower than the recently reported overall rate of caesarean section in WHO global survey in Asia, which was 27.3% [5]. The NSW MDC does not classify caesarean deliveries into elective and emergency caesarean section. The outcomes therefore reflect the overall caesarean section rate. However, the data from the NSW Public Health Bulletin [2,3] from the study period shows that the trend for both elective and emergency caesarean sections, are similarly increasing. Further analysis of this data would be neces- sary to identify which indications are contributing to this trend. Safe reduction in caesarean delivery rates is a prio- rity and several authors have suggested strategies to achieve this [14,15].
This data may confirm the results of a previous study [16], which indicated that there is an association between advanced maternal age and interventions during labour, including caesarean delivery. The authors also noted an association between advanced maternal age and higher rate of maternal medical complications including hyper-
tensive disorder and diabetes,which might explain the
association.
The study shows that vacuum-assisted delivery has a significantly lower risk of third and fourth degree tears compared to forceps-assisted delivery. This confirms findings from previous studies [8,17] which show that vacuum-assisted has lower risk of maternal trauma, however, that forceps has been shown to be less trau- matic for the fetus.
This supports other studies reporting an increased rate of vacuum against forceps application [18,12]. Interestingly, trainee specialists are becoming less familiar with the use of forceps deliveries and are preferentially choosing to perform vacuum-assisted deliveries [19]. There has been a recent publication which reports on the safety of opera- tive vaginal deliveries. The authors also report that pru- dent use of Kjelland’s forceps by experienced operators is associated with a very low maternal and neonatal ad- verse outcome. They go on to say that training is impor- tant, to ensure that the art of forceps delivery is not lost [7]. A leading expert [8] in vacuum assisted deliverycon- tends that unsuccessful vacuum extraction, cup detach- ment and failed anterior rotation in occipito-posterior positions are commonly associated with obstetric factors that are avoidable or correctable.
In this study, there appears to be a strong association between the risk of maternal death and mode of delivery. The numbers are small but there is still statistical sig- nificance. We have been unable to extract enough clini- cal information on the 43 deaths in the study period to come to any conclusions on whether the mode of deli- very contributed to the maternal death. In the last confi- dential enquiry into maternal deaths report for Australia, for the period 2003 to 2005, the maternal mortality ratio was 8.4 per 100,000. Of 29 direct maternal deaths 5 were attributed to thrombosis and thrombo-embolism and 4 to obstetric haemorrhage. Both these conditions have been associated with operative deliveries [20,21].
Caesarean delivery was clearly a significant risk factor of maternal death. It is difficult to comment on the risk of maternal death with operative vaginal delivery be- cause of the wide confidential intervals in the odds ratios. Not surprisingly, operative vaginal delivery carries a significantly higher maternal traumatic morbidity rate. Other authors have also found higher morbidity rates in association with assisted vaginal delivery and caesarean delivery [22]. Caesarean section has been reported to increase the risk of severe acute maternal morbidity (SAMM) [23]. SAMM, also known as “near miss”, is defined as “A very ill pregnant or recently delivered woman who would have died had it not been that luck and good care was on her side”. The morbidity associ- ated with caesarean sections may be a reflection of the maternal condition prior to the procedure being per- formed.
Data for Post partum haemorrhage was incomplete for all subjects in the NSW MDC. Any conclusions therefore need to be interpreted with caution. For 228,463 births that data was available there was a significant association between post partum haemorrhage and operative delivery. Surprisingly, there did not appear to be a difference in the post partum haemorrhage rates between caesarean section and normal vaginal delivery group. The post
partum haemorrhage rates in these two groups were 1.8% and 1.6% respectively.
Caesarean section is associated with a higher rate of admission to NICU but there is no increase in the neona- tal death when the risk is not adjusted for confounding factors (Table 1). After adjusting for confounding fac-
tors, presented in Table 2, neonatal mortality rates be-
come significantly higher for breech vaginal delivery, caesarean section and forceps-assisted delivery compared to vacuum-assisted delivery and normal vaginal delivery. Others have reported similar findings in their study [24]. There could be an argument stating that the already compromised condition of the fetus, leading to operative vaginal delivery and caesarean delivery, can contribute to the higher neonatal adverse outcomes associated with these interventions. The authors of the WHO global sur- vey [5] draw attention to the fact that intrinsic risks as- sociated with operative delivery are difficult to separate from the medical and obstetrical indications leading to the procedures being performed. However, in their study, they noted that women who underwent a caesarean sec- tion without a medical indication had a higher incidence of blood transfusion and admission to the intensive care. Whilst it is difficult to control for the threshold at which these occurred it was clear in their study that those hav- ing a spontaneous vaginal delivery were less likely to have a blood transfusion or be admitted to intensive care.
The association between breech vaginal delivery and neonatal mortality and morbidity has been reported pre- viously [5,25]. The data from the current study confirms the view that the neonate of breech vaginal delivery were at significant risk.
The analysis of the NSW MDC reviewing almost a million deliveries over an 11 years period confirms that there is an association between maternal and neonatal outcome and mode of delivery. The data showed that mothers and babies of normal vaginal delivery had better outcomes. Unnecessary Caesarean section and operative vaginal delivery may carry significant maternal and neonatal risk and therefore should be undertaken only when such deliveries are strictly indicated. Breech vagi- nal delivery is associated a significant neonatal risk. Further randomised and multi-centred research study is required to compare the pregnancy outcomes on different policies of operative intervention.
REFERENCES
[1] Villar, J., Carroli, G. and Zavaleta, N. (2007) Maternal and neonatal individual risks and benefits associated with caesarean delivery: Multicentre prospective study. BMJ,
335, 1025.
babies 2007. NSW Public Health Bulletin, 21.
[3] Centre for Epidemiology and Research. NSW Depart-ment of Health (2002) New South Wales mothers and babies 2002. NSW Public Health Bulletin, 14.
[4] National Institutes of Health (2006) State-of-the-Science Conference Statement on Caesarean Delivery on Mater- nal Request, 23, 27-29.
[5] Lumbiganon, P., Laopaiboon, M., Gülmezoglu, A.M., Souza, J.P., et al. (2010) Method of delivery and pre-
gnancy outcomes in Asia: The WHO global survey on maternal and perinatal health 2007-08. The Lancet, 375,
490-500.
[6] Belfort, M. (2000) Operative vaginal delivery. ACOG Practice Bulletin, 17.
[7] Al-suhel, R., Gill, S., Robson, S. and Shadbolt, B. (2009) Kjelland’s forceps in the new millennium. Maternal and neonatal outcomes of attempted rotational forceps deli- very. Australian and New Zealand Journal of Obstetrics and Gynaecology, 49, 510-514.
[8] Vacca, A. (2002) Vacuum-assisted delivery. Best Prac- tice & Research Clinical Obstetrics & Gynaecology, 16,
17-30.
[9] Ebulue, V., Vadalkar, J., Cely, S., Dopwell, F. and Yoong, W. (2008) Fear of failure: Are we doing too many trials of instrumental delivery in theatre? Acta Obstetricia et Gynecologica Scandinavica, 87, 1234-1238.
[10] Al-Kadri, H., Sabr, Y., Al-Saif, S., Abulaimoun, B., Ba’Aqeel, H. and Saleh, A. (2003) Failed individual and sequential instrumental vaginal delivery: Contributing risk factors and maternal-neonatal complications. Acta Obstetricia et Gynecologica Scandinavica, 82, 642-628.
[11] Mola, G.D., Amoa, A.B. and Edilyong, J. (2002) Factor associated with success or failure in trials if vacuum ex- traction. Australian and New Zealand Journal of Obstet- rics and Gynaecology, 42, 35-39.
[12] Yeomans, E.R. (2010) Operative vaginal delivery. Ob- stetrics & Gynecology, 115, 645-653.
[13] Centre for Epidemiology and Research. NSW Depart- ment of Health (2000) New South Wales mothers and babies 1998. NSW Public Health Bulletin, 1.
[14] Robson, M.S. (2001) Classification of caesarean sections.
Fetal and Maternal Medicine Review, 12, 23-39.
[15] Fischer, A., LaCoursiere, D.Y., Barnard, P., Bloebaum, L. and Varner, M. (2005) Differences between hospitals in
cesarean rates for term primigravidas with cephalic pre- sentation. Obstetrics & Gynecology, 105, 816-821. [16] Dulitzki, M., Soriano, D., Schiff, E., Chetrit, A., Ma-
shiach, S. and Seidman, D.S. (1998) Effect of very ad- vanced maternal age on pregnancy outcome and rate of cesarean delivery. Obstetrics & Gynecology, 92, 935-939.
[17] Bofill, J.A., Rust, O.A., Schorr, S.J., Brown, R.C., Martin, R.W., Martin Jr., J.N. and Morrison, J.C. (1996) A ran- domized prospective trial of the obstetric forceps versus the M-cup vacuum extractor. American Journal of Ob- stetrics & Gynecology, 175, 1325-1330.
[18] Clark, S.L., Belfort, M.A., Hankins, G.D., Meyers, J.A. and Houser, F.M. (2007) Variation in the rates of opera- tive delivery in the United States. American Journal of Obstetrics & Gynecology, 196, e1-e5.
[19] Prapas, N., Kalogiannidis, I., Masoura, S., Diamanti, E., Makedos, A., Drossou, D. and Makedos, G. (2009) Op- erative vaginal delivery in singleton term pregnancies: Short-term maternal and neonatal outcomes. Hippokratia,
13, 41-45.
[20] Rossen, J., Okland, I., Nilsen, O.B. and Eggebø, T.M. (2010) Is there an increase of postpartum hemorrhage, and is severe hemorrhage associated with more frequent use of obstetric interventions? Acta Obstetricia et Gyne- cologica Scandinavica, 89, 1248-1255.
[21] Jacobsen, A.F., Drolsum, A., Klow, N.E., Dahl, G.F., Qvigstad, E. and Sandset, P.M. (2004) Deep vein throm- bosis after elective cesarean section. Thrombosis Re- search, 113, 283-288.
[22] Allen, V.M., O’Connell, C.M. and Baskett, T.F. (2006) Maternal morbidity associated with cesarean delivery without labor compared with induction of labor at term.
Obstetrics & Gynecology, 108, 286-294.
[23] van Dillen, J., Zwart, J.J., Schutte, J., Bloemenkamp, K.W. and van Roosmalen, J. (2010) Severe acute mater- nal morbidity and mode of delivery in the Netherlands.
Acta Obstetricia et Gynecologica Scandinavica, 89, 1460-
1465.
[24] Contag, S.A., Clifton, R.G., Bloom, S.L., et al. (2010)
Neonatal outcomes and operative vaginal delivery versus cesarean delivery. American Journal of Perinatology, 27, 493-499.