Munich Personal RePEc Archive
Impact of import liberalisation on
poverty: a dynamic computable general
equilibrium and microsimulation analysis
for Ghana
Obeng, Camara Kwasi
University of Cape Coast, Ghana
29 August 2014
Online at
https://mpra.ub.uni-muenchen.de/58182/
1
Impact of import liberalisation on poverty: a dynamic computable general equilibrium and
microsimulation analysis for Ghana
BY
CAMARA K. OBENG,
DEPARTMENT OF ECONOMICS, UNIVERSITY OF CAPE COAST,
CAPE COAST, GHANA.
TEL: 00233-3321-35560 (Office) 00233-244-841712 (Mobile)
FAX: 00233-42-37018
E-MAIL: [email protected]
Alternative E-Mail: [email protected]
Abstract
Incidence of poverty for Ghana has reduced from about 52% in 1991/92 to 28.5% in 2005/06. This is a remarkable drop in the incidence of poverty, but the current level is still high. Equally high are the levels of the depth and severity of poverty. This means that any policy pursued by the country must aim at further reducing the incidence, depth and severity of poverty. A number of policies and programmes have been implemented to reduce extreme in Ghana. On such policy, liberalisation of import trade has been implemented extensively in the country even though its long run contribution to poverty reduction is not clear in the trade literature. Therefore, this study examined the long run impact of import liberalization on the incidence, depth and severity of poverty at the national and household levels. The investigation was carried out using a recursive dynamic computable general equilibrium and a microsimulation model calibrated to the 2005 Social Accounting Matrix (SAM) of Ghana. In spite of the strong criticism against import liberalisation as being anti-growth and poverty enhancing, the results showed that the net effect of import liberalisation leads to reduction in the incidence, depth and severity of poverty at the national and household levels in the long run. However, the benefits of import liberalisation accrue more to urban households than rural households. This finding is due to the fact that urban households, generally, are net consumers of imported goods and services than rural households. In addition, the urban areas have the necessary economic infrastructure and so are economically vibrant, thereby offering huge opportunities for people to participate in international trading activities. The study recommends that import liberalisation must continue to be part of the poverty alleviation strategy of government for Ghana Post 2015 and that government focuses poverty alleviation policies more in the rural areas.
Keywords: Import Liberalization, Tariff Revenue, Poverty, Ghana, SAM, CGE.
1.0 Introduction
2
adduced evidence in support of a positive relationship between the two variables, Rodrik, 2000; Rodriguez & Rodrik, 2001; Ravallion, 2001; Lubker, Smith & Weeks, 2002; Wei, 2002; Chen & Ravallion (2004) have evidence in support of adverse effect of import liberalisation on poverty). This is because there is no historical antecedent linking import liberalisation to poverty and more importantly, the theoretical link between them is unclear (Winters, McCulloch, & McKay, 2004). Empirically, however, the channels through which trade liberalisation impact poverty have been identified as price and availability of goods, factor prices, government transfers, incentives for investment and innovation, terms of trade, and short-run risk (Winters, et al (2004) as cited in Bouet, 2006).
In explaining the link between import liberalisation and poverty, the argument has always been made that import liberalisation reduces the prices of consumer goods (Weerahewa, 2004, 2006), raise real incomes, expand the availability of goods and thereby lift many poor households out of poverty. Another channel that has been identified is the employment channel. That is, through import liberalisation local firms import raw materials at lower cost, expand their operations and create employment for more people. The protagonists, on the other hand, argue that import liberalisation destroys local productive activities, increase unemployment and push many households that were above the poverty line, below it. They further argue that import liberalisation deny government revenue from tariffs on imports that could be used to provide services and support the vulnerable in society. Clearly, the effect of import liberalisation on poverty is an empirical issue and must be taken case by case.
Ghana offers an interesting case study because it is one of the fastest liberalizers in Africa (Economic Commission on Africa, 2004). In the late 1960s and earlier 1970s, Ghana operated liberal trade regime. But this was replaced in 1972 with a controlled regime with the government as a major producer. The policies of the period emphasized import substitution, underpinned by a restrictive foreign exchange rate regime, quantitative restrictions upon imports and price controls. Indeed, the country recorded its worst macroeconomic performance during this period (Killick, 2010). Specifically, GDP recorded negative growth rates, there were large budget deficits, and high inflation rate from the early 1970s to the early 1980s (Killick, 2010). The situation got so bad that the government had to embark upon a massive reform of the economy in April 1983.
As part of a comprehensive reform programme supported by the IMF and the World Bank, Ghana liberalised her import trade. The liberalisation took the form of removal of quantitative restrictions on imports and replacing them with tariffs, and the reduction in the level and range of import tariffs. For instance, the simple average tariff rate fell from 32.6 percent for the period 1972-82 to 11.3 percent for the period 1990 -2003. There was also the liberalisation of the exchange rate, financial sector, and the labour market. The reduction in import tariff meant that imports of consumer goods were now cheaper for households. It also meant that firms that relied on import inputs could import raw materials at reduced costs. On the contrary, import liberalisation implied that cheaper imports of consumer goods have come to replace domestically produced goods forcing some local firms to collapse and raise the risk of adjustment and hence create unemployment, and increase poverty among the people.
3
countries. Meanwhile, the composition of the traditional sources of Ghana’s merchandise imports, Nigeria, United Kingdom, USA, Cote d’lvoire, Germany, Switzerland and Togo, remains intact.
The period has also witnessed significant reduction in headcount poverty from about 52 per cent in 1991/92 to 28.5 per cent in 2005/2006. Poverty remains substantially higher in rural areas than urban areas, even though poverty fell by 23% in the rural areas as against 16% in the urban areas for the period under consideration, and is disproportionately concentrated in the rural savannah. Despite the fact that the incidence of poverty has fallen, the depth of poverty for those who remain poor has remained relatively stable. The declines in poverty have been concentrated mostly in Western, Central, Volta, Eastern, Ashanti and Brong Ahafo, Northern, and Upper East regions. Only Accra experienced an increase in poverty. The poverty figure for Upper West region for 2005/06 is 21% higher than the figure for 1991/92 even though it represents a fall of 0.3% from the figure for 1998/99. Large poverty reductions have occurred among public sector workers, private sector employees in both the formal and informal sectors, and non-working households. The decline, however, is not evenly distributed according to ecological zones and regions.
Given that Ghana has adopted poverty alleviation as a kingpin of its development agenda in line with MDG 1, and she is likely to maintain this agenda Post 2015, there is a need to explore explicitly the link between import liberalisation and poverty using appropriate quantitative framework. Thus, the critical question that was answered in this study after considering the above issues is: What is the long run impact of trade liberalisation on poverty in Ghana? Specifically, the study investigated the macroeconomic impact of import liberalisation and the effect of import liberalisation on the incidence, depth and severity of poverty of households in Ghana. Performing one policy experiment, gradual removal of taxes on imports, the objective was achieved. The analysis was carried out for the period 2005 to 2020. The choice of the study period was informed by the availability of a comprehensive household dataset from the Ghana Living Standards Survey (GLSS 5) and the fact that 2020 is about five years post 2015 and more importantly, five years into the coming into being of the Economic Partnership Agreement between Ghana and the EU. Clearly, the study is significant in assessing import liberalisation as a post 2015 development strategy for Ghana. The results show a reduction in the incidence, depth and severity of household poverty when import taxes are gradually removed.
Previous Computable General Equilibrium (CGE) analysis of Ghana’s trade policy reforms have been carried out within the static CGE framework with all pointing to the fact trade liberalisation complemented with other policies alleviates poverty (Bhasin & Annim, 2005; Bhasin & Obeng, 2005a; 2005b; 2006, Bhasin, 2012). The current study is different from all the earlier ones in that while the former studies covered only one period, the current study is dynamic in nature and therefore covers a longer time period. Second, and more importantly, while the earlier studies eliminated all taxes on imports and exports, this study employed a gradual elimination of trade taxes. Finally, sensitivity analysis was carried out in this study while the earlier others lacked sensitivity analysis.
4 2.0 Methodology
A study of the impact of import liberalisation on poverty requires the use of a model that can capture all the complexities involved in the linkage. With this in mind, the Dynamic Computable General Equilibrium and Microsimulation model was employed in this study. The following activities were systematically followed in pursuant of the objectives of the study: the dynamic computer general equilibrium model was run from 2005 to 2020, and the prices, incomes and commodity consumption and factor price changes for an aggregate household was fed into a microsimulation model for the disaggregated households in the survey. Household expenditures were accordingly updated and the standard poverty measures were then recalculated using the updated expenditure estimates and the new poverty line.
Model
The model adopted for this study is a recursive dynamic CGE linked to a micro-simulation model, developed by Breisinger, Diao and Thurlow (2009). It has its origins the static CGE model developed at the International Food Policy Research Institute ( IFPRI) and documented in Lofgren, Harris and Robinson ( 2002). It is solved one period at a time through updating such variables as investment spending and population growth rate to reflect changes that have taken place in the current period. The model represents a small open economy that has no influence on international markets and it is calibrated to the Social Accounting Matrix (SAM) of Ghana for the year 2005. There are three production sectors, three factors of production and nine categories of households. The model is presented in four blocks, including production and prices; institutional incomes and domestic demand equations, equilibrium conditions and macroeconomic closure and factor accumulation and allocation equations.
The poverty effects of the policy simulations were carried out in the microsimulation model. The microsimulation model was constructed using the expenditures of all the households in the 2005/2006 living standard survey for Ghana. In the CGE model, however, households are aggregated and do represent larger household categories identified in the survey based on expenditure and location. As the relevant data for the CGE is the 2005 SAM for Ghana, which is constructed with data from the survey, there is a direct mapping between commodities and households in the model and survey. The endogenous changes in prices, incomes and commodity consumption from each aggregate household coming from the policy simulation to the CGE is used to adjust the level of expenditure for the corresponding disaggregated households in the survey. The incidence, depth and severity of poverty at the national level and for each household category are recalculated using the updated expenditure estimates and the poverty line.
The main policy experiment carried was a gradual reduction of import tariff rate by 6% per annum. The 6 per cent reduction in the import tariff rate was arrived because the target was to reduce import tariff to zero by the simulation period of 2020. So given an average tariff rate of 16 per cent, a 6 per cent yearly reduction will bring the tariff rate to zero at the end of the 15 year period.
3.0 Results
5
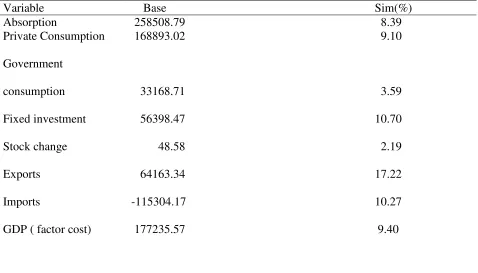
[image:6.612.69.547.182.455.2]The first objective of the study was to examine the macroeconomic impact of a gradual elimination of import tariffs. This section of the report pursues the first objective. The impact of gradual elimination of imports tariffs on key macroeconomic variables such as absorption -private consumption, government consumption, investment and stock change-, exports, imports, GDP, and exchange rate are summarized in Table 1. All the figures are expressed as percentages of the base values. The simulated results are derived after a policy experiment has been implemented.
Table 1: Macroeconomic Indicators
Variable Base Sim(%)
Absorption 258508.79 8.39
Private Consumption 168893.02 9.10
Government
consumption 33168.71 3.59
Fixed investment 56398.47 10.70
Stock change 48.58 2.19
Exports 64163.34 17.22
Imports -115304.17 10.27
GDP ( factor cost) 177235.57 9.40
Source: Simulation results
6
The improvement in the macroeconomic variables is justified in the sense that tariff removal improves the competiveness of the economy of Ghana. Tariff reduction results in a decrease in import prices that makes imports cheaper than domestic import-competing substitutes. Consumers therefore, shift from the domestic import-competing substitutes to demand more of imported goods and services. The import-competing sectors, which were initially heavily protected, will see a decline in output and employment.
The increase in imports causes depreciation of the local currency because the current account is assumed fixed. Again, the fall in the prices of imported inputs reduces domestic costs of production. These two effects lead to a reduction in the domestic costs of production for the expanding sectors of the economy. Output in these expanding sectors will rise, employment will grow, and the productive factors from the declining sectors will relocate to these growing sectors.
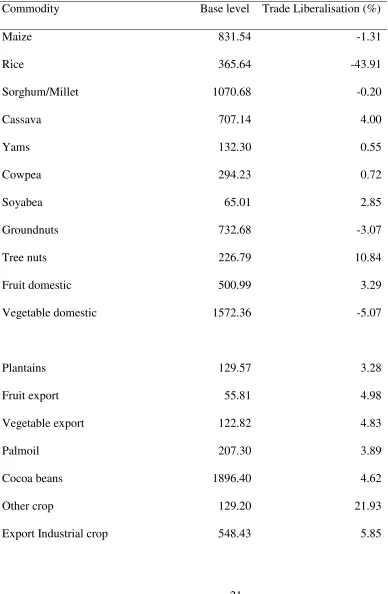
The reduction in costs of production and the depreciation of the local currency leads to increase in competiveness of the export sector. As a result of the increase in the domestic price of exports, the export industry expands, investment increases, production of exportables increase, export of goods and services rise, employment in the export sector rises, incomes increase; this creates a multiplier effect of incomes and expenditures leading to further increase in GDP. Examples of expanding exports sectors include non-traditional exports such as fruit, tree nuts, vegetable and industrial crops, and traditional exports like cocoa, forestry products, fish products and wood products (see Table 3 in Appendix A).
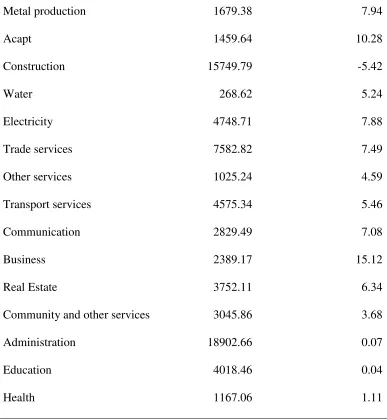
These are the sectors in which Ghana has comparative advantage and, more importantly, are also labour intensive activities. Consequently, employment of unskilled and semi-skilled labour will be substantial. Since labour income is the main source of income for majority of households in the country (refer to Appendix B), household incomes will rise and poverty rate may decrease.
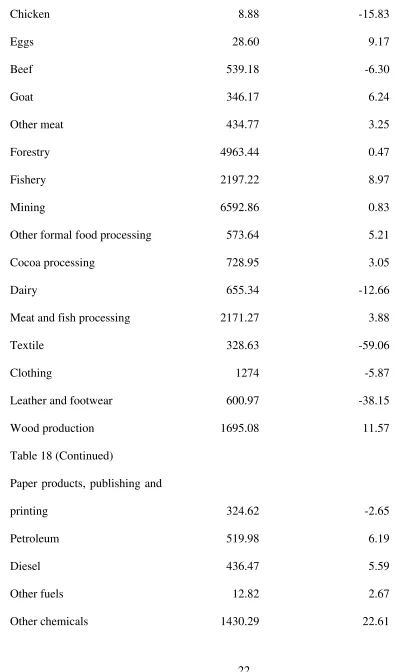
It is not only the exports sector that expands in response to the policy shock. Table 3 shows that other non-tradable sectors of the economy of Ghana have equally expanded. Some of the other sectors that have expanded include administration, health, water, education, trade, transport and communication, real estate, mining, trading, other services, etc. Majority of the sectors have expanded to provide supporting services to the export sector (backward linkages). Examples of these services include road transport, business services including telecommunication, public sector services, water and electricity, health and education. The expansion of the service sector which includes retail trade is significant in that it provides employment for many people. Construction contracts because as a non-tradable it had benefited enormously from the tariff protection. These results suggest that additional trade liberalisation brings welfare gains to Ghana. The findings confirm those of Wang and Zhai (1998) for China, Siddique et al (2008) for Pakistan, but contradict that of Pradhan and Sahoo (2008) for India.
Sectoral impact
7
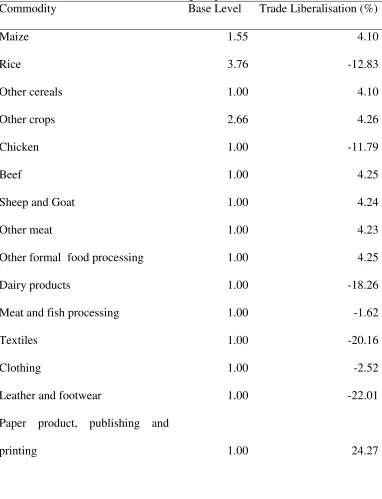
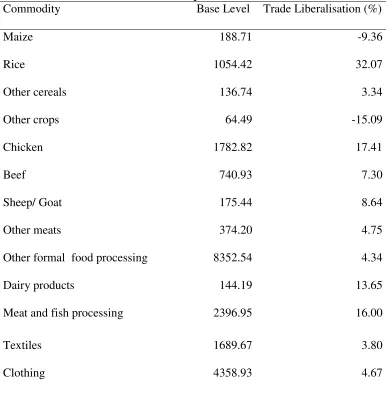
As depicted in Table 4, the price of rice, chicken, dairy products, textiles, leather and paper products decreases the most as a result of the gradual removal of import tariffs. The decline in the domestic price of imports brought about by tariff removal causes the quantity of imported goods in the consumer goods sector to rise. Examples of such imported consumer goods include rice, dairy products, chicken, processed food, textiles, clothing, and paper products (see Table 5 in Appendix E). Other products that have seen improvement in their imports are crude oil and related products and fertilizer. The increase in fertilizer import is, particularly, significant because it will boost agriculture production, ceteris paribus. Because imported goods are now cheaper relative to domestic import-competing substitutes, demand for imports in Ghana rises. Demand for domestic import-competing substitute falls, profits in that sector falls, and local production decreases. Because the earnings of factors of production fall under these circumstances, factors may relocate to the expanding sectors of the economy.
The expanding sectors are mainly in the agricultural, industrial and export subsectors. The expanding agriculture sectors include maize, other crops, other cereals, vegetable farming, goat and sheep rearing and cocoa farming. Other food processing, other chemicals, electricity and metal sectors constitute the expanding industrial sectors. For the export sector, the growing sectors include non-traditional exports such as fruit exports, tree nuts, vegetable exports and export industry crops, and the traditional exports like cocoa, forestry products, fish products and wood products, while in industrial sectors, sectors like electricity, water, and mining, among others have expanded their output (See Table 6 in Appendix F). The expanding sectors, particularly, agriculture employ over 50 percent of the labour force and by extension provides income to many households in Ghana.
It is instructive to note that most of the expanding agricultural and export-oriented sectors are labour-intensive productive activities. Consequently, employment of unskilled and semi-skilled labour will be substantial. Since labour income is the main source of income to majority of households in Ghana, household incomes will increase and many people will come out of poverty. The rise in incomes in the agricultural and export sectors will lead to increased demand for non-tradable goods and services. Cattaneo et al (1999) obtained a similar result for Costa Rica.
The expansion of the agricultural sector, industrial sector and export sector will cause ancillary sectors such as those in the services sector to also grow. In particular, the transportation industry such as road transport will have to expand to deal with the increasing volumes of cocoa, wood products and the transportation of all the agricultural products from the farm gate to the marketing centres. Other service sector activities that are expected to grow to support the expanding sectors in agriculture, industry, and exports, are telecommunication and business services, banking and finance, insurance and real estate.
Factor earnings
8
activities and as output in these sectors expand, the demand for labour will increase, wages go up, and labour from the contracting sectors, i. e. import-competing sectors of the economy, will be attracted to these sectors. This development has implications for factor employment, factor earnings and sectoral allocation of productive resources. Returns to labour has accordingly risen as shown in Table (7) ( Appendix G).
As shown in Table 7, with the exception of change in return to capital, there is a positive change in return to self-employed labour (agriculture), and land in all the ecological zones as a result of the removal across board of import tariff. This finding is not surprising as most of the expanding sectors are agricultural activities with high labour intensities. It is pertinent, however, to note that the change in returns to self-employed agricultural labour is more than that of skilled labour non-agriculture and unskilled labour non-agriculture. Similarly, the change in returns to land exceeds change in returns to skilled labour agriculture and unskilled labour non-agriculture. This pattern in the change of factor returns is because trade liberalisation allows Ghana to realize its comparative advantage in producing labour-intensive commodities that use agriculture labour and land intensively. As noted earlier, most of the expanding sectors of the economy are agriculture-related activities, which use agricultural labour and land intensively. Hence, the demand for self-employed agricultural labour and land increase relatively more than other factors, pushing up their relative returns.
Equally important, earnings of skilled labour agriculture) and unskilled labour (non-agriculture) have risen. The increase in income of non-agriculture skilled and unskilled labour emanates from the expansion in some sectors in the industrial sector such as electricity, water, the service sectors such as retail and wholesale activities, transportation, etc.
The decline in the returns to capital is expected as the capital released by the declining sectors cannot be absorbed in the expanding sector thereby causing the returns to capital to fall. The expanding sectors are not able to absorb the capital released from the contracting sector because of the specificity of capital. Specificity of capital means that the capital equipment is meant to be used for only one particular activity and so the capital cannot be redeployed for use in other productive activities. An example of the contracting sectors is textile. Capital used in the textile industry will not be suitable for an expanding sector in agriculture, say, vegetable farming.
Another reason that accounts for the decline in the returns to capital is that installed capacity utilization of firms is very low in Ghana. According to Asante, Nixson, and Tsikata (2000) capacity utilization of the manufacturing sector in Ghana was 46 percent in 1993. Among the numerous factors accounting for the low capacity utilization in manufacturing are lack of domestic demand for manufactured products, inadequate supply of raw materials, lack of spare parts and the use of obsolete machinery and plants. Now, with this huge unutilized capacity in the manufacturing sector and with the underlying cause of the problem, i.e. lack of domestic demand for locally manufactured goods unresolved, there is no way that capital released from a contracting sector will be absorbed by an expanding sector because the expanding sector will just put its idle capacity back to use.
9
shock indicate expansion in the traditional and non-traditional export sectors of the economy. These are labour-intensive activities and so the returns to all categories of labour have increased. On the other hand, there has been contraction of the import-competing sectors, which use capital intensively. Consequently, returns to capital have declined for the period of study.
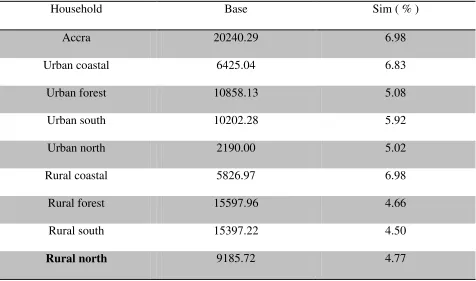
[image:10.612.70.546.223.504.2]Following the policy simulation, income change for all categories of household has been positive. Under trade liberalisation, for example, urban households benefit more from the income change than rural households as shown in Table 8. With the exception of Accra, all households recorded percentage changes of less than 1%. It is also worth noting that Rural South and Rural North obtained percentage increases of less 0.5%.
Table 8: Household income
Household Base Sim ( % )
Accra 20240.29 6.98
Urban coastal 6425.04 6.83
Urban forest 10858.13 5.08
Urban south 10202.28 5.92
Urban north 2190.00 5.02
Rural coastal 5826.97 6.98
Rural forest 15597.96 4.66
Rural south 15397.22 4.50
Rural north 9185.72 4.77
Source: Simulation Results
It is observed from Table 8 that even though both urban and rural households benefit from import liberalisation, urban households benefit more from import liberalisation than rural households. This finding confirms the finding of Acharya (2010) for Nepal but contradicts that of Omolo (2011) for Kenya where rural households benefitted more than urban households.
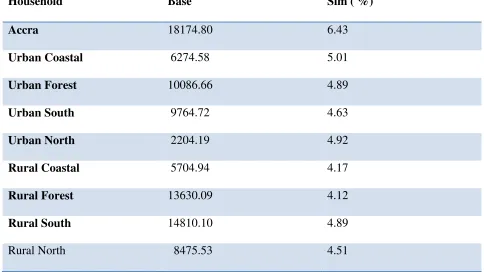
Household consumption, another channel through which import liberalisation impact poverty, was investigated. Given the positive change in incomes as reported in Table 9, the structure of consumption is affected through prices. With the liberalisation of import trade, prices of imported consumer goods fall and if households consume more of such goods with lower prices, then consumption will increase depending on the nature of the good in question. Table 9 reports the percentage change in consumption for all categories of households following import liberalisation.
10
Household Base Sim ( %)
Accra 18174.80 6.43
Urban Coastal 6274.58 5.01
Urban Forest 10086.66 4.89
Urban South 9764.72 4.63
Urban North 2204.19 4.92
Rural Coastal 5704.94 4.17
Rural Forest 13630.09 4.12
Rural South 14810.10 4.89
Rural North 8475.53 4.51
Source: Simulation Results
Clearly, apart from Accra, all other households register less than 1% increase in consumption.
Poverty Analysis
[image:11.612.64.548.79.351.2]The second objective of the study was to investigate the impact of import liberalisation on national and household poverty. In pursuant of this objective, tariff on import was gradually removed and the impact on incidence, depth and severity of poverty at both the national and household levels were analyzed. Table 10 reports the poverty outcome of gradual import tariff removal at the national level.
Table 10: National Poverty
Base Import Liberalisation
P0 P1 P2 P0 P1 P2
National 28.5 9.6 4.6 27.4 9.0 4.3
Urban 10.8 3.1 1.3 7.4 2.0 0.8
Rural 39.2 13.5 6.6 39.0 13.2 6.3
Source: Simulation Results
11
the poverty line, also decreases from 9.6 percent in the base to 9.0 percent in 2020. Equally, the severity of poverty declines from 4.6 percent in the base to 4.3 percent in 2020. In relative terms, the incidence of poverty reduces by 1.1 percent, the depth falls by 0.6 percent and the severity of poverty declines by about 0.3 percent. The outcome clearly suggests that trade liberalisation has the potential to better the circumstances of the poor in Ghana in the long run. This finding confirms the findings of Omolo ( 2011), Raihan (2010) and Nahar and Siriwardana (2009), who found that trade liberalisation has a positive impact on poverty.
Across all locations, all poverty indicators also decline. For urban areas, the headcount poverty decreases from 10.8 percent in the base scenario to 7.4 percent in 2020, while the poverty gap falls from 3.1 percent in the base to 2.0 percent in 2020. Finally, the severity of poverty falls from 1.3 percent in the base to 0.8 percent in 2020. The extent of decrease in the poverty measures under trade liberalisation is 3.4 percent for the incidence of poverty, 1.1 percent for the depth of poverty and 0.5 percent for the severity of poverty. In the rural areas, on the other hand, the percentage of people living below the poverty line goes down from 39.2 percent in the base scenario to 39.0 percent in 2020. The poverty gap decreases from 13.5 percent in the base scenario to 13.2 percent in 2020, while the severity of poverty falls from 6.6 percent in the base to 6.3 percent in 2020. In effect therefore, the incidence of poverty decreases by 0.2 percent, the depth of poverty falls by 0.3 percent and the severity of poverty declines by 0.3 percent.
In terms of the change in poverty indicators, the fall in the incidence of poverty, the depth of poverty and severity of poverty is higher in the urban area than in the rural area. For instance, while the incidence of poverty falls by a margin of 3.4 percent in the urban area, it falls by 0.2% in the rural area. The depth of poverty for urban area falls by 1.1 percent, while it declines by 0.3 percent in the rural area. Finally, the severity of poverty also changes by a higher percentage in the urban area than in the rural. Specifically, while the severity of poverty falls by 0.5 percent in the urban areas, it decreases by 0.3 percent in the rural areas.
The analysis done above shows that trade liberalisation favours urban households more than it does to rural households. The results confirm the findings of Annabi et al (2005) for Senegal, Siddique et al (2008) for Pakistan, Adjovi et al (2008) for Benin, but contradict the result of Aredo, Fekadu and Workneh (2007) who found that a complete elimination of tariff increases poverty at the national level in Ethiopia.
Two plausible reasons can be assigned for the observed trends in poverty measures after the implementation of the gradual removal of import tariffs. The first reason is that most of the goods whose prices decline after removing import tariffs are consumer goods consumed mainly by the urban population. It therefore stands to reason that the urban areas benefit more from poverty than the rural areas that consume less of these goods. Second, the levels of poverty in the rural areas are so high that the positive change in income is not enough to take many people out of poverty. In other words, the poor in the rural areas are so far away from the poverty line such that the positive change in income is not enough to reduce poverty significantly. Contrary, the poor in the urban areas are very close to the poverty line such that the slightest increase in income makes a significant impact on urban poverty.
12
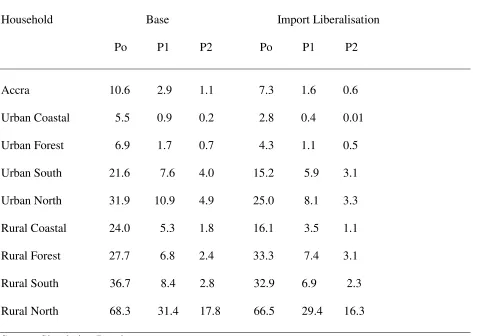
[image:13.612.71.550.268.604.2]still remains high. For example, the poverty headcount decreases from 68.3 percent in the benchmark to 66.5 percent in 2020 for the policy shock and the depth of poverty falls from 31.4 percent in the benchmark to 29.4 percent in 2020. Finally, the severity of poverty declines from 17.8 percent in the benchmark to 16.3 percent in 2020. Strikingly, the urban north tops in all the measures of poverty for the urban households. For instance, the incidence of poverty reduces from 31.9% to 25%, the depth of poverty reduces from 10.9% to 8.1% and the severity of poverty declines from 4.9% to 3.3%. It is also worthy of note that the highest reduction in the incidence of poverty occurs in the rural coastal household. Here, the poverty headcount decreases from 24.0 percent in the benchmark to 16.1 percent in 2020 under the policy scenario.
Table 11: Trade liberalisation and household poverty
Household Base Import Liberalisation
Po P1 P2 Po P1 P2
Accra 10.6 2.9 1.1 7.3 1.6 0.6
Urban Coastal 5.5 0.9 0.2 2.8 0.4 0.01
Urban Forest 6.9 1.7 0.7 4.3 1.1 0.5
Urban South 21.6 7.6 4.0 15.2 5.9 3.1
Urban North 31.9 10.9 4.9 25.0 8.1 3.3
Rural Coastal 24.0 5.3 1.8 16.1 3.5 1.1
Rural Forest 27.7 6.8 2.4 33.3 7.4 3.1
Rural South 36.7 8.4 2.8 32.9 6.9 2.3
Rural North 68.3 31.4 17.8 66.5 29.4 16.3
Source: Simulation Results
13
households and the Rural North households also experience the highest incidence of poverty among rural households.
One major reason why trade liberalisation has the lowest impact on poverty in the Northern region is that two of the major commodities of the region, rice and poultry, actually contracted. Other reasons cited for the region’s poor poverty record are its geographical disadvantages, including relatively low and variable rainfall, savannah vegetation, and the inaccessibility of large parts of the region which has less well-developed rural road networks compared to those in the rest of the country (ODI & CEPA, 2005; Breisinger et al, 2008) and a deliberate colonial government policy to under-develop the region so, it could serve as a source of cheap labour for the south (Shepherd & Gyimah-Boadi, 2004 as cited in AL-Hassan & Diao, 2007). The stark inequality between the north and the south of Ghana needs to be addressed in order to make a significant progress in poverty alleviation.
The finding that urban households benefit more from import tariff liberalisation than rural households corroborates the results of Nwafor et al (2007), Bibi and Chatti (2006), Siddique et al (2008), Siddique (2009), and Adjovi et al (2008), but contradicts the findings of Nahar and Siriwardana (2009), Chitiga and Mabugu (2005) and Bautista and Thomas (1997), Pradhan and Sahoo (2008) and Decaluwe et al (1999). In conclusion, import tariff liberalisation reduces poverty at the household level in the long run. In particular, trade liberalisation reduces the incidence, depth and severity of poverty. However, urban households benefit more than their rural counterparts.
4.0 Conclusions and Policy Recommendations
The study investigated the impact of import liberalisation on poverty in Ghana using a dynamic CGE framework. Two specific objectives were pursued. The first specific objective was to find out the effect of import liberalisation on macroeconomic indicators. Secondly, the study sought to investigate the impact of import liberalisation on the incidence, depth and severity of poverty at both the national and household levels.
In pursuance of these objectives and to be able to capture both the direct and indirect effects of import liberalisation in Ghana, a recursive dynamic computable general equilibrium (DCGE) and a microsimulation model calibrated to a 2005 Social Accounting Matrix (SAM) built with the most recent household survey data, Ghana living Standards survey (GLSS5) was used for the study for the period 2005 to 2020. One main policy simulation, gradual import tariff reduction, was carried out in this study to evaluate the poverty impacts of import liberalisation in Ghana.
The results of the study also revealed that import liberalisation produces positive impacts on macroeconomic indicators. Specifically, GDP, private consumption, government consumption, investment, exports and imports increased as a result of the gradual removal of import tariff. The second most important results observed is that import liberalisation is poverty-reducing. That is, the incidence of poverty, depth of poverty and severity of poverty decrease at the national, regional and household levels when all import taxes are removed. This means that while import liberalisation reduces the number of poor people in the population, it improves on the conditions of the poor as exemplified by the reduction in the depth of poverty and severity of poverty. However, the north-south poverty divide and the rural-urban poverty dichotomy still persist.
14
necessary economic infrastructure and so are economically vibrant, thereby offering huge opportunities for people to participate in international trading activities. The study recommends that import liberalisation must continue to be part of the poverty alleviation strategy of government for Ghana after 2015 and that government must focus poverty alleviation policies more in the rural areas.
5.0 References
Acharya, S. (2010). Import liberalisation and revenue replacement: Impacts in a small
Asian developing economy, European Journal of development research, vol. 22(3), 417-442.
Adjovi, E., Decaluwe, B., and Robichaud, V. (2008). Trade policy and poverty
in Benin: A general equilibrium analysis. In J. Cockburn, B. Decaluwe, & V. Robichaud
(Eds.), Trade liberalisation and poverty: A CGE analysis of the 1990s experience in
Africa and Asia (pp.197-216). Quebec: Poverty and Economic Policy Research Network.
Retrieved November 4, 2010, from
http://www.pep-
net.org/fileadmin/medias/pdf/promotionnal_material/TradeLiberalisation_Poverty-final.pdf
Akapaiboon, N. (2007). Trade liberalisation – Is it good for the poor?: An
analysis of Thailand. Retrieved February 23, 2011, from
http://www.unc.edu/depts/econ/workshops/natta.pdf
Al-Hassan, R. M., and Diao, X. (2007). Regional disparities in Ghana: Policy
options and public investment implications ( IFPRI Discussion Paper No. 693).
Washington, DC: International Food Policy Research Institute.
Annabi, N., Cisse, F., Cockburn, J., and Decaluwe, B. (2005). Trade
liberalisation, growth and poverty in Senegal: A dynamic microsimulation CGE model
analysis. Retrieved November 1,2010,
15
Annabi, N., Khondker, B. H., Raihan, S., Cockburn, J., & Decaluwe, B.
(2006). WTO agreements and domestic trade policy reforms implications for poverty in
Bangladesh: A study in a dynamic sequential CGE framework. In T. Hertel, & A,
Winters (Eds.), Poverty and the WTO: Impacts of the Doha development agenda (pp
429-466). Washington DC: The World Bank & Palgrave Macmillan.
Aredo, D., Fekadu, B., and Workneh, S. (2007). Trade liberalisation, poverty and
inequality in Ethiopia: A CGE microsimulation Analysis. Accessed from www.
Pep-net.org/fileadmin/medias/pdf/files-events/Fekadu-pr.pdf
Bchir, H., Bibi, S., Boughzala, M., Chatti, R., and Rajhi, T. (2005). Trade,
employment and wages in Tunisia: An integrated and dynamic CGE model (Research
No. FEM 21-29). Retrieved November 11, 2010, from
http://www.femise.org/PDF/a021/fem2129-utuniselmanar.pdf
Bibi, S. and Chatti, R. (2006). Trade Liberalisation and the dynamics of
Poverty in Tunisia: A layered CGE microsimulation analysis (MPIA Working Paper
2006-07). Retrieved November 3, 2010, from
http://132.203.59.36/__NEW-PEP/Group/papers/papers/MPIA-2006-07.pdf
Bautista, R., and Thomas, M. (1997). Income effects of alternative trade
policy adjustments on Philippine rural households: A General Equilibrium Analysis
(TMD Discussion paper No. 22). Washington, D.C: International Food Policy Research
Institute.
Bhasin, V. K., and Annim, S. K. (2005). Impact of elimination of trade taxes on
poverty and income distribution in Ghana. Washington DC: IMF
16
poverty and income distributions of households in Ghana. In J., Shaw (Ed.), Remittances,
microfinance and development: Building the links. Volume 1: A global view (pp 33-45).
Brisbane: The Foundation for Development Co-operation.
Bhasin, V. K., and Obeng, C. K. (2005b). Globalization, technology, poverty
and income distributions of households in Ghana. In A, Ahmed(Ed.),
Bridging the divide: The role technology and trade (Conference
Proceedings ) UK: Emerald Group Publishing Limited. Retrieved
August 23, 2011, from http://www.worldsustainable.org/proceedings/m
proceedings_2005.pdf
Bhasin, V. K, and Obeng, C. K. (2006). Trade liberalisation, foreign
borrowing, poverty and income distributions of households in Ghana. ICFAI Journal of
Applied Economics, 5( 4), 38-53.
Breisinger, C., Diao, X., and Thurlow, J. (2009). Modelling growth options and
structural change to reach middle income country status: The case of Ghana. Economic
Modelling, 26, 514-525.
Breisinger, C. Diao, X., Thurlow, J. and Al-Hassan, R. M. (2008). Agriculture
for development in Ghana: New opportunities and challenges ( IFPRI Discussion Paper
00784). Washington, D.C: International Food Policy Research Institute.
Cattaneo, A., Hinojosa-Ojeda, R. A., and Robinson, S. (1999). Costa Rica
trade liberalisation, fiscal imbalances, and macroeconomic policy: A computable general
equilibrium model. The North American Journal of Economics and Finance, 10, 39 – 67.
Chen, S., and Ravallion, M. (2004). Welfare impacts of China’s accession to
17
Chitiga, M., and Mabugu, R. (2005). The impact of tariff reduction on poverty
in Zimbabwe: A CGE top-down approach, Journal of Economic and Management
Sciences, 8(1), 102-116. Retrieved October 28, 2010, from
http://www.journals.co.za/ej/ejour_ecoman.html
Cororaton, C. B. (2008). The impact of trade reforms in the 1990s on welfare
and poverty in the Philippines. In J. Cockburn, B. Decaluwe, & V. Robichaud (Eds.),
Trade liberalisation and poverty: A CGE analysis of the 1990s experience in Africa and
Asia (pp 345 – 376). Quebec: Poverty and Economic Policy Research Network.
Decaluwe, B., Party, A., Savard, L., and Thorbecke, E. (1999). Poverty
analysis within a general equilibrium framework ( CREFA, Working Paper 99-09).
Quebec: Department of Economics, University of Laval, Canada.
Diallo, S. S., Kone, S., and Kamagate, M. (2010). Trade liberalisation and
income distribution in Cote d’lvoire: A simulation with a dynamic general equilibrium
model (PMMA working paper 2010-05 ). Quebec: Poverty and Economic Policy
Research Network.
Feraboli, O. (2007). Preferential trade liberalisation, fiscal policy responses
an welfare: A dynamic CGE model for Jordan. Retrieved May 6, 2008, from
http://rief.univ-paris1.fr/Rennes2007/16-Feraboli.PDF.
ISSER. (2009). The state of the Ghanaian economy in 2008. Accra: ISSER.
ISSER. (2010). The state of the Ghanaian economy in 2009. Accra: ISSER.
Killick, T. (2010). Development economics in action: A study of economic
policies in Ghana (2ed). London: Routledge.
18
general equilibrium model in GAMS. Washington, D.C: IFPRI.
Lubker, M., Smith, G., and Weeks, J. (2002). Growth and the poor: A
comment on Dollar and Kraay, Journal of International Development, 14: 555-571.
McCulloch, R. (2005). Protection and real wages: The Stolper-Samuelson
theorem. In M. Szenberg, L. Ramrattan, & A. A. Gottesman (Eds), Samuelsonian
economics and the 21st century (pp 1-14). New York: Oxford University Press.
Nahar, B., and Siriwardana, M. (2009). Impact of trade liberalisation on
poverty in Bangladesh: a quantitative assessment, South Asia Economic Journal.
Retrieved November 2, 2010, from
http://sae.sagepub.com/content/10/2/325.full.pdf+html
Nwafor, M., Adenikinju, A., and Ogujuiba, K. (2007). The impacts of trade
liberalisation on poverty in Nigeria: Dynamic simulations in a CGE model (MPIA
Working Paper, 2007-16). Quebec: Poverty and Economic Policy Network.
Omolo, M. W. O. ( 2011). The impact of trade liberalisation on poverty in Kenya,
Institute of Economic Affairs Research Paper, Institute of Economic Affairs, Kenya.
Pradhan, B. K., and Sahoo, A. (2008). The impact of trade liberalisation on
household welfare and poverty in India. In J. Cockburn, B. Decaluwe, and V. Robichaud
(Eds). Trade liberalisation and poverty; A CGE analysis of the 1990s experience in
Africa and Asia (pp 217-262). Quebec: Poverty and Economic Policy Research Network.
Raihan, S. ( 2010). Welfare and poverty impacts of trade liberalisation: A dynamic CGE
microsimulation analysis, International journal of microsimulation 3(1), 123-126.
Ravallion, M. (2001). Growth, inequality and poverty: looking beyond
19
Rodriguez, F. and Rodrik, D. (2001). Trade policy and economic growth: A
sceptic’s guide to the cross-national evidence. NBER Macroeconomics annual 2000.
Cambridge: MIT Press.
Rodrik, D. (2000). Comments on trade, growth, and poverty by David Dollar
and Aart Kraay, Retrieved November 4, 2010, from
http://ksghome.harvard.edu/~drodrik.academic.ksg/papers.html
Siddiqui, R., Kemal, A. R., Siddiqui, R., and Kemal, A. (2008). Tariff
reduction, fiscal adjustment and poverty in Pakistan: A CGE-based analysis ( MPIA
working paper 2008-17). Quebec: Poverty and Economic Policy Research Network.
Stolper, W, and Samuelson, P. A. ( 1941). Protection and real wages. Review
of Economic Studies, 9(1), 58-73
Wang, Z., and Zhai, F. (1998). Tariff reduction, tax replacement and
implications for income distribution in China. Journal of Comparative Economics, 26,
358-387.
Wei, S. J. (2002). Is globalisation good for the poor in China? Finance and
Development, 39(3), 26 – 29.
Winters, L. A. (2000a). Trade and poverty: Is there a connection? In D. B.
H. Nordstrom, & L. A. Winters (Eds.) Trade, income disparity and poverty. (Special
study 5) (pp 43 -69). Geneva: WTO.
Winters, L. A., McCulloch, N., and Mckay, A. (2004). Trade liberalisation
21 Appendix A
Table 3: Trade liberalisation and value added
Commodity Base level Trade Liberalisation (%)
Maize 831.54 -1.31
Rice 365.64 -43.91
Sorghum/Millet 1070.68 -0.20
Cassava 707.14 4.00
Yams 132.30 0.55
Cowpea 294.23 0.72
Soyabea 65.01 2.85
Groundnuts 732.68 -3.07
Tree nuts 226.79 10.84
Fruit domestic 500.99 3.29
Vegetable domestic 1572.36 -5.07
Plantains 129.57 3.28
Fruit export 55.81 4.98
Vegetable export 122.82 4.83
Palmoil 207.30 3.89
Cocoa beans 1896.40 4.62
Other crop 129.20 21.93
22
Chicken 8.88 -15.83
Eggs 28.60 9.17
Beef 539.18 -6.30
Goat 346.17 6.24
Other meat 434.77 3.25
Forestry 4963.44 0.47
Fishery 2197.22 8.97
Mining 6592.86 0.83
Other formal food processing 573.64 5.21
Cocoa processing 728.95 3.05
Dairy 655.34 -12.66
Meat and fish processing 2171.27 3.88
Textile 328.63 -59.06
Clothing 1274 -5.87
Leather and footwear 600.97 -38.15
Wood production
Table 18 (Continued)
1695.08 11.57
Paper products, publishing and
printing 324.62 -2.65
Petroleum 519.98 6.19
Diesel 436.47 5.59
Other fuels 12.82 2.67
[image:23.612.62.461.65.737.2]23
Metal production 1679.38 7.94
Acapt 1459.64 10.28
Construction 15749.79 -5.42
Water 268.62 5.24
Electricity 4748.71 7.88
Trade services 7582.82 7.49
Other services 1025.24 4.59
Transport services 4575.34 5.46
Communication 2829.49 7.08
Business 2389.17 15.12
Real Estate 3752.11 6.34
Community and other services 3045.86 3.68
Administration 18902.66 0.07
Education 4018.46 0.04
Health 1167.06 1.11
Source: Simulation Results
[image:24.612.69.456.68.488.2]Appendix B
Table 27: Factorial source of household income
Household labour Capital Remittances Transfer
24
Accra 83.5 3.1 10.4 3.4 100.0
Urban Coastal 86.4 1.1 9.9 2.6 100.0
Urban Forest 83.9 1.1 14.5 0.5 100.0
Urban South 91.2 3.6 4.6 0.6 100.0
Urban North 89.1 1.5 8.9 0.5 100.0
Rural Coastal 90.7 1.8 7.1 0.4 100.0
Rural Forest 90.5 1.7 6.7 1.1 100.0
Rural South 93.6 1.6 4.7 0.06 99.96
Rural North 92.7 3.4 3.4 0.5 100.0
Source: Author’s own computation from GLSS 5
[image:25.612.72.505.70.322.2]Appendix C
Table 2: Initial tariff rates
Sector Tariff rate
Rice 20.4
Chicken 18.9
Forestry 5.5
Dairy Products 28.7
Meat and fish Processing 6.1
Textiles 32.1
Clothing 7.1
Leather and footwear 35.1
Paper products, publishing and printing 39.2
Fuel 0.8
Fertilizer 10.2
25
Metal products 2.7
Source: Ghana 2005 SAM
[image:26.612.73.455.217.716.2]Appendix D
Table 4: Trade Liberalisation and import prices
Commodity Base Level Trade Liberalisation (%)
Maize 1.55 4.10
Rice 3.76 -12.83
Other cereals 1.00 4.10
Other crops 2.66 4.26
Chicken 1.00 -11.79
Beef 1.00 4.25
Sheep and Goat 1.00 4.24
Other meat 1.00 4.23
Other formal food processing 1.00 4.25
Dairy products 1.00 -18.26
Meat and fish processing 1.00 -1.62
Textiles 1.00 -20.16
Clothing 1.00 -2.52
Leather and footwear 1.00 -22.01
Paper product, publishing and
26
Crude and other oils 1.00 4.26
Other fuels 1.00 3.52
Fertilizer 1.00 -5.17
Other chemicals 0.88 -0.54
Metal products 0.48 1.45
Electricity 1.00 4.14
[image:27.612.69.455.306.724.2]Source: Simulation Results
Table 5: Trade Liberalisation and imports
Commodity Base Level Trade Liberalisation (%)
Maize 188.71 -9.36
Rice 1054.42 32.07
Other cereals 136.74 3.34
Other crops 64.49 -15.09
Chicken 1782.82 17.41
Beef 740.93 7.30
Sheep/ Goat 175.44 8.64
Other meats 374.20 4.75
Other formal food processing 8352.54 4.34
Dairy products 144.19 13.65
Meat and fish processing 2396.95 16.00
Textiles 1689.67 3.80
27
Leather and footwear 1069.50 4.99
Paper product, publishing and
printing 503.28 5.27
Crude and other oils 10104.97 6.44
Other fuels 4787.27 4.48
Fertilizer 2879.73 0.31
Other chemicals 7356.46 0.87
Metal products 6335.89 -5.36
Electricity 86.36 -13.92
[image:28.612.71.455.364.721.2]Source: Simulation Results
Table 6: Trade liberalisation and exports
Commodity Base level Trade Liberalisation (%)
Cocoyam 92.31 -2.81
Palm oil 163.02 -0.73
Groundnuts 46.58 -.03
Tree nuts 473.63 1.37
Fruit export 660.77 22.05
Vegetable export 47.78 4.91
Cocoa beans 874.65 5.77
Export of industrial crops 79.43 5.53
Forestry 7726.40 2.05
Fishing 1679.71 15.06
28
Cocoa processing 1927.72 0.03
Meat and fish processing 1927.72 16.78
Textiles 118.52 -4.30
Wood products 3246 14.35
Other chemicals 119.45 6.36
Repairing, hotel and restaurant 8203.77 6.04
Source: Simulation Results
[image:29.612.70.460.316.573.2]Appendix G
Table 7: Trade liberalisation and factor returns
Factor Base Trade Liberalisation (%)
Self-employed agricultural labour 8.76 7.37
Skill labour (non-agricultural) 26.26 5.35
Unskilled labour (non-agricultural) 12.49 5.11
Capital 0.21 -2.36
Land (coast) 3.26 8.00
Land (forest) 2.39 6.62
Land (south) 3.90 6.46
Land (north) 2.17 5.85