DEVELOPMENT AND VALIDATION OF RP HPLC METHOD FOR
THE SIMULTANEOUS ESTIMATION OF ATENOLOL AND
CHLORTHALIDONE IN TABLET FORMULATION
Hitesh C. Pimpale, Parag T. Bakshe*, Sachin S. Rane, Prof. (Dr.) Rajesh Y. Chaudhari,
Prof. (Dr.) Vijay R. Patil
Department of Pharmaceutical Chemistry, T.V.E.S.’s Hon. L.M.C. College of Pharmacy,
Faizpur- 425 503, Dist-Jalgoan, (M.S.), India.
ABSTRACT
A new simple, rapid, precise and accurate assay method was developed
for simultaneous estimation of Atenolol and Chlorthalidone in pure
and tablet formulation. The analytes were separated by RP HPLC on a
RP-Purosnosphere C18 column (5 µm, 4.6mm* 250 mm). The mobile
phase was methanol: water (60:40 v/v) at 1.1 ml/min flow rate
satisfactorily resolve the tertiary mixture. The UV detector was
operated at 238 nm for the determination of all the drugs. Linearity,
accuracy and precision were found to be acceptable over the
concentration ranges of 10-160 µg/ml for Atenolol and 5-25 µg/ml for
Chlorthalidone with a R2 0.9957 and 0.9965values respectively. The
optimized methods proved to be specific, robust and accurate for the
quality control of drugs in bulk drug and pharmaceutical formulations.
KEYWORDS: Atenolol, Chlorthalidone, Method Validation, RP HPLC, ICH, C18.
INTRODUCTION
Drugs play a vital role in the progress of human civilization by curing diseases. Analytical
chemistry is divided into two branches qualitative and quantitative.[1] Today a majority of the
drugs used are of synthetic origin. These are produced in bulk and used for their therapeutic
effects in pharmaceutical formulations. Pharmaceutical product quality is of vital importance
for patient safety. Pharmaceutical analysis is the branch of pharmacy that is responsible for
developing sensitive, reliable and accurate methods for the estimation of drugs in
pharmaceutical dosage forms and biological fluids.[2]
Volume 6, Issue 4, 897-907. Research Article ISSN 2277– 7105
Article Received on 27 Jan. 2017,
Revised on 19 Feb. 2017, Accepted on 09 March. 2017
DOI: 10.20959/wjpr20174-8053
*Corresponding Author
Parag T. Bakshe
Department of
Pharmaceutical Chemistry,
T.V.E.S.'s Hon.L.M.C.
College of Pharmacy,
Faizpur- 425 503,
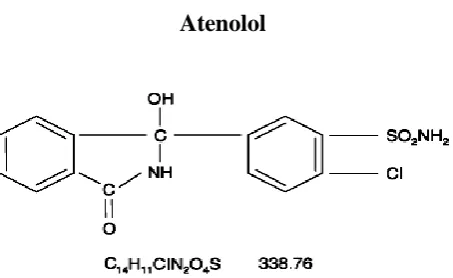
Atenolol (ATN) is a β1 receptor specific antagonist, chemically
(RS)-4-(2-hydroxy-3-isopropylaminopropoxy) phenylacetamide3 while Chlorthalidone (CTD) chemically described
as a 2-Chloro-5-(1-hydroxy-3-oxo-2,3-dihydro-1H-isoindol-1-yl) benzenesulfonamide.[4]
ATN with CTD is used in treatment of hypertension. Several methods are available in the
literature for the determination of ATN and CTD most of these methods are for the
determination of ATN and CTD separately, or in combination with other drug. Analytical
methods reported for quantitative determination of ATN individually in pharmaceutical
formulations or biological fluids are HPLC[5,6,7] and UV.[8,9,10] Analytical methods reported
for quantitative determination of CTD individually in pharmaceutical formulations or
biological fluids are HPLC[11,12,13,14], UV[15,16] and HPTLC.[17,18]
These drugs are used in combination therapy not only because blood pressure control is often
inadequate using monotherapy but also because combination therapy can simplify dosing
regimens, improve compliance, decrease side effects and reduce cost. Literature survey
revealed that very few methods are reported for determination of ATN and CTD
pharmaceutical formulations. Therefore it was thought worthwhile to develop simple, precise
[image:2.595.176.420.427.692.2]and robust analytical method for the same.
Fig. 1: Chemical structures of Atenolol
Atenolol
Fig. 2: Chemical structures of Chlorthalidone
[image:2.595.186.413.524.663.2]MATERIALS AND METHODS
EXPERIMENTAL
Chemicals and reagents
Atenolol was obtained as a generous gift samples from the Zydus Healthcare Pharmaceuticals
Pvt. Ltd. (Sikkim) and chlorthalidone from Ipca laboratories ltd (Mumbai). Commercial
pharmaceutical preparation TENORIC-25 tablets, containing Atenolol (ATN) 25 mg and
Chlorthalidone 12.5mg was collected from local market. Acetonitrile, methanol and water
used were of HPLC grade (Qualigens Fine Chemicals, Mumbai, India). Ammonium Acetate
Buffer was AR grade (Qualigens Fine Chemicals, Mumbai, India). A 0.2 µm nylon filter
(Pall life Sciences, Mumbai, India) was used. All other chemicals and reagents used were
analytical grade unless otherwise indicated.
Apparatus
The chromatographic system (Systronics Corporation, India) consisted of LC
8600aprominence solvent delivery module, a manual injector with a 20 µL fixed loop and a
UV-visible detector. The separation was performed on a Hibar® (Merk, Germany)
RP-Purosphere Star C18 column (5 µm, 4.6mm* 250 mm) at an ambient temperature.
Chromatographic data were recorded and processed using Chemitochrom 2000 software. A
Fast clean ultrasonicate cleaner (India) was used for degassing the mobile phase. Shimadzu
UV 1800 double beam UV visible spectrophotometer and Sansui-vibra DJ-150S-S electronic
balance were used for Spectrophotometric and weighing purposes respectively.
Chromatography Conditions
Chromatographic separations of active (ATN and CTD) substances were obtained by using
Hibar® (Merk, Germany) RP-Purosphere Star C18 column (5 µm, 4.6mm* 250 mm), mobile
phase methanol : water (60:40 v/v) (PH 3.2 was adjusted with 10% Ammonium Acetate
Buffer) was prepared, filtered through a 0.2 μm nylon filter and degassed for 5 min in an
ultrasonicator. The mobile phase was pumped through the column at flow rate of 1.1 ml/min1.
Analyses were carried out at ambient temperature with detection at 238 nm. The injection
volume was 20 μL and each analysis required 12 min.
Standard Solutions
Stock standard solutions of ATN 1 mg/ml and CTD 1 mg/ml were prepared by dissolving 25
mg ATN standard and 12.5 mg CTD standard in 25 ml methanol. Working standard solutions
corresponding stock solutions with mobile phase.
Sample Solution
Twenty TENORIC-25 tablets containing ATN (25 mg) and CTD (12.5 mg) were weighed
and ground to fine powder. A quantity of sample equivalent to ATN (25 mg) and CTD (12.5
mg) was transferred into 100 ml volumetric flask containing methanol (60 ml), sonicated for
15 min and the volume was made up to the mark and filtered through 0.45µm nylon
membrane filter. This solution was (1 ml) transferred to 10 ml volumetric flaks, dissolved and
volume was adjusted to the mark. The response of solution was measured at 238 nm and
quantification of ATN and CTD was done by using present HPLC method. Typical
chromatogram of final resultant formulation solution was shown in (Fig. 1).
Validation of Proposed Method
Calibration curve (linearity)
Accurately measured aliquots of working standard solutions equivalent to 20-120 µgm/ml
ATN, and 5-30 µg/ml CTD were transferred to series of 10 ml volumetric flasks and the
contents of the flasks were diluted to volume with mobile phase. A 20 µL aliquot of each
solution was injected in triplicate into the liquid chromatography. The conditions including
the flow rate of mobile phase at 1.1 ml/min, detection at 238 nm and run time program for 12
min, were adjusted. A calibration curve for each drug was obtained by plotting area under the
peak versus concentration. The graphs of area vs concentration were recorded for all the
drugs and are shown in (Fig. 3 and 4).
Accuracy (% recovery)
Recovery studies were carried out by adding a known amount of pure drugs ATN and CTD to
a pre analyzed sample solution. These studies were carried out by spiking 80%, 100% and
120% respective drug. The recovery studies showed that the results were within acceptable
limits, above 99% and below 101%. The results are given in (Table 2).
Method precision (repeatability)
The precision of the developed method was assessed in terms of repeatability, intraday and
inter-day precision by analyzing six replicate standard samples. The % R.S.D. values of the
results corresponding to the peak area and retention time were expressed for intra-day
Intermediate precision (reproducibility)
The intraday and interday precisions of the proposed method were determined by estimating
the corresponding responses 5 times on the same day and on 5 different days for present
method. The results are reported in terms of relative standard deviation (RSD).
Limit of detection (LOD) and limit of quantitation (LOQ)
LOD and LOQ of the drug were calculated using the equations according to International
Conference on Harmonization (ICH) guidelines.
Robustness
Robustness of the method was determined by making slight changes in chromatographic
conditions. Effect of % of methanol (59, 60 and 61%) in mobile phase on the retention time
and slight changes in flow rate were applied as variable parameters. Flow rate varied at three
levels (-1, 0, 1). One factor at the time was changed to estimate the effect. Thus standard
solution at varied pH ( pH 3.1, 3.2 and 3.3) three pH levels was performed.
Specificity
Specificity is the ability of the analytical method to measure analyzed response in presence of
interferences including degradation products and related substances. Specificity was checked
by determining ATN and CTD in laboratory prepared binary mixture and in binary mixture
containing different degradation products.
System suitability Test
In the system suitability test tertiary solution of 25 µg/ml of ATN and 12.5 µg/ml of HCTZ
(n=6) was prepared and injected. Then the system suitability parameters like retention time,
theoretical plates, tailing factor and resolution were calculated from the chromatogram.
RESULTS AND DISCUSSION
The absorption spectra of ATN and CTD greatly overlap; so conventional determination of
these compounds in mixture is not possible. To optimize the LC parameters, several mobile
phase compositions were tried. A satisfactory separation and good peak symmetry for ATN
and CTD were obtained with a mobile phase consisting of methanol: water (60:40 v/v), pH
3.2 adjusted using 10% Ammonium Acetate Buffer. Quantification of the drugs was
performed at 238 nm. Resolution of the components with clear baseline separation was
Validation of the Proposed Method
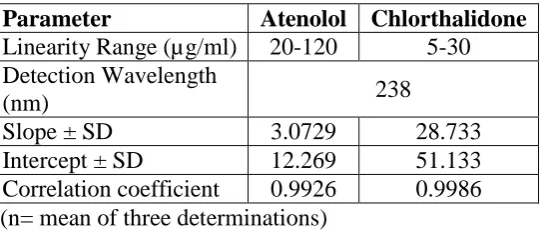
Linearity
Linear correlation was obtained between peak areas and concentrations of ATN and CTD in
range of 20–120 and 5–30 µg/ml, respectively. The linearity of calibration curves was found
to be acceptable over the concentration ranges of 20-120 µg/ml for ATN while 5-30 µg/ml
for CTD with a R2 0.9926 and 0.9986 values respectively.
(Table- 1, Fig- 2 and 4). The results show that good correlation existed between the peak area
and concentration of the analysts.
Accuracy
The recovery experiments were performed by the standard addition method. The recoveries
obtained were 99.67and 99.86% for ATN and CTD respectively (Table 2). The high values
indicate that the method was accurate.
Method precision
Precision study was carried out using parameter like method repeatability study which
showed that results were within acceptable limit 0.572and 0.831 i.e. % RSD below 2.0
indicating that the method is reproducible. The results are shown in (Table No.2)
Intermediate precision
The intraday RSD values for ATN and CTD were 0.423-0.416 and 0.536-0.537%,
respectively. The interday RSD values for ATN and CTD were 0.583–0.592 and 0.836–
0.836%, respectively. The % RSD (< 2%) values indicate that the method was sufficiently
precise (Table 2).
LOD and LOQ
LOD values for ATN and CTD found to be 3.48592µg/ml and 2.58491µg /ml, respectively.
LOQ values for ATN and CTD were found to be 4.582048 µg/ml and 5.574839 µg/ml,
respectively (Table 2). These data showed that the method was sensitive enough for the
determination of ATN and CTD.
Robustness
The method was found to be robust with no significant changes on test result upon change of
analytical conditions like different flow rate, % methanol in mobile phase and pH of mobile
results. It was found that under small deliberate changes of chromatographic factors, there
was no considerable change in under study parameters.
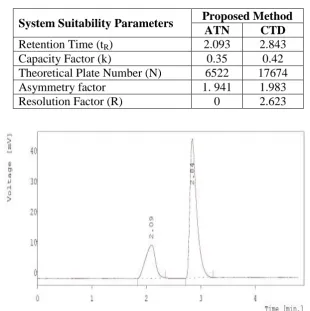
System Suitability Test
A tertiary solution of 25 µg/ml of ATN and 12.5 µg/ml of CTD (n=5) was prepared and same
was injected, then the system suitability parameters were calculated from the chromatogram.
The parameters, retention times, resolution factor, tailing factor and theoretical plates were
evaluated. The results (Table 4) obtained from system suitability tests are in agreement with
the official requirements.
Table: 1 Regression analysis of the calibration curves for Atenolol and Chlorthalidonein
the proposed HPLC Method
Parameter Atenolol Chlorthalidone
Linearity Range (µg/ml) 20-120 5-30 Detection Wavelength
(nm) 238
Slope ± SD 3.0729 28.733
Intercept ± SD 12.269 51.133
[image:7.595.165.440.305.423.2]Correlation coefficient 0.9926 0.9986 (n= mean of three determinations)
Table 2: Summary of the validation parameters for the proposed HPLC method
Parameter Atenolol Chlorthalidone
LOD 3.48592µg /ml 2.58491µg /ml
LOQ 4.582048µg /ml 5.574839µg /ml
Accuracy,% 99.67 ± 0.65 99.86 ± 0.62
Repeatability
(%RSD, n = 5) 0.572 0.831
Precision (RSD, %)
Interday, n = 3 99.79 (0.592) 99.90 (0.836)
Intraday, n = 3 99.21 (0.416) 99.43 (0.537)
LOD = Limit of detection.
LOQ = Limit of quantification
RSD = Relative standard deviation.
Table 3: Assay results for the combined dosage form using the proposed HPLC method
Formulation Atenolol Chlorthalidone
Table No. 4: System suitability test parameters for ATN and CTD for the proposed
HPLC method
System Suitability Parameters Proposed Method
ATN CTD
Retention Time (tR) 2.093 2.843
Capacity Factor (k) 0.35 0.42
Theoretical Plate Number (N) 6522 17674
Asymmetry factor 1. 941 1.983
Resolution Factor (R) 0 2.623
Fig. 3: Typical liquid chromatogram obtained for a 20 µL injection of a synthetic
mixture of ATN and CTD
[image:8.595.139.450.105.417.2] [image:8.595.150.446.486.663.2]Fig. 5: Calibration Curve for Chlorthalidone
CONCLUSIONS
The proposed LC method presented in this paper has advantages of simplicity, accuracy,
precision and convenience for separation and quantitation of ATN and CTD in combination
and can be used for the assay of their respective dosage form. Moreover, the proposed LC
method is a stability indicating assay method that can determine ATN and CTD in presence
of their degradation products. Thus, the proposed LC method can be used for the quality
control of ATN and CTD in typical laboratories.
ACKNOWLEDGEMENTS
The authors are thankful to Zydus Healthcare Pharmaceuticals Pvt. Ltd. and Ipca laboratories
ltd for supplying generous gift samples of pure drugs. Hereby, the authors declare that there
is no conflict of interests regarding the publication of this paper.
REFERENCES
1. G. H. Jeffery, J. Bassett, J. Mandham and R. C. Denny. Vogel’s Text Book of
Quantitative Chemical Analysis. 5th ed. U.K. Longman Scientific and Technical Pub,
1994; 3-4.
2. D. Watson: Pharmaceutical Analysis. 1st ed. Edinburgh: Churchill Livingstone, 1999;
1-11.
3. R. Gaur, M. Azizi, J. Gan, P. Hansal and K. Harper. British Pharmacopoeia. London:
Medicines and Healthcare products Regulatory Agency (MHRA), 1988; 49: 903.
4. J. Martin, L. A. Claase, B. Jordan and C.R. Macfarlane. British National Formulary.
5. Bhusari V, Dhaneshwar S. Validated HPTLC Method for Simultaneous Estimation of
Atenolol, Hydrochlorothiazide and Amlodipine Besylate in Bulk Drug and Formulation.,
International Journal of Analytical and Bioanalytical Chemistry, 2011; 1(3): 70-76.
6. Chheta N, Gandhi S, Rajput S. Development and Validation Of A Stabilityindicating
High Performance Liquid Chromatographic (Hplc) Method for Atenolol and
Hydrochlorthiazide In Bulk Drug And Tablet Formulation., International Journal of Chem
Tech Research, July-Sept, 2009; 1(3): 654-662.
7. Krishna R, Gupta A, Wadodkar R, Wadodkar S. Validated Reverse Phase HPLC Method
for Simultaneous Estimation of Atorvastatin and Atenolol in Tablets., Scholars Research
Library Der Pharmacia Lettre, 2011; 3 (4): 393-403.
8. Jaina N, Jaina R, Thakura N, Jaina S, Jain D. Simultaneous Spectrophotometric
Estimation of Lercanidipine Hydrochloride and Atenolol in Tablet Dosage Form.,
Eurasian J Anal Chem, 2011; 6(2): 84-90.
9. Lalitha G, Salomi P. Development of an Analytical Method and Its Validation for The
Analysis of Atenolol In Tablet Dosage form by Uv- Spectrophotometry., Int J Pharm
Pharm Sci, 2012; 5, 6(2): 197-199.
10.Dey S, Sarkar S, Malakar J, Ghosh A, Gangopadhyay A, Mazumder B.
Spectrophotometric Method for Simultaneous Determination of Atenolol and Atorvastatin
in tablet dosage forms, 2012; 3: 40-43.
11.Bapnal M, Bhoi K. Development and Validation of Analytical Method for Simultaneous
Estimation of Cilnidipine and Chlorthalidone in their Combined Dosage Form., IntJ Ayu.
Pharm Chem., 2015; 2(3): 306-308.
12.Devi L, et.al. A New Rp-Hplc Method Development and Validation for The Dissolution
Studies of Atenolol and Chlorthalidone in Immediate Release Tablet Dosage Forms,
2014; 4(4): 958-96.
13.Charde M, Welankiwar A, Chakole R. Development of Validated Rp-Hplc Method for
the Simultaneous Estimation of Atenolol and Chlorthalidone in Combine Tablet Dosage
Form. 2014; 3(1): 241-243.
14.Ganipisetty L, Dachinamoorthy D, Seshagiri Rao J. Stability Indicating RP-HPLC-PDA
Method for Simultaneous Estimation of Olmesartan Cilnidipine and Chlorthalidone with
Forced Degradation Behavior Study in Bulk and in its Tablet Dosage Form Am.j. pharm
Tech. Res., 2015; 5(2): 351-353.
15.Patel S, Patel D. Simultaneous Determination of Metoprolol Succinate and
16.Kavitha J, Muralidharan S. Development and Validation of New Method for Atenolol,
Hydrochlorothiazide and Losartan Potassium by Rp-Hplc: its Application to Routine
Quality Control Analysis, 2011; 2(2): 880-884.
17.Parmar K, Mehta R. Development and Validation of HPTLC Method for Simultaneous
Determination of Telmisartan and Chlorthalidone in Bulk and Pharmaceutical Dosage
Form, 2012; 3(2): 451-455.
18.Ingle S, Patil P, Kulkarni V, Patil S, Salunke P, Wagh R. Development and Validation of
UV Spectrophotometric Method for Chlorthalidone in Bulk and Pharmaceutical Dosage