© 2019, IRJET | Impact Factor value: 7.211 | ISO 9001:2008 Certified Journal | Page 7756
Auto Range Resistor Sorter
Georgy Paul
1, Rohith R
2, Anson Jose
3, Nayana Dileep
4, Dr. Jinsa Kuruvilla
51,2,3,4
Student, Dept. of Electronics and Communication Engineering, Mar Athanasius College of Engineering
Kothamangalam, Kerala, India
5
Assistant Professor, Dept. of Electronics and Communication Engineering, Mar Athanasius College of Engineering
Kothamangalam, Kerala, India
---***---Abstract - This project is a curious attempt to make anautomated resistor sorting machine that can function as a device for measuring and sorting the resistors that are used in laboratories with minimum human interference and increased accuracy. It appealed to us because we felt it would give us a chance to combine different fields of engineering: mechanical, electronics and computer. Essentially, herein, the concept voltage drop across a resistor is bootstrapped with the mechanical movements of servos to produce the required output. Our project provides two functions, namely- sorting and measuring of resistors which can be selected using an LCD screen and a mobile app. It accepts resistors, and sorts them into predefined bins or measures, displays the value and returns it to the user.
Key Words: Resistor, Servos, Voltage 1. INTRODUCTION
In this modern world, the use of electronic components and equipments has increased at an enormous rate. Electronic equipments have a significant role in every field from automobiles to agriculture. Resistors are inevitable components in every electronic equipment. Sorting can help to reduce the mess caused and make processes more time efficient. It keeps rooms clean and at the same time reduces human effort. As far as resistors are concerned, the smaller size makes it worse and convectional method of color code identification thus increases error. Thus, sorting and arranging the resistors in cabins automatically can increase efficiency. In addition to the sorting function we added the measuring option so that, students while engaging with their circuit projects in labs can make use of this to reduce error. It was seen that often students misunderstand red colour with brown colour and takes on average about 9-10 seconds to measure using colour codes.
2. LITERATURE SURVEY
2.1 Existing Technology and Intellectual Property
Most of the existing projects makes use of Digital Image processing techniques to determine the resistance value from colour code.
Arun Babu et al.,[1] in their paper, mentions that the image of the resistor is compared with the preloaded images by making use of digital image processing. Then the MATLAB
identify the resistor value and sends it back to the Microcontroller. On receiving the resistor value, the Arduino then controls the movement of lower conveyor belt carrying the boxes. The problem with such a mechanism is that, colour codes on longer usage fade away and can cause error in measurements.
The two patents US2468843, “Apparatus for electrically testing and classifying resistors” filed in 1945 and US3003630, “Apparatus for electrically testing and classifying resistors” filed in 1960 use a rotating resistor feed mechanism and basic sorting into compartments. The later patent expands on the first by adding functionality for sorting complex impedances. This functionality surpasses that of ours, but comes at the cost of increased system complexity. Both these projects are found to be very complex both in mechanical and electrical design. None of the patents utilizes a microcontroller-based auto ranging functionality such as our device, and moreover, the age of past patents means that they are no longer in force, given that it is well beyond 20 years from their filing date.
2.2 Applicable Standards
The IEEE Standard 118-1978, “For Resistance Measurement” [2] can be applied. This standard outline different approaches for measuring the resistance of a circuit component, based on that component’s approximate resistance and the precision of measurement desired. In particular, the standard outlines a number of bridge circuits that could be used for high precision measurement of resistors Since most lab resistors have 5% tolerance, a low precision approach is sufficient for this application.
2.3 Present Methods to Measure Resistance
Basically, the two methods conventionally used to measure the resistance are: 4 colour band system or using digital multimeter/ohmmeter.
International Research Journal of Engineering and Technology (IRJET)
e-ISSN: 2395-0056Volume: 06 Issue: 05 | May 2019 www.irjet.net p-ISSN: 2395-0072
© 2019, IRJET | Impact Factor value: 7.211 | ISO 9001:2008 Certified Journal | Page 7757
Industries Association. Coloured bands are marked on thesurface of the resistors at one end. Each colour represents a numeric value ranging from 0-9. The “left-hand” or the most significant coloured band is the band which is nearest to a connecting lead with the colour coded bands being read from left-to-right as follows:
Digit, Digit, Multiplier = Colour, Colour x 10 colour in Ohm’s (Ω)
For example, a resistor has the following coloured markings;
Yellow Violet Red = 4 7 2 = 4 7 x 102 = 4700Ω or 4.7k Ohm.
The fourth and fifth bands are used to determine the percentage tolerance of the resistor. Resistor tolerance is a measure of the resistor’s variation from the specified resistive value and is a consequence of the manufacturing process and is expressed as a percentage of its “nominal” or preferred value.
Brown = 1%, Red = 2%, Gold = 5%, Silver = 10 %
Multimeter is the modern form of ohmmeter. It has two probes which must be connected to the two leads of the resistor to be measured. Proper range must be set using the knob on the device.
Fig -1: Multimeter
2.4 Findings from Literature Review
After scouring through the literature available to our best knowledge, we found it worthwhile to keenly act on the following takeaways: resistor is an important component in all electronic circuits and, sorting and measuring them to the highest available accuracy is important for increased efficiency and keeping labs clean. All the existing methods are either complex or not accurate on long run. Also, it requires human intervention which is not practical when there are 100’s of resistors to be sorted. The most common method used by students to find the resistance values are using the code, ‘B.B. Roy of Great Britain Has a Very Good Wife’. But often the colours become very difficult to determine if the resistor has been overheated - for instance, yellow or red may appear as brown. Thus, it is prone to error.
3. METHODOLOGY
The resistor sorter can be segregated into four sections, although not entirely mutually exclusive, viz, Function choosing, Resistor reception, Measurement, Dispensing into required bins.
3.1 Process Flow
Chart -1 : Process Flowchart
STEP 1: The device start-ups and calibrates for 10 seconds verifying all the movements.
STEP 2: The LCD screen asks the user to select either SORT / MEASURE which can be selected using the mobile app and Bluetooth Module interfaced with the Microcontroller
STEP 3: If sort function is selected, the bin values can be set using the mobile application which will be correspondingly displayed on the LCD screen.
STEP 4: The device will then ask to insert the resistor in the slot by the movement of servo arms.
STEP 5: Measures the resistance and displays the value on LCD.
STEP 6: If the resistance value is in any of the already set bins, the bin rotates and the resistance is dispensed into the corresponding cabin. Else the resistance is dropped into the Bin 1. Go back to STEP 4.
STEP 7: If Measure function is selected, go to STEP 4, STEP 5.
STEP 8: Resistor is dropped into Bin 1. Go to STEP 7
3.2 Measurement Math
[image:2.595.310.558.193.363.2]International Research Journal of Engineering and Technology (IRJET)
e-ISSN: 2395-0056Volume: 06 Issue: 05 | May 2019 www.irjet.net p-ISSN: 2395-0072
[image:3.595.127.193.120.279.2]© 2019, IRJET | Impact Factor value: 7.211 | ISO 9001:2008 Certified Journal | Page 7758
Fig -2 : Measurement Circuit1. The voltage across the unknown resistance R2 is calculated as,
Vout = adc * (5 / 1023)
Here 5 is the reference voltage for the ADC and 1023 is 2n-1 where, n is the no of bits of ADC.
2. The current (i) across the resistor R1 is measured as,
i = (5v -Vout -0.6v ) / R1
Here the 0.6 is the forward drop voltage across the diode
3. Since the two resistors are connected in series current through them will be equal. Hence,
R2=Vout / i
Fig -3: Voltage Divider Network
It makes use of 5 different reference resistors namely, 100Ω, 1000Ω, 4.7kΩ, 10kΩ, 100kΩ. Usage of different resistors allows the measurement of resistances from 1Ω to 1MΩ with very little error.
Five different reference resistors are used because, if there is great difference between the reference resistance and the unknown, the result will be extremely inaccurate. This is because almost all of the input voltage will drop across the larger resistance and this provides very less information.
Suppose R1=10KΩ and R2=100Ω. Then the voltage across R1 will be 4.95 V and voltage across R2 will be 50mV and this gives less information. The sensitivity of the ATMega328 is 4.889mV. So, when we read 50 mV using the ATMega, ADC the result will be 10. Now, when converted into voltage the result will be 10 x 4.889mV =48.89mV. Then, Rx= 0.0488/((5V-48.89mV)/10000) = 98.7 Ω.
Suppose R1=10Ω and R2=220 Ω. Then the voltage across R1 will be 4.89V and voltage across R2 will be 107mV. The corresponding digital reading will be 21. When we convert it into voltage the result will be 21 x 4.889mV=102mV. Following the calculations used in the previous case, R2=208 Ω.
It is seen that using a reference resistor of 100Ω, resistances from 1Ω to 100Ω can be measured with least error. So, when the ADC value becomes greater than 512 the next reference resistor is chosen for measurement. For example, to measure 2.2kΩ, first A0 pin is made HIGH (5V) and 100Ω is connected to the 2.2kΩ. Since 2.2kΩ is greater than 100Ω (ADC value>512), A0 is made LOW and A1 is made HIGH. Now, as 2.2kΩ is again greater than 1kΩ the reference is again switched to 4.7kΩ and measurement is done. The following Fig 2.4.3 represents the same.
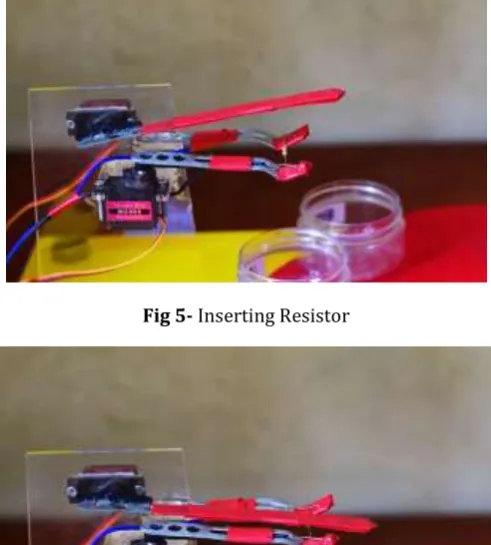
3.3 Resistor Insertion & Dispensing Mechanism
The resistor insertor mechanism make use of two servos and three steel plates. The servos can be named as upper and lower servos as marked in the figure, Fig 4. The angles for the upper servo are 168o and 180o. The plate of upper servo presses the resistor against the two wire leads enhancing the error free mechanism (Fig 6). The upper servo will remain at 168o position until the resistance measurement is complete. Once the measurement is done and value is displayed on the LCD screen, the bin servo rotates (in case of sorting) and the lower servo moves from 0o to 150o such that the resistor drops into the corresponding bin. (Fig 7)
[image:3.595.79.240.510.675.2] [image:3.595.312.558.629.748.2]International Research Journal of Engineering and Technology (IRJET)
e-ISSN: 2395-0056Volume: 06 Issue: 05 | May 2019 www.irjet.net p-ISSN: 2395-0072
[image:4.595.37.291.51.624.2]© 2019, IRJET | Impact Factor value: 7.211 | ISO 9001:2008 Certified Journal | Page 7759
Fig 5- Inserting Resistor [image:4.595.38.284.108.381.2]Fig 6 – Measurement Process
Fig 7 – Dispensing Mechanism
4. COMPONENTS USED
Various components used in the circuit design is discussed here in detail. The major components include microcontroller, LCD, Bluetooth Module, Servos, Diodes, Resistors, Capacitors and other passive components.
4.1 ATMega 328P
The high-performance Microchip 8-bit AVR RISC-based microcontroller combines 32KB ISP flash memory with read-while-write capabilities, 1KB EEPROM, 2KB SRAM, 23 general purpose I/O lines, 32 general purpose working registers, three flexible timer/counters with compare modes, internal and external interrupts, serial programmable USART, a byte-oriented 2-wire serial interface, SPI serial port, 6-channel 10-bit A/D converter (8-channels in TQFP and QFN/MLF packages), programmable watchdog timer with internal oscillator, and five software selectable power saving modes. The device operates between 1.8-5.5 volts.
4.2 LCD 16 x 2
A 16x2 LCD means it can display 16 characters per line and there are 2 such lines. In this LCD each character is displayed in 5x7 pixel matrix. This LCD has two registers, namely, Command and Data.The command register stores the command instructions given to the LCD. A command is an instruction given to LCD to do a predefined task like initializing it, clearing its screen, setting the cursor position, controlling display etc. The data register stores the data to be displayed on the LCD. The data is the ASCII value of the character to be displayed on the LCD.
Fig 8- LCD Display
4.3 Servo
[image:4.595.379.490.413.469.2]© 2019, IRJET | Impact Factor value: 7.211 | ISO 9001:2008 Certified Journal | Page 7760
Fig 9- Servo4.4 Bluetooth Module- HC 05
HC-05 is a Bluetooth module which is designed for wireless communication. This module can be used in a master or slave configuration. Bluetooth serial modules allow all serial enabled devices to communicate with each other using Bluetooth.
Fig 10- HC 05
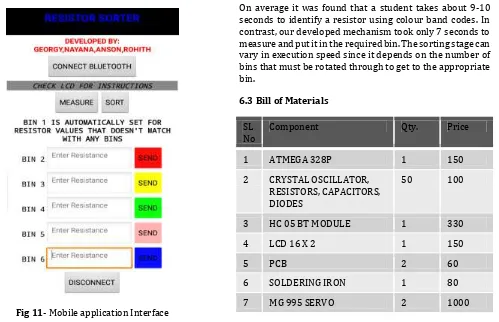
4.5 Mobile Application
[image:5.595.69.568.443.765.2]The mobile app for controlling the functions of the device was developed using MIT APP INVENTOR. The Bluetooth module was interfaced to both app and microcontroller. The user first connects HC05 BT Module using ‘CONNECT BLUETOOTH’ function in the application. Then, the user can select either SORT/ MEASURE function using appropriate button on the app. Instructions corresponding to the send commands will be displayed on the LCD screen.
Fig 11- Mobile application Interface
5. RESULT & OBSERVATIONS
The design and development of automatic resistor sorter for non-commercial utility was designed and completed. The results of measurement were analyzed with the standard values and output was verified.
5.1 Measured Resistances
The system was calibrated with almost all the standard resistances available in the lab and a safety range was set for each resistor so as to round of the value to the correct resistance value. For example, for 330Ω, if the measured value is anywhere between 320Ω and 340Ω, it will be shown as 330Ω. This change is accounted due to noise, small voltage drops etc. Some resistances and its measured values are:
Table 1- Measured resiatances
ORGINAL VALUE (in Ωs) MEASURED VALUE (in Ωs)
1 0.97
47 45.7
330 322
5600 5782
12k 11.7k
100k 99k
330k 331k
6.2 Excecution Time
On average it was found that a student takes about 9-10 seconds to identify a resistor using colour band codes. In contrast, our developed mechanism took only 7 seconds to measure and put it in the required bin. The sorting stage can vary in execution speed since it depends on the number of bins that must be rotated through to get to the appropriate bin.
6.3 Bill of Materials
SL
No Component Qty. Price
1 ATMEGA 328P 1 150
2 CRYSTAL OSCILLATOR, RESISTORS, CAPACITORS, DIODES
50 100
3 HC 05 BT MODULE 1 330
4 LCD 16 X 2 1 150
5 PCB 2 60
6 SOLDERING IRON 1 80
International Research Journal of Engineering and Technology (IRJET)
e-ISSN: 2395-0056Volume: 06 Issue: 05 | May 2019 www.irjet.net p-ISSN: 2395-0072
© 2019, IRJET | Impact Factor value: 7.211 | ISO 9001:2008 Certified Journal | Page 7761
8 MG 90S 2 600
9 DC ADAPTER 1 120
10 JUMPER WIRES, HEADERS 20 150
11 FAB LAB COST 600
12 TRAVEL 1500
13 MISCALLANEOUS 500
TOTAL 5340 /-
6.4 Challenges Faced
•The major challenge with the mechanical execution was that, often the resistor dropped fell out if the bin when the leads were too long. This was managed by using bins with wide mouths and positioning them accurately.
•Controlling MG995 was tedious task since it was a hi-torque device. It drew too much current while working which caused the microcontroller to reset randomly. The problem was solved by using a sperate power supply.
•Switching between reference resistors was first done using CD4066 IC. But IC offered an ON Resistance which caused errors in the value. It was solved by connecting resistors directly to pins and turning them HIGH, LOW.
•ADC values varied with time for same resistance due to unsettled values. It was made correct by using a delay function allowing the ADC readings to get settled.
•Developing android app was a difficult task since it was a new platform. Used MIT App inventor instead of Android Studio
6. CONCLUSION
The project was designed with an aim to increase the efficiency of students working with circuits in labs reducing the time required and error. Various problems were faced during the course of the project like resistor falling out of bins and achieving accuracy. All problems were solved to attain max speed and accuracy and the circuit was fabricated on a PCB board. As a future scope, this can be modified with automatic feeding mechanism consisting of a automatic lead straightening with a conevyor belt mechansim. The accuracy can be imporved by using a higher resolution ADC and a constant power supply for reference voltage.
REFERENCES
[1] Abin Thomas, Arun Babu, Prof. Raji “AUTOMATIC RESISTOR COLOUR CODING DETECTION & ALLOCATION”. International Journal for Electrical and Electronics Engineers. Volume No:1, ISSUE NO. 01
[2] IEEE Std 118-1978 “IEEE Standard Test Code for Resistance Measurement”
BIOGRAPHIES
Dr Jinsa Kuruvilla
Project Guide, Dept. of ECE, Mar Athanasius College of Engineering, Kothamangalam, India
Nayana Dileep
Student, ECE, Mar Athanasius
College of Engineering,
Kothamangalam, India
Student , ECE,
Rohith R
Student, ECE, Mar Athanasius
College of Engineering,
Kothamangalam, India
Anson Jose
Student, ECE, Mar Athanasius
College of Engineering,
Kothamangalam, India
Georgy Paul
Student, ECE, Mar Athanasius
College of Engineering,