Manuscript version: Author’s Accepted Manuscript
The version presented in WRAP is the author’s accepted manuscript and may differ from the
published version or Version of Record.
Persistent WRAP URL:
http://wrap.warwick.ac.uk/110273
How to cite:
Please refer to published version for the most recent bibliographic citation information.
If a published version is known of, the repository item page linked to above, will contain
details on accessing it.
Copyright and reuse:
The Warwick Research Archive Portal (WRAP) makes this work by researchers of the
University of Warwick available open access under the following conditions.
© 2018 Elsevier. Licensed under the Creative Commons
Attribution-NonCommercial-NoDerivatives 4.0 International
http://creativecommons.org/licenses/by-nc-nd/4.0/.
Publisher’s statement:
Please refer to the repository item page, publisher’s statement section, for further
information.
Evaluating Practitioner Cyber-Security Attack Graph
Configuration Preferences
Harjinder Singh Lallie, Kurt Debattista, Jay Bal
University of Warwick, WMG, Gibbets Hill Road, Coventry, CV4 7AL
Abstract
Attack graphs and attack trees are a popular method of mathematically and visually rep-resenting the sequence of events that lead to a successful cyber-attack. Despite their popu-larity, there is no standardised attack graph or attack tree visual syntax configuration, and more than seventy self-nominated attack graph and twenty attack tree configurations have been described in the literature - each of which presents attributes such as preconditions and exploits in a different way. This research proposes a practitioner-preferred attack graph visual syntax configuration which can be used to effectively present cyber-attacks.
Comprehensive data on participant (n=212) preferences was obtained through a choice based conjoint design in which participants scored attack graph configuration based on their visual syntax preferences. Data was obtained from multiple participant groups which included lecturers, students and industry practitioners with cyber-security specific or gen-eral computer science backgrounds.
The overall analysis recommends a winning representation with the following attributes. The flow of events is represented top-down as in a flow diagram - as opposed to a fault tree or attack tree where it is presented bottom-up,preconditions- the conditions required for a successful exploit, are represented as ellipses andexploitsare represented as rectan-gles. These results were consistent across the multiple groups and across scenarios which differed according to their attack complexity. The research tested a number of bottom-up approaches - similar to that used in attack trees. The bottom-up designs received the lowest practitioner preference score indicating that attack trees - which also utilise the bottom-up method, are not a preferred design amongst practitioners - when presented with an alterna-tive top-down design. Practitioner preferences are important for any method or framework to become accepted, and this is the first time that an attack modelling technique has been developed and tested for practitioner preferences.
Keywords: attack modelling, threat modelling, cyber-security, security usability, security visualisation
1. Introduction
Attack modelling techniques (AMTs) - such as attack trees, fault trees and attack graphs, are used to model cyber-attacks and visualise the sequence of events that lead to a success-ful attack. AMTs are constructed using a combination of shapes - such as circles, rectangles and ellipses, to represent cyber-attack constructs such as preconditions and exploits. This is referred to as the visual syntax (Moody, 2010), visual rhetoric (Scott, 1994) or visual gram-mar (Kress and Van Leeuwen, 1996). The visual syntax configuration of modelling systems such as fault trees (IEC, 1990) and Petri nets (Peterson, 1977) is standardised. This is not the case for attack graphs or attack trees, and authors use self-nominated graph configurations to model the attack, resulting in more than 70 different attack graph and more than 20 dif-ferent attack tree visual syntax configurations. Furthermore, there are very few empirical evaluations of the effectiveness of AMTs in aiding cyber-attack perception.
Email address:HL, K.Debattista, Jay.Bal}@warwick.ac.uk(Harjinder Singh Lallie, Kurt Debattista, Jay Bal)
The study found that the attack graph method was more effective than the fault tree method. This was particularly notable given that attack trees (which are based on the fault tree method) are a competing methodology for presenting cyber-attacks.
A number of studies have attempted to measure the effectiveness of AMTs (St˚alhane and Sindre, 2007; Opdahl and Sindre, 2009; Hogganvik and Stølen, 2007). However, these studies reveal a number of research gaps which the present study attempts to address re-lating to the AMT coverage, statistical significance, and the importance of grounding such studies with firm pedagogic underpinnings. The study by Lallie et al. (2018) was the first to investigate the effectiveness of attack graphs in aiding cyber-attack perception by under-taking a subjective evaluation of attack graphs and fault trees to determine which method was more effective in aiding cyber-attack perception. In the first study, ‘effectiveness’ was defined as the ability of a participant to respond correctly to a question requiring the in-terpretation of the visual syntax of a given AMT. This demonstrated an awareness of how attacks are perpetrated and an understanding of the attack modelling technique.
The study also outlined the need for further research and in particular to identify what further visual syntax improvements could be made to the attack graph method to increase visual congruency and yield better perceptive acceptance amongst cyber security practi-tioners.
The present research is motivated by the need to make cyber-security more ‘usable’ and the recognition that better techniques and methods are required to aid the perception and assessment of cyber-attacks. Quite often, observers find the analysis and understanding of complex patterns difficult and challenging (Kasemsri, 2006; Staheli et al., 2014). Well designed diagrams and graphical systems can aid this process (Moody, 2007; Kang et al., 2015). AMTs have potential value in aiding the perception and assessment of cyber-threat and attack by enabling observers to search and recognise relevant information in a dia-gram (Keller and Tergan, 2005; Homer et al., 2008; Dondossola et al., 2011; Staheli et al., 2014). AMTs can help remove the intellectual burden from security experts - who have to understand and evaluate numerous potential options and make evaluations of cyber-attack scenario likelihoods (Roschke et al., 2011). In such circumstances, AMTs provide effective tools and workspaces (Fink et al., 2009) to make this process clearer and simpler and thereby facilitate easier discussion and debate (Dondossola et al., 2011).
The present study considers the following research question: ‘to what extent does symbol usage and event flow in attack graphs affect perceptive preference in participants?’ The research question is answered through a conjoint study which attempts to understand whether prac-titioners prefer a particular visual syntax configuration over another and therein to identify an optimal attack graph configuration design.
The study makes the following two contributions. To the best of the authors’ knowl-edge, this is the first study to perform an evaluation of the effectiveness of attack graph configurations. The study adopts a novel method - conjoint analysis, not used in such eval-uations before, in order to measure participant preferences.
The rest of this paper is structured as follows. Section 2 begins by outlining the the-ory of attack graphs before proceeding to explore and critique previous research into the effectiveness of AMTs. The Section concludes by introducing the application of conjoint analysis to the understanding of participant preferences. Section 3 outlines the design of the study and in particular, the conjoint design used in the present study. Section 4 presents the results of the study.
2. Background and Related Studies
This section outlines three key areas of background research namely: attack graphs and attack modelling techniques, previous studies into the evaluation and comparison of attack modelling techniques and conjoint design and its’ application in previous studies.
2.1. Attack Graphs
Update interrupted by malicious ISO
System updated remote access
achieved ISO verified Target system is
version 14.05.03
Update firmware
System allows Preupdate USB
removal Firmware
update through USB
Target accepts USB updates Target is less
[image:4.595.208.403.72.308.2]than version 14.05.03
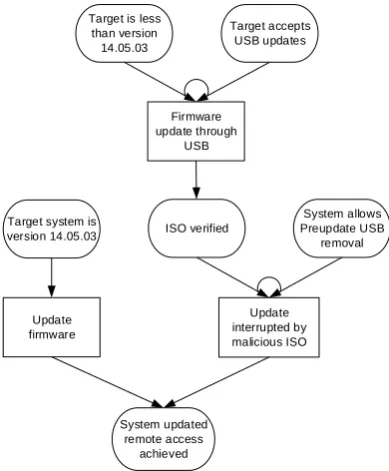
Figure 1– Sample Attack Graph
symbolic modes of expression to visualise one or more of the threefundamental cyber-attack constructswhich are: the preconditions/postconditions of a cyber-attack; exploits; and pre-condition logic. This is referred to herein as thevisual syntax configuration. Examples of these are given in Figure 1 where a precondition is represented as a rectangle, an exploit as an ellipse and precondition logic by the presence or absence of an arc connecting two edges.
Attack graphs and attack trees are both variants of a graph based representation of a cyber-attack. Graph based representations are generally divided into two broad research groupings: the attack graph and the attack tree groups, and there is a notable divide be-tween research papers that focus on the description and analysis of one or the other with barely even an acknowledgement of the existence and application of the other.
However, this paper takes the view that essentially, attack graphs and attack trees (and their variants) can be described in generic graph based terms which apply to both, and that other than the representation of event flow as top-down in attack graphs and bottom-up in attack trees, there are very few differences between the two.
For example, the only difference between the attack graph proposed by Li et al. (2006) and the threat tree (a form of attack tree) by Marback et al. (2013) is that the event flows top-down in the former and bottom-up in the latter. The same applies to the attack graphs by Bhattacharya et al. (2008) and Sen and Madria (2017), and the attack trees by Tentilucci et al. (2015), Buoni et al. (2010) and Espedalen (2007). There are numerous further examples, and consequently, this paper focuses on attack graphs in general having recognised that the visual syntax problem described herein apply to both.
An attack graph can be represented as a mathematical abstraction of attack paths that might be perpetrated against a given system (Sawilla and Ou, 2007; Nanda and Deo, 2007). The graph comprises of nodes which represent exploits/attacks/events and edges which represent a change of status.
The nodes in the graph can represent a range of elements such as an exploit (Noel et al., 2004; Bhattacharya et al., 2008; Alhomidi et al., 2012), an event (Cheung et al., 2003; Aguessy, 2016; Sundaramurthy et al., 2011) or a status (Heberlein et al., 2012; Dacier et al., 1996; Ortalo et al., 1999).
Edges in an attack graph can be directed - to represent specific transitions, or undi-rected - to represent a general connection between two nodes and generally represent the perpetration of an exploit.
Attack graphs and fault trees comprise of two fundamental elements represented as graph data structures of the form: G(V;E)which comprises of vertices: v ∈ Vand edges:
e∈Ewhich represent relationships between the vertices (Jha et al., 2002b). An attack graph can be expressed as a tuple of the formG= (S,τ,S0,Ss,L,E)where:
• Sis a finite set of states,
• τ⊆S×Sis a transition relation
• S0⊆Sis a set of initial states
• Ss ⊆ Sis a set of success states – for example obtaining root or user privileges on a particular host
• L:S→2APis a labelling of states with a set of atomic propositions (AP) • E is a finite set of exploits which connect the transition between two states
The definition outlined above by Jha et al. can be applied to most attack modelling systems including attack trees and fault trees.
Although attack graphs are a popular method of representing and modelling cyber-attacks, other than the study by Lallie et al. (2018), there is a dearth of research on under-standing the effectiveness of attack graphs in aiding cyber-attack perception.
2.2. Previous AMT Comparison Studies
Previous research into the effectiveness of AMTs has considered the effectiveness of misuse cases (Mæhre, 2005), misuse case maps (Karpati et al., 2010, 2011), attack trees (Fl˚aten and Lund, 2014) and the CORAS language (Hogganvik and Stølen, 2005, 2006, 2007). Studies have also engaged in comparing techniques such as the Common Crite-ria, misuse cases and attack trees (Diallo et al., 2006); DREAD, NIST SP800-30, OCTAVE-S and CORAS (Buyens et al., 2007); misuse case and FMEA (St˚alhane and Sindre, 2007); at-tack trees and misuse cases (Opdahl and Sindre, 2009); and misuse case maps and misuse sequence diagrams (Katta et al., 2010). An overview of research in this domain is provided in Table 1.
The studies highlighted in Table 1 attempt to measure the effectiveness of the AMT, some also attempt to understand user perceptions of the technique i.e. to understand user preferences for the given technique (Mæhre, 2005; St˚alhane and Sindre, 2007; Opdahl and Sindre, 2009; Karpati et al., 2010, 2011; Katta et al., 2010).
A considerable body of research has shown that user acceptance of a framework or method is vital if it is to be successful (Dillon and Morris, 1996; Moody, 2003; Buabeng-Andoh, 2012). The studies by Opdahl and Sindre (2009); Karpati et al. (2010) and Katta et al. (2010) demonstrate that there may not always be a correlation between user acceptance and effectiveness of the technique.
The studies outlined in Table 1 make a useful contribution to understanding the effec-tiveness of AMTs, however, there exist a number of research gaps relating to: AMT cover-age; statistical significance; insufficient grounding of variables; and conceptual differences in the AMTs being compared. Furthermore, few if any of these studies have attempted to understand ‘why’ participants prefer one method over another.
AMT coverage. There are no known studies that have attempted to understand the
ef-fectiveness of attack graphs in aiding cyber-attack perception in comparison with other techniques. Although there are conceptual similarities in the visual syntax of attack trees and attack graphs, only three of the studies under review considered attack trees (Diallo et al., 2006; Opdahl and Sindre, 2009; Fl˚aten and Lund, 2014).
The study by Diallo et al. (2006) and Opdahl and Sindre (2009) compared conceptually different visual structures - common criteria method, misuse cases and attack trees; and misuse cases attack trees respectively. This can be problematic because the differences in the syntax being compared may be so different so as to render wide raising opinions.
Table 1– Previous AMT comparison studies
AMT Description of Study Effectiveness Measurement n pref1 Citation
Misuse cases Effectiveness of AMT and practitioner perceptions Case study with observations 10 i Mæhre (2005)
The Common Criteria, mis-use cases and attack trees
High level analysis of the ‘learnability, usability, solution inclusive-ness, clarity of output, and analyzability’ of AMTs
Self-observation/critical evaluation 2 Diallo et al. (2006)
DREAD, NIST SP800-30, OCTAVE-S and CORAS
Which AMT ‘performs best’ Observational. Completion of a risk reduction
exer-cise using the four techniques
1 Buyens et al. (2007)
Misuse case and FMEA Comparison of techniques for ability to identify user related
fail-ures
80 minute task to analyse scenarios and identify fail-ures
42 TAM St˚alhane and
Sin-dre (2007)
Attack trees and misuse cases
Comparison of techniques in aiding practitioner perception in threat identification
2x90 minute controlled experiments to measure per-formance and perception
n=28 and n=352
TAM Opdahl and Sindre
(2009)
Misuse case maps Effectiveness in aiding non-expert stakeholders develop an
under-standing of multi-stage intrusions
Questionnaire response 12 TAM Karpati et al. (2010)
Misuse case maps Effectiveness in aiding observers find vulnerabilities and
mitiga-tions
Controlled experiment/test to solve series of tasks and self-reported TAM score
33 TAM Karpati et al. (2011)
Attack trees Suitability for modelling cyber-threat and in aiding experts
under-stand threat
Qualitative interview 2 Fl˚aten and Lund
(2014) Misuse case maps and
mis-use sequence diagrams
Comparison of techniques for understanding, performance and perception
90 minute task comprising of T/F questions (under-standing), identifying/listing vulnerabilities (perfor-mance)
42 TAM Katta et al. (2010)
CORAS The effect of visual syntax on understanding a risk scenario using
theCORAS language
Questions relating to model navigation and under-standing of concepts
25 Hogganvik and
Stølen (2005)
CORAS What is the preferred method of visualising vulnerabilities and
vi-sualising risk? comparison of the UML profile and the standard UML use case icons
Survey comparing alternative representations of risk scenarios
33 Hogganvik and
Stølen (2006)
CORAS An empirical investigation of risk modeling preferences among
professionals and students to improve
Questionnaire emailed to participants to make selec-tion between modelling alternatives
33 Hogganvik and
Stølen (2007)
1pref: Preference/acceptance testing method.i=interview;TAM=Technology Acceptance Model (Davis, 1985) 22 separate experiments
The studies by Mæhre (2005); Diallo et al. (2006); Hogganvik and Stølen (2006, 2007); Buyens et al. (2007), and Fl˚aten and Lund (2014) outline the need to ground the selection and design of AMT attributes with firm pedagogic underpinning. Quite often, there is little or no rationale provided as to why particular design decisions were made. For example, Hogganvik and Stølen ‘borrowed’ theandoperator from the fault tree methodology in or-der to remain ‘fault tree compliant’. However, the motivation behind maintaining fault tree compliance is not explained, no other syntax is borrowed from fault trees.
Chaufette and Haag (2007) use rectangles, rounded rectangles and hexagons to repre-sent preconditions interchangeably, however their usage is neither justified or explained. This problem applies to most attack graph and attack tree based visual representations.
2.3. Conjoint Design
The research methods outlined in Table 1 range from observational studies (Mæhre, 2005; Diallo et al., 2006; Buyens et al., 2007), participant tasks (St˚alhane and Sindre, 2007; Opdahl and Sindre, 2009; Karpati et al., 2011; Katta et al., 2010), questionnaires (Karpati et al., 2010; Hogganvik and Stølen, 2006, 2007) and interviews (Fl˚aten and Lund, 2014). User perception of AMTs is typically reported through an interview (Mæhre, 2005) or a questionnaire based on TAM (Technology Acceptance Model) (St˚alhane and Sindre, 2007; Opdahl and Sindre, 2009; Karpati et al., 2010, 2011; Katta et al., 2010). TAM examines the causal links between behavioural attitudes and intentions to use technology (Dauda and Lee, 2015).
An alternative novel method of measuring user preference is through a conjoint design. Conjoint analysis is a form of discreet choice research which allows for a measurement to be made of population preferences and for preferences to be weighted in terms of the value held by the population for particular attributes that influence the preferences. Conjoint analysis can provide an indication of the trade offs that a population is willing to make between the attributes.
Conjoint analysis is based on the theory of welfare economics (Phillips et al., 2002) which proposes that users - when presented with a choice of options, will prefer one choice over another in an attempt to maximise utility. This makes it reasonably straightforward to model preferences and interrelationships. Conjoint analysis better represents realistic tradeoff based decision-making in comparison with typical attitudinal surveys which typ-ically do not impose resource constraints.
Participants are required to consider competing scenarios - each of which contain all or a subset of the attributes under review and outline scenario preferences. Conjoint analysis measures and quantifies the contribution of individual attributes within a configuration as well as the entire configuration itself and attribute combination contribution.
3. Methodology
The present study seeks to understand the extent to which visual syntax elements such as symbol usage, symbol count and event flow affect perceptive preference amongst par-ticipants.
The study utilises a within-participant design comprising of five independent variables (iv):background (b),event flow (ef), precondition (pr), exploit (ex), andscenario (sc).
Thebackground ivis a between-participants variable which is divided into seven groups. These groups are:
a. Final year/MSc/PhD students - subdivided into those studying cyber-security (cybstd, n=66) and general computer science/IT (cmpstd, n=27).
b. Lecturers whose teaching focuses largely on cyber-security (cyblec, n=17) and those that focus on teaching computer science/IT (cmplec, n=14)
c. Practitioners who have decision making/consultancy/management responsibilities (cybman, n=34) and those who work in the cyber-security industry and have responsi-bility for analysing cyber-attacks (cybprc, n=20)
3.1. Attribute and Attribute Level Design
The proposed attack graph design contains three ‘attributes’ -event flow,preconditionand exploit. These attributes were previously described in Lallie et al. (2018). Each attribute has a number of ‘levels’ which correspond to the visual syntax used to represent the attribute.
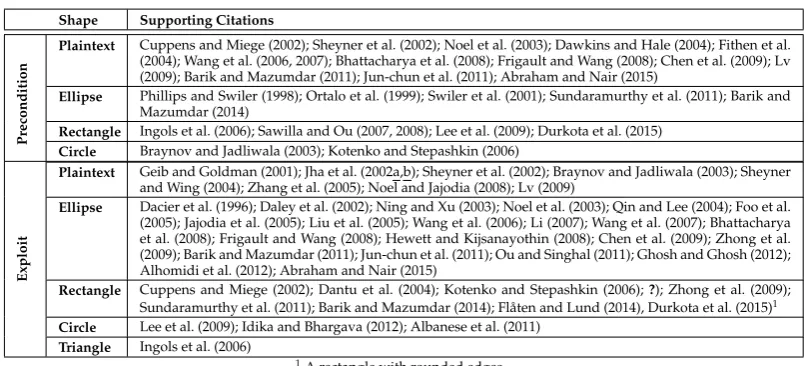
The attribute levels were determined through a systematic literature review of more than 370 academic papers on the subject of attack graphs and attack trees. Popular attribute configuration methods are shown in Table 2. Although the table presents a review of the use of shapes in attack graph visual syntax, the same shapes have also been used in attack trees.
The attack graph design methodology was designed in accordance with the‘Physics of
Notations’diagram design methodology proposed by Moody (2010). The‘Physics of
Nota-tions’are a set of nine evidence based principles drawn from various disciplines
includ-ing: cognitive psychology, perceptual psychology, communication theory and cartography. These principles form the guidelines for ‘effective diagrams’ and outline how shapes, lines, colour and other diagrammatic variables (Bertin, 1983) should be manipulated to enable better cognitive perception.
The representation of preconditions and exploits using plaintext, ellipse, rectangle, tri-angles and circle are popular forms of representation. Of these, the circle and triangle were rejected because they were the least frequently used - possibly because of the difficulty in framing textual attack descriptions within these shapes as opposed to an ellipse and rect-angle. The selected attribute levels therefore are plaintext, ellipse and rectrect-angle.
Ellipses and rectangles are also used in other system modelling methods such as flow charts, data flow diagrams, fault trees, attack trees, use-case modelling (Jacobson, 2011), DRAKON charts (Parondzhanov, 1995) and UML activity diagrams.
The corresponding attributes and levels (ivs) are:
Event flow (e f). Thee f attribute represents the direction of information flow. This at-tribute is divided into two levels, top-down (e ft) - as used in flow charts and attack graphs, or bottom-up (e fb) as used in fault trees and attack trees.
Exploit (ex).Theexattribute corresponds to the configuration of shapes used to repre-sent exploits. This attribute has three levels:ellipse(exe),rectangle(exr) andplaintext(exp).
[image:8.595.106.512.520.703.2]Precondition (pr).The prattribute corresponds to the configuration of shapes used to represent preconditions. This attribute is divided into three levels: ellipse (pre),rectangle (prr) andplaintext(prp).
Table 2– A survey of cyber-attack construct visual syntax in attack graphs
Shape Supporting Citations
Precondition
Plaintext Cuppens and Miege (2002); Sheyner et al. (2002); Noel et al. (2003); Dawkins and Hale (2004); Fithen et al. (2004); Wang et al. (2006, 2007); Bhattacharya et al. (2008); Frigault and Wang (2008); Chen et al. (2009); Lv (2009); Barik and Mazumdar (2011); Jun-chun et al. (2011); Abraham and Nair (2015)
Ellipse Phillips and Swiler (1998); Ortalo et al. (1999); Swiler et al. (2001); Sundaramurthy et al. (2011); Barik and Mazumdar (2014)
Rectangle Ingols et al. (2006); Sawilla and Ou (2007, 2008); Lee et al. (2009); Durkota et al. (2015)
Circle Braynov and Jadliwala (2003); Kotenko and Stepashkin (2006)
Exploit
Plaintext Geib and Goldman (2001); Jha et al. (2002a,b); Sheyner et al. (2002); Braynov and Jadliwala (2003); Sheyner and Wing (2004); Zhang et al. (2005); Noel and Jajodia (2008); Lv (2009)
Ellipse Dacier et al. (1996); Daley et al. (2002); Ning and Xu (2003); Noel et al. (2003); Qin and Lee (2004); Foo et al. (2005); Jajodia et al. (2005); Liu et al. (2005); Wang et al. (2006); Li (2007); Wang et al. (2007); Bhattacharya et al. (2008); Frigault and Wang (2008); Hewett and Kijsanayothin (2008); Chen et al. (2009); Zhong et al. (2009); Barik and Mazumdar (2011); Jun-chun et al. (2011); Ou and Singhal (2011); Ghosh and Ghosh (2012); Alhomidi et al. (2012); Abraham and Nair (2015)
Rectangle Cuppens and Miege (2002); Dantu et al. (2004); Kotenko and Stepashkin (2006);?); Zhong et al. (2009); Sundaramurthy et al. (2011); Barik and Mazumdar (2014); Fl˚aten and Lund (2014), Durkota et al. (2015)1
Circle Lee et al. (2009); Idika and Bhargava (2012); Albanese et al. (2011)
Triangle Ingols et al. (2006)
1A rectangle with rounded edges
Update interrupted by malicious ISO System updated remote access achieved ISO verified Target system is
version 14.05.03 Update firmware System allows Preupdate USB removal Firmware update through USB Target accepts USB updates Target is less
than version 14.05.03
LNK vulnerability
Code on USB executed
Target is any Windows up to including Windows 7 Target can run
autorun.inf
Install mrxcls.sys Target is
vulnerable
Host Ready for Infection Nuclear Subterfuge Compromised SMB vulnerability exploited, malware sent to target
Spool Server Vulnerability
Copy malware to%System%\ winsta.exe Send files as print jobs
File and Print sharing is turned
on Stuxnet self installed BlackEnergy malware (BE3) installed Office macros activated Inadequate malware protection BlackEnergy3 (BE3) installer file accessed Harvest ICS VPN credentials & log in
UPS Machine Interface panel accessible
Reconfigure to shut down at time of attack
UPS shutdown
Serial to ethernet gateways accessible Install Malicious/ faulty firmware Critical system data destroyed Install Killdisk and wipe host
[image:9.595.114.502.98.232.2]ICS control centre connection destroyed MS Office vulnerability (CVE-2014-4114) Connect with C&C servers Receive C&C commands MS Internet Explorer pre-installed Modified internet registry settings
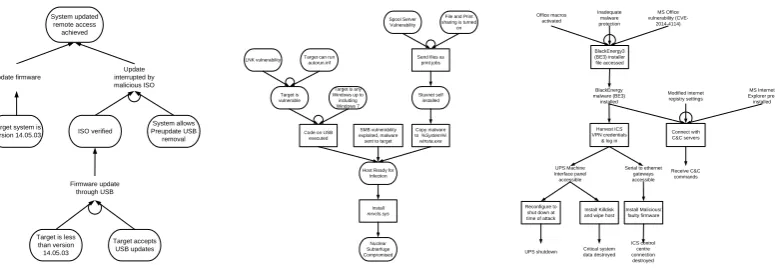
Figure 2– Example Scenarios:e fb,pre,exp(left),e ft,pre,exr(middle),e ft,prp,exr(right)
Scenarios (sc).
Three real cyber-attacks:sc1:Jeep Cherokee attack(Valasek and Miller, 2015),sc2:Stuxnet attack (Falliere et al., 2011; Langner, 2011) and the sc3: Ukranian powersupply attack(Lee et al., 2016; ICS-CERT, 2016), were each modelled into the nine attack graph configurations outlined in Table 3. These scenarios were selected because they are real attacks and experi-enced participants are likely to be familiar with them.
3.2. Materials
Each attack graph scenario was generated using thecyber-attack graph generator CAGG tool - a purpose written tool which synthesises anattack definition file and anattack graph configuration fileto produce an attack graph. Both files are configured as an XML schema. Theattack definition filestores the attack sequence with the preconditions, exploits, and any associated precondition logic. The attack graph configuration file stores the visual syntax definition - indicating the symbols to be used for each construct.
The screen configuration was a sensitive task. It was important that participants see all 9 graphs on a single screen to enable them to compare scenarios and scores. However, each graph was too large to be visually meaningful to enable all 9 graphs to appear on the same screen. Consequently, thumbnails were added for each configuration, each thumbnail pre-sented a full-sized graph when selected. A sample screen is shown in the supplementary materials (Section 5.1).
Scenarios within the three screens were randomised. Each question on each screen was based around the same cyber-attack case study. All participants were presented with the same scenarios in the same order. Participants were not allowed to revisit screens, and all participants were asked the same questions in the same sequence. Collectively, these formed thecontrol variables (cv).
The participants were selected because they have a computing background and were expected to have some experience of system modelling techniques such as flow charts and state diagrams. Such participants are likely to relate to and easily understand the attack graph method. The results of the study are analysed for the entire group (all) and the in-dividual groups as outlined above. This research somewhat extends the contribution by Caire et al. (2013) and El Kouhen et al. (2015) who challenge the conventional approach of ‘design by committee’. Caire et al. (2013) showed that novice users propose symbol sets that are more semantically transparent when compared with experts. In their study, novice users generated the symbols, chose between them and evaluated their comprehensibility. Caire et al. (2013) cite the example of BPMN 2.0 which although intended for communicat-ing with business stakeholders was not designed with any involvement with the intended audience. In the present study, while the initial 9 designs were proposed by the authors, prospective end-users selected from these.
3.3. Configuration Design
The complete attribute is a 2(e f)×3(pr)×3(ex)full factorial design rendering 18 con-figurations. Ordinarily, 18 configurations could be tested as a full factorial design. How-ever, the study intends to measure participant response to different levels of cyber-attack complexity represented as three scenarios: sc1,sc2 andsc3(described in Section 3.2) so as to understand whether preferences change according to scenario complexity. So,sc1has fewer icons in the attack sequence, andsc3has many more icons in the attack sequence.
The complete attribute set is a 2(e f)×3(pr)×3(ex)×3(s) full factorial design ren-dering 54 configurations. This is too many configurations for one participant to score. A selection of these configurations can be evaluated through a fractional factorial design the results of which are analysed using conjoint analysis. A fractional factorial design enables the researcher to pre-generate a sufficient smaller number of configurations (referred to as a ‘plan’) without compromising the main effects of attributes.
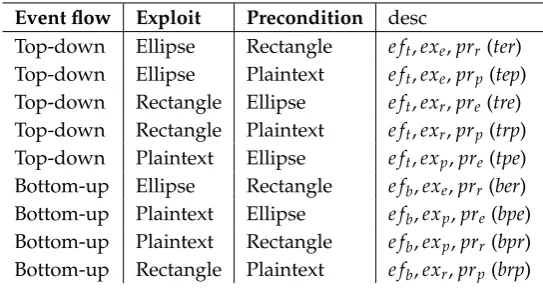
A self-generated plan comprising of 9 cards was designed according to the guidelines proposed by Huber and Zwerina (1996). The design is outlined in Table 3 and can be described in the form:e f :ex:pr. So,e ft,exe,prrcan be shortened toter.
The present study requires participants to score each representation out of 10. This enables richer empirical insights into the practitioner preferences.
3.4. Calculating Preferences
The study uses three dependant variables: overall graph utility score (u), attribute part worth score (pw) and attribute importance value (aiv).
Ordinary least squares (OLS) regression analysis was used to estimate regression coef-ficients corresponding to thepart worth scores(pw) for each attribute level and therelative importance valueof each attribute (aiv). The dependent variable is the participant score for a configuration and the independent variables are the differences in levels for each attribute. pwwas calculated using the inbuilt conjoint feature in SPSS (Dohle et al., 2010; Wallquist et al., 2012; Farley et al., 2013; IBM DeveloperWorks, 2016). This is a standard method for calculating part-worth for each level and the relative importance value of attributes (Mes´ıas et al., 2011). This model assumes that the preference expressed by a participant is the aggregate of part-worth scores for the individual attributes. This can be described as:
pw
=
β
0+
β
1X
1+
β
2X
2+
β
3X
3+
e
(1)
Whereβ0is the intercept,β1β2andβ3are the coefficients corresponding with the levels (e f =0, 1,ex=0, 1, 2,pr=0, 1, 2),X1,X2andX3are the attributese f,exandprrespectively andeis the error term.
[image:10.595.170.442.607.751.2]The attribute importance value (aiv) is calculated by taking the part worth utility range for each attribute (highest score minus the lowest score), dividing this by the sum of the part worth utility range for all attributes and multiplying by 100 to give a percentage (Dohle
Table 3– plan & attribute design
Event flow Exploit Precondition desc
Top-down Ellipse Rectangle e ft,exe,prr (ter) Top-down Ellipse Plaintext e ft,exe,prp(tep) Top-down Rectangle Ellipse e ft,exr,pre(tre) Top-down Rectangle Plaintext e ft,exr,prp(trp) Top-down Plaintext Ellipse e ft,exp,pre(tpe) Bottom-up Ellipse Rectangle e fb,exe,prr(ber) Bottom-up Plaintext Ellipse e fb,exp,pre(bpe) Bottom-up Plaintext Rectangle e fb,exp,prr(bpr) Bottom-up Rectangle Plaintext e fb,exr,prp(brp)
et al., 2010; Pullman et al., 2012). The attribute importance value provides an indication of individual attributes considered to be important by participants. However, it should be noted that although an attribute can be important, it may not necessarily have a determin-ing effect on winndetermin-ing configurations.
Thetotal utility(u) for an attack graph is determined as follows:
u
=
β
e f+
β
ex+
β
pr+
µ
(2)
whereβis an individual part worth score (calculated in Eq 1) andµis the constant term
of the conjoint estimation.
Conjoint analysis is subject to a number of limitations - particularly relating to partic-ipant fatigue due to complexity; particpartic-ipants simplification strategies where the configu-ration presents limited choices which do not represent real behaviour (Wyner, 1992); and codifying subjective inputs.
The first two problems were addressed within the design itself. The fractional factorial design reduces the number of configurations that participants need to respond to from a potential 54 down to 27 - thereby enabling responders to focus on the response itself. The decision to use a rating scale - where participants were able to provide a score of 1 to 10, as opposed to pairwise comparisons reduces the likelihood of participants adopting a simplification strategy. The problem of codifying subjective inputs was addressed through a design validation using dummy data which simulated numerous combinations of first, second, seventh and eighth preferences. The equations outlined in Eq:(1) and Eq:(2) were applied to show that the plan was effective.
4. Results
Thehomogeneity of variancesfor all the levels (p >0.05) implied little evidence that the variances between the levels were unequal and the homogeneity of variance assumption was therefore satisfied.
A Kendall’s tau correlation was run to determine the relationship between rank order preferences amongst the participants. There was a statistically strong, positive correlation between the scores (Kτ=0.919,p=0.000). Similarly a Pearson’srdata correlation revealed
a statistically strong positive correlation between the variables (r=0.991,p<0.01).
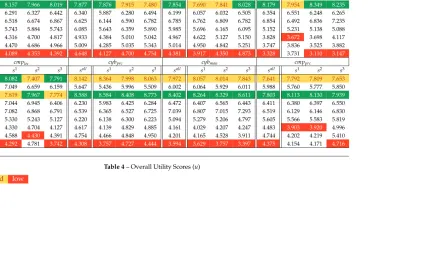
4.1. Identifying Preferred Configurations
The overall utility scores (u) are presented in Table 4 which presents the combined over-all utility score (all) and subdivides the results for each of the 7 groups. The Table also sub-divides the results by scenario and presents the overall utility score for each attack graph configuration. The Table particularly highlights the winning configuration for each of these subdivisions and also the second most preferred configuration as well as the least preferred configuration.
The winning graph configuration for theallgroup and each individual group wastre (u=8.042). This configuration is presented in Figure 2 (middle) and has the following at-tributes: event flowis top-down,exploitsare represented as rectangles andpreconditionsas ellipses.
The winning configuration was followed by teras the second most preferred config-uration for theallgroup (u=7.861) and the individual groups. This configuration has the following attributes:event flowis top-down,exploitsare represented as ellipses and precondi-tionsas rectangles. It is notable that neither of the top two configurations contain plaintext as an attribute.
trewas the preferred configuration for all the scenarios (sc1...sc3) for theallgroup, and for 17 out of the 24 individual group scenarios. terwas the preferred configuration for the following scenarios: sc1:cmp
std, cyblec andcmplec;sc2:cybstdandcmpstd;sc3:cybstd and
all cybstd cmpstd cyblec
sall s1 s2 s3 sall s1 s2 s3 sall s1 s2 s3 sall s1 s2 s3
ter 7.861 7.945 7.858 7.793 7.777 7.403 7.939 7.630 7.803 7.836 7.847 7.727 8.178 8.051 8.276 8.206
tep 6.082 5.925 6.233 6.067 6.164 5.513 6.279 6.343 6.101 5.875 6.323 6.103 6.434 6.484 6.348 6.471
tre 8.042 8.157 7.966 8.019 7.877 7.876 7.915 7.480 7.854 7.690 7.841 8.028 8.179 7.954 8.349 8.235
trp 6.359 6.291 6.327 6.442 6.340 5.887 6.280 6.494 6.199 6.057 6.032 6.505 6.354 6.551 6.248 6.265
tpe 6.690 6.518 6.674 6.867 6.625 6.144 6.590 6.782 6.785 6.762 6.809 6.782 6.854 6.492 6.836 7.235
ber 5.799 5.743 5.884 5.743 6.085 5.643 6.359 5.890 5.985 5.696 6.165 6.095 5.152 5.231 5.138 5.088
bpe 4.628 4.316 4.700 4.817 4.933 4.384 5.010 5.042 4.967 4.622 5.127 5.150 3.828 3.672 3.698 4.117
bpr 4.724 4.470 4.686 4.966 5.009 4.285 5.035 5.343 5.014 4.950 4.842 5.251 3.747 3.836 3.525 3.882
brp 4.297 4.089 4.353 4.392 4.648 4.127 4.700 4.754 4.381 3.917 4.350 4.873 3.328 3.731 3.110 3.147
cmplec cybprc cybman cmpprc
sall s1 s2 s3 sall s1 s2 s3 sall s1 s2 s3 sall s1 s2 s3
ter 7.682 8.082 7.407 7.791 8.142 8.364 7.998 8.063 7.972 8.057 8.014 7.843 7.641 7.792 7.809 7.653
tep 6.625 7.049 6.659 6.159 5.647 5.436 5.996 5.509 6.002 6.064 5.929 6.011 5.988 5.760 5.777 5.850
tre 7.768 7.819 7.967 7.774 8.588 8.584 8.408 8.773 8.402 8.264 8.329 8.611 7.803 8.113 8.130 7.939
trp 6.788 7.044 6.945 6.406 6.230 5.983 6.425 6.284 6.472 6.407 6.565 6.443 6.411 6.380 6.397 6.550
tpe 6.896 7.082 6.868 6.791 6.539 6.365 6.527 6.725 7.039 6.807 7.015 7.293 6.519 6.129 6.146 6.830
ber 5.336 5.330 5.243 5.127 6.220 6.138 6.300 6.223 5.094 5.279 5.206 4.797 5.605 5.566 5.583 5.819
bpe 4.550 4.330 4.704 4.127 4.617 4.139 4.829 4.885 4.161 4.029 4.207 4.247 4.483 3.903 3.920 4.996
bpr 4.627 4.588 4.430 4.391 4.754 4.466 4.848 4.950 4.201 4.165 4.528 3.911 4.744 4.202 4.219 5.410
[image:12.595.152.711.109.369.2]brp 4.442 4.292 4.781 3.742 4.308 3.757 4.727 4.444 3.594 3.629 3.757 3.397 4.375 4.154 4.171 4.716
Table 4– Overall Utility Scores (u)
The least favoured configuration for theallgroup and each individual group wasbrp (u=4.297) which has the following attributes: event flow is bottom-up,exploits are repre-sented as rectangles andpreconditionsas plaintext.
The least preferred configuration for each scenario in theallgroup and for 20 out of the 24 individual group scenarios isbrp. For the remaining 4 individual group scenarios, the least preferred scenarios arebpefor:sc1:cyblec,cmpprcandsc3:cmpprc; andbprfor:sc2:cmplec. It is notable that the bottom four configurations for all groups except cybprc feature the attributee fb.
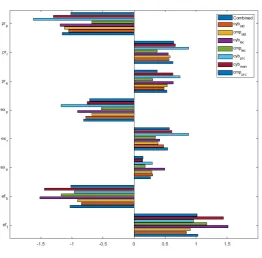
4.2. Part Worth Results
The part worth results outline the utility value of individual attributes and their levels. These results are presented in Table 6 and Figure 3.
The part worth utility score foref (pw :e f) for theallgroup indicated thate ftwas the preferred attribute level for event flow (pw : e ft = 1.031). pw : exandpw : prindicated that plaintext is not a preferred attribute level for representing exploits or preconditions (pw : exp = −0.809,pw : prp = −1.154). pw: e f was analysed across each scenario (sc), this analysis revealed that e ft was preferred across all scenarios. Similarly, pw : ex and
pw : prwere analysed across all scenarios, this revealed thatexp and prpwere the least preferred attribute levels across all scenarios.
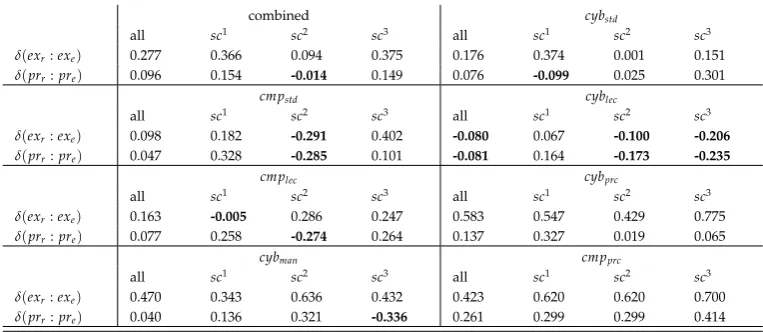
Table: 5 outlines the differences inpwforexandpr. pw:exindicated a strong preference forexr overexefor theallgroup (δ=0.277). Similarly,pw:prindicated a preference for a
prroverpreforall(δ=0.096).
Although rectangle was selected for bothexandpr, there is a greater difference in the utility difference forexr :execompared withprr:pre.
Table: 5 shows that there was a preference forexr overexe for all groups exceptcyblec who expressed a preference forexeoverexr(δ=0.080) andpreoverprr(δ=0.081). These
differences are marginal in comparison with the overall part worth score.
pw : pr(sc2)indicated a marginal preference for pre over prr (δ = 0.014). Not only
is this a small difference, sc2 is the only scenario for which this preference is expressed. This preference can be explained by thecmpstd,cyblecandcmplec groups who expressed a preference forpreoverprr.
4.3. Importance of Individual Characteristics
[image:13.595.115.497.578.744.2]Table 7 outlines the attribute importance values (aiv) for all the groups. The conjoint results indicate that thepreconditionattribute plays the most important role in preference choice (aiv =38.5%). The importance scores forevent flow(aiv = 32.6%) and exploit(aiv = 28.8%) indicate, that the exploitattribute was the least important in decision making. Al-thoughexploithad the lowest importance value, it had the strongest attribute selection score
Table 5– Differences inpwfor exploits and preconditions
combined cybstd
all sc1 sc2 sc3 all sc1 sc2 sc3
δ(exr:exe) 0.277 0.366 0.094 0.375 0.176 0.374 0.001 0.151
δ(prr:pre) 0.096 0.154 -0.014 0.149 0.076 -0.099 0.025 0.301
cmpstd cyblec
all sc1 sc2 sc3 all sc1 sc2 sc3
δ(exr:exe) 0.098 0.182 -0.291 0.402 -0.080 0.067 -0.100 -0.206
δ(prr:pre) 0.047 0.328 -0.285 0.101 -0.081 0.164 -0.173 -0.235
cmplec cybprc
all sc1 sc2 sc3 all sc1 sc2 sc3
δ(exr:exe) 0.163 -0.005 0.286 0.247 0.583 0.547 0.429 0.775
δ(prr:pre) 0.077 0.258 -0.274 0.264 0.137 0.327 0.019 0.065
cybman cmpprc
all sc1 sc2 sc3 all sc1 sc2 sc3
δ(exr:exe) 0.470 0.343 0.636 0.432 0.423 0.620 0.620 0.700
δ(prr:pre) 0.040 0.136 0.321 -0.336 0.261 0.299 0.299 0.414
Figure 3– Part worth scores for all participant groups
indicating that although not as important, the participants expressed high importance for the attribute level.
Importance values vary from group to group. For example, the lecturergroup (cyblec andcmplec) expressed highest importance foref, whilstcmpstd,cybprcandcmpprcexpressed highest importance forpr.
Importance values vary from group to group. For example, the lecturergroup (cyblec andcmplec) expressed highest importance foref, whilstcmpstd,cybprcandcmpprcexpressed highest importance forpr.
5. Conclusions
The results of this study provide an insight into practitioner attribute preferences in an attack graph. The results show that the winning configuration istre. The event flow in the winning configuration istop-downand consistent with the representation of models such as flow chartsandstate diagrams. Thebottom-updesign popular withfault treesandattack trees was strongly rejected and in fact graph configurations which involved a bottom-up design scored the lowest in all groups exceptcybprcwho scoredberhigher thantep. However, that was the only exception.
The score fortop-downbased configurations is notable and might explain why the attack graph proposed by Lallie et al. (2018) proved to be more effective than the fault tree method. Furthermore, the selection of a top-down design is particularly notable given the popularity of attack trees which utilise a bottom-up design.
It is useful to discuss the selection of the preferred configuration (tre) within the context of the attribute importance values. Section 3.4 outlined that although an attribute might be identified as important, it might not necessarily have a determining effect on the winning configurations. This was generally the case in the present study. The attribute importance values for theallgroup outlined in Table 7 highlighted the precondition attribute as hav-ing most importance (aiv=38.5) and the exploit attribute as having the least importance
(aiv=28.8). Although the top five preferred configurations presented event flow as
top-down, this shouldn’t be taken to mean that event flow was the most important attribute. The attribute importance value outlines individual attribute preferences.
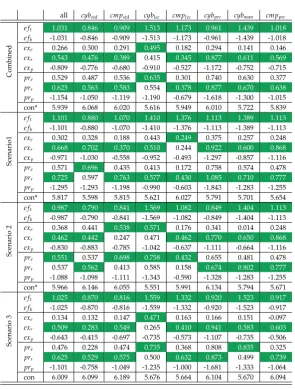
Table 6– Part worth utility scores (pw)
all cybstd cmpstd cyblec cmplec cybprc cybman cmpprc
Combined
e ft 1.031 0.846 0.909 1.513 1.173 0.961 1.439 1.018
e fb -1.031 -0.846 -0.909 -1.513 -1.173 -0.961 -1.439 -1.018
exe 0.266 0.300 0.291 0.495 0.182 0.294 0.141 0.146
exr 0.543 0.476 0.389 0.415 0.345 0.877 0.611 0.569
exp -0.809 -0.776 -0.680 -0.910 -0.527 -1.172 -0.752 -0.715
pre 0.529 0.487 0.536 0.635 0.301 0.740 0.630 0.377
prr 0.625 0.563 0.583 0.554 0.378 0.877 0.670 0.638
prp -1.154 -1.050 -1.119 -1.190 -0.679 -1.618 -1.300 -1.015
con* 5.939 6.068 6.020 5.616 5.949 6.010 5.722 5.839
Scenario1
e ft 1.101 0.880 1.070 1.410 1.376 1.113 1.389 1.113
e fb -1.101 -0.880 -1.070 -1.410 -1.376 -1.113 -1.389 -1.113
exe 0.302 0.328 0.188 0.443 0.249 0.375 0.257 0.248
exr 0.668 0.702 0.370 0.510 0.244 0.922 0.600 0.868
exp -0.971 -1.030 -0.558 -0.952 -0.493 -1.297 -0.857 -1.116
pre 0.571 0.696 0.435 0.413 0.172 0.758 0.574 0.478
prr 0.725 0.597 0.763 0.577 0.430 1.085 0.710 0.777
prp -1.295 -1.293 -1.198 -0.990 -0.603 -1.843 -1.283 -1.255
con* 5.817 5.598 5.815 5.621 6.027 5.791 5.701 5.654
Scenario
2
e ft 0.987 0.790 0.841 1.569 1.082 0.849 1.404 1.113
e fb -0.987 -0.790 -0.841 -1.569 -1.082 -0.849 -1.404 -1.113
exe 0.368 0.441 0.538 0.571 0.176 0.341 0.014 0.248
exr 0.462 0.442 0.247 0.471 0.462 0.770 0.650 0.868
exp -0.830 -0.883 -0.785 -1.042 -0.637 -1.111 -0.664 -1.116
pre 0.551 0.537 0.698 0.758 0.432 0.655 0.481 0.478
prr 0.537 0.562 0.413 0.585 0.158 0.674 0.802 0.777
prp -1.088 -1.098 -1.111 -1.343 -0.590 -1.328 -1.283 -1.255
con* 5.966 6.146 6.055 5.551 5.991 6.134 5.794 5.671
Scenario
3
e ft 1.025 0.870 0.816 1.559 1.332 0.920 1.523 0.917
e fb -1.025 -0.870 -0.816 -1.559 -1.332 -0.920 -1.523 -0.917
exe 0.134 0.132 0.147 0.471 0.163 0.166 0.151 -0.097
exr 0.509 0.283 0.549 0.265 0.410 0.941 0.583 0.603
exp -0.643 -0.415 -0.697 -0.735 -0.573 -1.107 -0.735 -0.506
pre 0.476 0.228 0.474 0.735 0.368 0.808 0.835 0.325
prr 0.625 0.529 0.575 0.500 0.632 0.873 0.499 0.739
prp -1.101 -0.758 -1.049 -1.235 -1.000 -1.681 -1.333 -1.064
con 6.009 6.099 6.189 5.676 5.664 6.104 5.670 6.094
* Constant winning scores shown in green
The selection of a rectangle for an exploit is consistent with the use of rectangles infault treesto represent events anddata flow diagramsto represent a process, and withSpecification
and Description Language Diagramsto represent tasks. Knowledge and experience with these
modelling systems - particularly data flow diagrams may have influenced participants in their selection.
[image:15.595.144.473.690.753.2]An ellipse is not used for similar purposes in many other modelling systems that the participants may have been aware of. Although the precondition was considered to have the highest importance in selection decisions, there was less certainty about which shape (ellipse or rectangle) should represent preconditions.
Table 7– Attribute importance values (aiv) expressed as percentages
all cybstd cmpstd cyblec cmplec cybprc cybman cmpprc
ef 32.6 39.5 27.3 40.0 43.0 31.2 38.2 32.6
ex 28.8 30.7 28.2 24.8 25.5 29.7 24.3 31.0
The study aimed to discover whether preferences would change between scenarios. Although there were small changes in preference, these were not considered significant enough to be notable. Furthermore, the study aimed to discover whether preferences would alter between groups. Here again, although there were some changes between sce-narios, overall the selection oftreand the rejection ofbrpheld well across all the groups.
5.1. Limitations and Future Work
It is notable that the configuration selected for the attack graph in Lallie et al. waster - which was the second most preferred configuration in the present study. There may be value in performing a similar study to Lallie et al. to consider the effectiveness oftreagainst ter- particularly because of what Caire et al. (2013) refer to as the preference performance paradoxwhere the preferred system is not necessarily the most effective one.
Although it would be useful to understand perceptual preferences relating to visual syntax such as colour, tone, line width/density/structure, and further attributes such as attacker capabilityandattack goals, adding further attributes complicated the study in terms of the factorial design and would render an overly complex experimental design compris-ing of too many factors. Now that the preferences for attributes the attributes highlighted herein have been found, a further study might consider the impact that adding further attributes has on preference.
The results were gathered from a wide base of students, lecturers and practitioners in both cyber-security and general computing. The study investigated preferences for expert-s/practitioners but not non-experts. The study by Lallie et al. (2018) outlined that attack graphs might be an effective method of presenting cyber-attacks to non-experts. If attack graphs are to be used for this purpose, it would be useful to understand attack graph pref-erences amongst non-experts.
Finally, more work should be done to understand the the impact of attack graph com-plexity on practitioner preferences. Although the present study considered preference de-cisions over three scenarios - each of which presented increasing levels of complexity, the changes in complexity were quite small.
Acknowledgments
Dr. John Fenlon, Reader in Statistics, University of Warwick for his advice and input in regards to designing conjoin study based experiments.
Dr David Knibb, retired Dean of Computing and Mathematics (University of Derby) for his advice and input in regards to the manuscript.
Figure
4
–
Sample
pr
efer
ence
selection
scr
een
Figure
5
–
Sample
pr
efer
ence
selection
scr
een
-with
thumbnail
Abraham, S. and Nair, S. (2015), ‘A predictive framework for cyber security analytics using attack graphs’, International Journal of Computer Networks & Communications (IJCNC) . 7
Aguessy, F.-X. (2016), ´Evaluation Dynamique de Risque et Calcul de R´eponses Bas´es sur des Mod´eles d’Attaques Bay´esiens, PhD thesis, T´el´ecom SudParis. 3
Albanese, M., Jajodia, S., Pugliese, A. and Subrahmanian, V. (2011), Scalable analysis of attack scenar-ios, in ‘European Symposium on Research in Computer Security’, Springer, pp. 416–433. 7
Alhomidi, M., Reed, M. J. et al. (2012), Attack graphs representations, in ‘Computer Science and Electronic Engineering Conference (CEEC), 2012 4th’, IEEE, IEEE, pp. 83–88. 3, 7
Barik, M. S. and Mazumdar, C. (2011), A novel approach to collaborative security using attack graph, in ‘5th International Conference on Internet Multimedia Systems Architecture and Application (IMSAA), 2011’, IEEE, IEEE, pp. 1–6. 7
Barik, M. S. and Mazumdar, C. (2014), A graph data model for attack graph generation and analysis, in ‘Recent Trends in Computer Networks and Distributed Systems Security’, Springer, pp. 239–250. 7
Bertin, J. (1983), Semiology of graphics: diagrams, networks, maps, University of Wisconsin press. 7
Bhattacharya, S., Malhotra, S. and Ghsoh, S. (2008), A scalable representation towards attack graph generation, in ‘1st International Conference on Information Technology, IT 2008’, IEEE, IEEE, pp. 1– 4. 3, 7
Braynov, S. and Jadliwala, M. (2003), Representation and analysis of coordinated attacks, in ‘Proceed-ings of the 2003 ACM workshop on Formal methods in security engineering’, ACM, pp. 43–51. 7
Buabeng-Andoh, C. (2012), ‘Factors influencing teachers’ adoption and integration of information and communication technology into teaching: A review of the literature’, International Journal of Education and Development using Information and Communication Technology8(1), 136. 4
Buoni, A., Fedrizzi, M. and Mezei, J. (2010), A delphi-based approach to fraud detection using attack trees and fuzzy numbers, in ‘Proceeding of the IASK International Conferences’, pp. 21–28. 3
Buyens, K., De Win, B. and Joosen, W. (2007), Empirical and statistical analysis of risk analysis-driven techniques for threat management, in ‘Second International Conference on Availability, Reliability and Security, ARES 2007’, IEEE, pp. 1034–1041. 4, 5, 6
Caire, P., Genon, N., Heymans, P. and Moody, D. L. (2013), Visual notation design 2.0: Towards user comprehensible requirements engineering notations, in ‘Requirements Engineering Confer-ence (RE), 2013 21st IEEE International’, IEEE, pp. 115–124. 8, 15
Chaufette, N. and Haag, T. (2007), ‘Vulnerability cause graphs: a case of study’. 6
Chen, F., Su, J. and Zhang, Y. (2009), A scalable approach to full attack graphs generation, in ‘Engi-neering Secure Software and Systems’, Springer, pp. 150–163. 7
Cheung, S., Lindqvist, U. and Fong, M. W. (2003), Modeling multistep cyber attacks for scenario recognition, in ‘DARPA information survivability conference and exposition, 2003. Proceedings’, Vol. 1, IEEE, IEEE, pp. 284–292. 3
Cuppens, F. and Miege, A. (2002), Alert correlation in a cooperative intrusion detection framework, in ‘Security and Privacy, 2002. Proceedings. 2002 IEEE Symposium on’, IEEE, IEEE, pp. 202–215. 7
Dacier, M., Deswarte, Y. and Kaˆaniche, M. (1996), Models and tools for quantitative assessment of operational security, in ‘Information systems security’, IBM TJ Watson Research Center, pp. 177– 186. 3, 7
Daley, K., Larson, R. and Dawkins, J. (2002), A structural framework for modeling multi-stage net-work attacks, in ‘Proceedings of the International Conference on Parallel Processing Workshops, 2002’, IEEE, IEEE, pp. 5–10. 7
Dantu, R., Loper, K. and Kolan, P. (2004), Risk management using behavior based attack graphs, in ‘Proceedings of the International Conference on Information Technology: Coding and Computing, ITCC 2004’, Vol. 1, IEEE, IEEE, pp. 445–449. 7
Dauda, S. Y. and Lee, J. (2015), ‘Technology adoption: A conjoint analysis of consumers preference on future online banking services’, Information Systems53, 1–15. 6
Davis, F. D. (1985), A technology acceptance model for empirically testing new end-user information systems: Theory and results, PhD thesis, Massachusetts Institute of Technology. 5
Dawkins, J. and Hale, J. (2004), A systematic approach to multi-stage network attack analysis, in ‘Information Assurance Workshop, 2004. Proceedings. Second IEEE International’, IEEE, IEEE, pp. 48–56. 7
Diallo, M. H., Romero-Mariona, J., Sim, S. E., Alspaugh, T. A. and Richardson, D. J. (2006), A compar-ative evaluation of three approaches to specifying security requirements, in ‘12th Working Confer-ence on Requirements Engineering: Foundation for Software Quality, Luxembourg’. 4, 5, 6
Dillon, A. and Morris, M. G. (1996), User acceptance of new information technology: theories and models, in ‘Annual review of information science and technology’, Medford, NJ: Information To-day. 4
Dohle, S., Keller, C. and Siegrist, M. (2010), ‘Conjoint measurement of base station siting preferences’, Human and Ecological Risk Assessment16(4), 825–836. 9
Dondossola, G., Pietre-Cambacedes, L., McDonald, J., Ekstedt, M., Torkilseng, A. and RSE, ´E. d. F. (2011), Modelling of cyber attacks for assessing smart grid security, in ‘Proceedings Cigr´e D2 2011 Colloquium’. 2
Durkota, K., Lis `y, V., Boˇsansk `y, B. and Kiekintveld, C. (2015), Optimal network security hardening using attack graph games, in ‘Proceedings of IJCAI’, pp. 7–14. 7
El Kouhen, A., Gherbi, A., Dumoulin, C. and Khendek, F. (2015), On the semantic transparency of visual notations: experiments with UML, in ‘International SDL Forum’, Springer, pp. 122–137. 8
Espedalen, J. H. (2007), Attack trees describing security in distributed internet-enabled metrology, Master’s thesis, Department of Computer Science and Media Technology, Gjovik University Col-lege. 3
Falliere, N., Murchu, L. O. and Chien, E. (2011), ‘W32. stuxnet dossier’, White paper, Symantec Corp., Security Response5. 8
Farley, K., Thompson, C., Hanbury, A. and Chambers, D. (2013), ‘Exploring the feasibility of conjoint analysis as a tool for prioritizing innovations for implementation’, implementation science8(1), 56. 9
Fink, G. A., North, C. L., Endert, A. and Rose, S. (2009), Visualizing cyber security: Usable workspaces, in ‘6th International Workshop on Visualization for Cyber Security, VizSec 2009’, IEEE, pp. 45–56. 2
Fithen, W. L., Hernan, S. V., O’Rourke, P. F. and Shinberg, D. A. (2004), ‘Formal modeling of vulnera-bility’, Bell Labs technical journal8(4), 173–186. 7
Fl˚aten, O. and Lund, M. S. (2014), How good are attack trees for modelling advanced cyber threats?, in ‘Proceedings of the Norwegian Information Security Conference 2014’, Ostfold University College, Fredrikstad, Norway.
URL:http://ojs.bibsys.no/index.php/NISK/article/view/1054, 5, 6, 7
Foo, B., Wu, Y.-S., Mao, Y.-C., Bagchi, S. and Spafford, E. (2005), Adepts: adaptive intrusion response using attack graphs in an e-commerce environment, in ‘Dependable Systems and Networks, 2005. DSN 2005. Proceedings. International Conference on’, IEEE, IEEE, pp. 508–517. 7
Frigault, M. and Wang, L. (2008), Measuring network security using bayesian network-based attack graphs, in ‘32nd Annual IEEE Conference on International Computer Software and Applications’, IEEE. 7
Ghosh, N. and Ghosh, S. K. (2012), ‘A planner-based approach to generate and analyze minimal attack graph’, Applied Intelligence36(2), 369–390. 7
Heberlein, T., Bishop, M., Ceesay, E., Danforth, M., Senthilkumar, C. and Stallard, T. (2012), ‘A taxon-omy for comparing attack-graph approaches’. 3
Hewett, R. and Kijsanayothin, P. (2008), Host-centric model checking for network vulnerability anal-ysis, in ‘Computer Security Applications Conference, 2008. ACSAC 2008. Annual’, IEEE, IEEE, pp. 225–234. 7
Hogganvik, I. and Stølen, K. (2005), On the comprehension of security risk scenarios, in ‘Proceedings of the 13th International Workshop on Program Comprehension, 2005. IWPC 2005’, IEEE, pp. 115– 124. 4, 5
Hogganvik, I. and Stølen, K. (2006), A graphical approach to risk identification, motivated by em-pirical investigations, in ‘International Conference on Model Driven Engineering Languages and Systems’, Springer, pp. 574–588. 4, 5, 6
Hogganvik, I. and Stølen, K. (2007), ‘Investigating preferences in graphical risk modeling’. 2, 4, 5, 6
Homer, J., Varikuti, A., Ou, X. and McQueen, M. A. (2008), Improving attack graph visualization through data reduction and attack grouping, in ‘Visualization for computer security’, Springer, pp. 68–79. 2
Huber, J. and Zwerina, K. (1996), ‘The importance of utility balance in efficient choice designs’, Journal of Marketing research pp. 307–317. 9
IBM DeveloperWorks (2016), ‘Ibm spss conjoint 24’.
URL:ftp://public.dhe.ibm.com/software/analytics/spss/documentation/statistics/24.0/en/client/Manuals/IBM SPSS Conjoint.pdf
9
ICS-CERT (2016), ‘Cyber-attack against ukrainian critical infrastructure’, Web Page.
URL:https://ics-cert.us-cert.gov/alerts/IR-ALERT-H-16-056-018
Idika, N. and Bhargava, B. (2012), ‘Extending attack graph-based security metrics and aggregating their application’, Dependable and Secure Computing, IEEE Transactions on9(1), 75–85. 7
IEC (1990), ‘Iec 61025 fault tree analysis’. 1
Ingols, K., Lippmann, R. and Piwowarski, K. (2006), Practical attack graph generation for network defense, in ‘2015 Symposium on Usable Privacy and Security Conference on Computer Security Applications, ACSAC’06’, IEEE, IEEE, pp. 121–130. 7
Jacobson, I. (2011), ‘Use case 2.0’.
URL:https://www.ivarjacobson.com/sites/default/files/field iji file/article/use-case 2 0 jan11.pdf 7
Jajodia, S., Noel, S. and O?Berry, B. (2005), Topological analysis of network attack vulnerability, in ‘Managing Cyber Threats’, Springer, pp. 247–266. 7
Jha, S., Sheyner, O. and Wing, J. (2002a), Two formal analyses of attack graphs, in ‘Computer Security Foundations Workshop, 2002. Proceedings. 15th IEEE’, IEEE, IEEE, pp. 49–63. 7
Jha, S., Sheyner, O. and Wing, J. M. (2002b), Minimization and reliability analyses of attack graphs, Report, DTIC Document. 4, 7
Jun-chun, M., Yong-jun, W., Ji-yin, S. and Shan, C. (2011), ‘A minimum cost of network hardening model based on attack graphs’, Procedia Engineering15, 3227–3233. 7
Kang, R., Dabbish, L., Fruchter, N. and Kiesler, S. (2015), My data just goes everywhere: user mental models of the internet and implications for privacy and security, in ‘2015 Symposium on Usable Privacy and Security’. 2
Karpati, P., Opdahl, A. L. and Sindre, G. (2011), Experimental comparison of misuse case maps with misuse cases and system architecture diagrams for eliciting security vulnerabilities and mitiga-tions, in ‘Sixth International Conference on Availability, Reliability and Security (ARES)’, IEEE, pp. 507–514. 4, 5, 6
Karpati, P., Sindre, G. and Opdahl, A. L. (2010), Visualizing cyber attacks with misuse case maps, in ‘International Working Conference on Requirements Engineering: Foundation for Software Qual-ity’, Springer, pp. 262–275. 4, 5, 6
Kasemsri, R. R. (2006), ‘A survey, taxonomy, and analysis of network security visualization tech-niques’. 2
Katta, V., Karpati, P., Opdahl, A. L., Raspotnig, C. and Sindre, G. (2010), Comparing two techniques for intrusion visualization, in ‘IFIP Working Conference on The Practice of Enterprise Modeling’, Springer, pp. 1–15. 4, 5, 6
Keller, T. and Tergan, S.-O. (2005), Visualizing knowledge and information: An introduction, in ‘Knowledge and information visualization’, Springer, pp. 1–23. 2
Kotenko, I. and Stepashkin, M. (2006), Attack graph based evaluation of network security, in ‘Com-munications and Multimedia Security’, Springer, Springer, pp. 216–227. 7
Kress, G. R. and Van Leeuwen, T. (1996), Reading images: The grammar of visual design, Psychology Press. 1
Lallie, H. S., Debattista, K. and Bal, J. (2018), ‘An empirical evaluation of the effectiveness of attack graphs and fault trees in cyber-attack perception’, IEEE Transactions on Information Forensics and Security13(5), 1110–1122. 2, 4, 7, 13, 15
Langner, R. (2011), ‘Stuxnet: Dissecting a cyberwarfare weapon’, Security & Privacy, IEEE9(3), 49–51. 8
Lee, J., Lee, H. and In, H. P. (2009), Scalable attack graph for risk assessment, in ‘International Con-ference on Information Networking, ICOIN 2009’, IEEE, IEEE, pp. 1–5. 7
Lee, R. M., Assante, M. J. and Conway, T. (2016), ‘Analysis of the cyber attack on the ukrainian power grid’.
URL:https://ics.sans.org/media/E-ISAC SANS Ukraine DUC 5.pdf 8
Li, W., Vaughn, R. B. and Dandass, Y. S. (2006), ‘An approach to model network exploitations using exploitation graphs’, Simulation82(8), 523–541. 3
Li, Y. (2007), Probabilistic toponym resolution and geographic indexing and querying, Thesis, De-partment of Computer Science and Software Engineering. 7
Liu, Y., Xiao, L., Liu, X., Ni, L. and Zhang, X. (2005), ‘Location awareness in unstructured peer-to-peer systems’, IEEE Transactions on Parallel and Distributed Systems pp. 163–174. 7
Lv, H. (2009), Research on network risk assessment based on attack probability, in ‘Computer Science and Engineering, 2009. WCSE’09. Second International Workshop on’, Vol. 2, IEEE, pp. 376–381. 7
Mæhre, M. (2005), Industrial experiences with misuse cases, Master’s thesis, Institutt for datateknikk og informasjonsvitenskap. 4, 5, 6
Marback, A., Do, H., He, K., Kondamarri, S. and Xu, D. (2013), ‘A threat model-based approach to security testing’, Software: Practice and Experience43(2), 241–258. 3
Mes´ıas, F. J., Mart´ınez-Carrasco, F., Mart´ınez, J. M. and Gaspar, P. (2011), ‘Functional and organic eggs as an alternative to conventional production: a conjoint analysis of consumers’ preferences’, Journal of the Science of Food and Agriculture91(3), 532–538. 9
Moody, D. (2007), What makes a good diagram? improving the cognitive effectiveness of diagrams in is development, in ‘Advances in information systems development’, Springer, pp. 481–492. 2
Moody, D. L. (2003), ‘The method evaluation model: a theoretical model for validating information systems design methods’, ECIS 2003 proceedings p. 79. 4
Moody, D. L. (2010), The” physics” of notations: a scientific approach to designing visual notations in software engineering, in ‘32nd International Conference on Software Engineering’, Vol. 2, IEEE, pp. 485–486. 1
Ning, P. and Xu, D. (2003), Learning attack strategies from intrusion alerts, in ‘Proceedings of the 10th ACM conference on Computer and communications security’, ACM, pp. 200–209. 7
Noel, S. and Jajodia, S. (2008), ‘Optimal ids sensor placement and alert prioritization using attack graphs’, Journal of Network and Systems Management16(3), 259–275. 46. 7
Noel, S., Jajodia, S., O’Berry, B. and Jacobs, M. (2003), Efficient minimum-cost network hardening via exploit dependency graphs, in ‘Computer Security Applications Conference, 2003. Proceedings. 19th Annual’, IEEE, IEEE, pp. 86–95. 7
Noel, S., Robertson, E. and Jajodia, S. (2004), Correlating intrusion events and building attack sce-narios through attack graph distances, in ‘Computer Security Applications Conference, 2004. 20th Annual’, IEEE, IEEE, pp. 350–359. 3
Opdahl, A. L. and Sindre, G. (2009), ‘Experimental comparison of attack trees and misuse cases for security threat identification’, Information and Software Technology51(5), 916–932. 2, 4, 5, 6
Ortalo, R., Deswarte, Y. and Kaˆaniche, M. (1999), ‘Experimenting with quantitative evaluation tools for monitoring operational security’, IEEE Transactions on Software Engineering25(5), 633–650. 3, 7
Ou, X. and Singhal, A. (2011), Attack graph techniques, in ‘Quantitative Security Risk Assessment of Enterprise Networks’, Springer, pp. 5–8. 7
Parondzhanov, V. (1995), ‘Visual syntax of the drakon language’, Programming and Computer Software21(3). 7
Peterson, J. L. (1977), ‘Petri nets’, ACM Computing Surveys (CSUR)9(3), 223–252. 1755. 1
Phillips, C. and Swiler, L. P. (1998), A graph-based system for network-vulnerability analysis, in ‘Pro-ceedings of the 1998 workshop on New security paradigms’, ACM, ACM, pp. 71–79. 7
Phillips, K. A., Maddala, T. and Johnson, F. R. (2002), ‘Measuring preferences for health care interven-tions using conjoint analysis: an application to hiv testing’, Health services research37(6), 1681– 1705. 6
Pullman, D., Etchegary, H., Gallagher, K., Hodgkinson, K., Keough, M., Morgan, D. and Street, C. (2012), ‘Personal privacy, public benefits, and biobanks: a conjoint analysis of policy priorities and public perceptions’, Genetics in medicine14(2), 229. 10
Qin, X. and Lee, W. (2004), Attack plan recognition and prediction using causal networks, in ‘20th Annual Conference on Computer Security Applications’, IEEE, IEEE, pp. 370–379. 7
Roschke, S., Cheng, F. and Meinel, C. (2011), A new alert correlation algorithm based on attack graph, in ‘Computational Intelligence in Security for Information Systems’, Springer, pp. 58–67. 2
Sawilla, R. E. and Ou, X. (2008), Identifying critical attack assets in dependency attack graphs, in ‘Proceedings of the 13th European Symposium on Research in Computer Security: Computer Se-curity’, ESORICS ’08, Springer-Verlag, Berlin, Heidelberg, pp. 18–34.
URL:http://dx.doi.org/10.1007/978-3-540-88313-5 27
Sawilla, R. and Ou, X. (2007), Googling attack graphs, techreport. 3, 7
Scott, L. M. (1994), ‘Images in advertising: The need for a theory of visual rhetoric’, Journal of consumer research21(2), 252–273. 1
Sen, A. and Madria, S. (2017), ‘Risk assessment in a sensor cloud framework using attack graphs’, IEEE Transactions on Services Computing10(6), 942–955. 3
Sheyner, O., Haines, J., Jha, S., Lippmann, R. and Wing, J. M. (2002), Automated generation and analysis of attack graphs, in ‘Proceedings of the 2002 IEEE Symposium on Security and privacy’, IEEE, IEEE, pp. 273–284. 7
Sheyner, O. and Wing, J. (2004), Tools for generating and analyzing attack graphs, in ‘Formal methods for components and objects’, Springer, Springer, pp. 344–371. 7