Engineering Department
Faculty of Science and Technology
Lancaster University
Improving the Reliability of
Optimised Link State Routing
Protocol in Smart Grid’s Neighbour
Area Network
Yakubu Tsado
(B.Eng., M.Sc.)
Submitted in partial fulfilment for the degree of Doctor of Philosophy
October 2016
i
Declaration
I, Yakubu Tsado, hereby declare that this thesis has been written by me and contains extracts from several published papers/articles, which I am a joint author. The work presented in this thesis was carried out at the University of Lancaster between October 2012 and October 2016 and has not been submitted in any previous application for a higher degree.
Yakubu Tsado
Dates ………..
Signature of candidate ………..
I, Doctor Kelum Asanga Akurugoda Gamage, hereby certify that the candidate has fulfilled the conditions of the resolution and regulations appropriate for the degree of Doctor of Philosophy in the University of Lancaster and that the candidate is qualified to submit this thesis in application for that degree.
Signed ………
ii
Acknowledgements
I would like to express my sincere gratitude to my supervisors, Dr Kelum Gamage, and Dr David Lund, for their immense guidance, support and valuable advice throughout the research. The confidence bestowed upon me, especially during the challenging periods of this research knows no bound. My deepest gratitude and appreciation also goes out to Dr Bamidele Adebisi for his understanding and taking time out to guide and read through my publications and thesis. Their detailed feedbacks and encouragement are greatly appreciated
I am also very grateful to the Centre for Global Eco-Innovation (CGE) and European Regional Development Fund (ERDF) who funded this project. The CGE programme has done a tremendous job in using the commercialisation consultancy Inventya Ltd and bringing together the expertise and resources of Lancaster University and the University of Liverpool. I acknowledge the dedication of the partner Company in this project “HW Communications Ltd Lancaster” for giving me the opportunity to work with them and also contributing financially to my tuition and upkeep
My gratitude goes to Graduate School Travel Grant for the financial contributions towards conferences attended. Also, a huge “thank you” to Abubakr Magzoub, Adeayo Sotayo, Babatunde Kazim, Charles
Odijie, Ekondu Ochogwu, Esenam Agubretu, Michael Fagbohungbe, Naley Alobari, and Noel Catterall.
Finally, I would like to extend my appreciation to My Mum, Mrs Abigail Tsado, and My siblings, Lolo, Sagi, Woye, Nnasha and Leah for their love, support, and sacrifice throughout the course of this program. I cannot thank them enough for their continuous encouragement.
iii
Abstract
A reliable and resilient communication infrastructure that can cope with variable application traffic types and delay objectives is one of the prerequisites that differentiates a Smart Grid from the conventional electrical grid. However, the legacy communication infrastructure in the existing electrical grid is insufficient, if not incapable of satisfying the diverse communication requirements of the Smart Grid. The IEEE 802.11 ad hoc Wireless Mesh Network (WMN) is re-emerging as one of the communication networks that can significantly extend the reach of Smart Grid to backend devices through the Advanced Metering Infrastructure (AMI). However, the unique characteristics of AMI application traffic in the Smart Grid poses some interesting challenges to conventional communication networks including the ad hoc WMN. Hence, there is a need to modify the conventional ad hoc WMN, to address the uncertainties that may exist in its applicability in a Smart Grid environment.
This research carries out an in-depth study of the communication of Smart Grid application traffic types over ad hoc WMN deployed in the Neighbour Area Network (NAN). It begins by conducting a critical review of the application characteristics and traffic requirements of several Smart Grid applications and highlighting some key challenges. Based on the reviews, and assuming that the application traffic types use the internet protocol (IP) as a transport protocol, a number of Smart Grid application traffic profiles were developed. Through experimental and simulation studies, a performance evaluation of an ad hoc WMN using the Optimised Link State Routing (OLSR) routing protocol was carried out. This highlighted some capacity and reliability issues that routing AMI application traffic may face within a conventional ad hoc WMN in a Smart Grid NAN.
Given the fact that conventional routing solutions do not consider the traffic requirements when making routing decisions, another key observation is the inability of link metrics in routing protocols to select good quality links across multiple hops to a destination and also provide Quality of Service (QoS) support for target application traffic. As with most routing protocols, OLSR protocol uses a single routing metric acquired at the network layer, which may not be able to accommodate different QoS requirements for application traffic in Smart Grid. To address these problems, a novel multiple link metrics approach to improve the reliability performance of routing in ad hoc WMN when deployed for Smart Grid is presented. It is based on the OLSR protocol and explores the possibility of applying QoS routing for application traffic types in NAN based ad hoc WMN. Though routing in multiple metrics has been identified as a complex problem, Multi-Criteria Decision Making (MCDM) techniques such as the Analytical Hierarchy Process (AHP) and pruning have been used to perform such routing on wired and wireless multimedia applications.
iv
List of Common Acronyms
3GPP: 3rd Generation Partnership Project
AHP: Analytical Hierarchy Process
ALM: Air Link Metric
AMI: Advanced Metering Infrastructure
AMR: Automatic Meter Reading
AODV: Ad Hoc On-Demand Distance Vector
AP: Access Point
ARP: Address resolution Protocol
AVL: Automatic Vehicle Location
BAN: Building/Business Area Network
BPLC: Broadband Power Line Communication
CBR: Constant Bit Rate
COSEM: Companion Specification for Energy Metering )
DA: Distribution Automation
DER: Distributed Energy Resources
DGM: Distributed Grid Management
Distributed Autonomous Depth-First Routing (DADR)
DLMS: Device Language Message Specification
DNP3: Distributed Network Protocol
DOE: Department of Energy
DOS: Denial of Service
DR: Demand Response
DSM: Demand Side Management
DSSS: Direct Sequence Spread Spectrum
EDCA: Enhanced Distributed Channel Access
EFW: Expected Forwarding Counter
EPT: Expected Path Throughput
ETE: End-to-end delay
ETX: Expected Transmission Count
EV: Electric Vehicle
EVCC: EV Charging Controller
v
FAN: Field Area Network
GOOSE: Generic Object Oriented Substation Event
GSSE: Generic Substation State Event
HAN: Home Area Networks
HEMS: Home Energy Management Systems
HWMP: Hybrid Wireless Mesh Protocol
HYDRO: Hybrid Routing Protocol
IAN: Industrial Area Networks
ITU: International Telecommunication Union
LBS: Location-Based Services
LLN: Lossy and Low power Networks
LTE: Long Term Evolution
M2M: Machine to Machine
MAC: Media Access Control Layer
MANET: Mobile Ad hoc Networks
MCDM: Multi-Criteria Decision Making
MD: Minimum Delay
MDMS: Meter Data Management Systems
ML: Minimum Loss
MMS: Manufacturing Message Specification
NAN: Neighbour Area Network
NBPLC: Narrow-Band Power Line Communication
NGN: Next Generation Networks
NIST: National Institute of Standards and Technology
ns: network simulator
OFDM: Orthogonal Frequency Division Modulation
OLSR: Optimised Link State Routing Protocol
PDR: Packet Delivery Ratio
PHEV: Plug-in Hybrid Electronic Vehicles
PHY: Physical Layer
PLC: Power Line Communication
PMU: Phase Measurement Unit
PREP: Path Reply
PREQ: Path Request
vi
RLMT: Route Link Metric Type
RLMTV: Route Link Metric Type Value
RLMTW: Route Link Metric Type Weight
RPL: Routing Protocol for Low Power and Lossy Networks.
RTU: Remote Telemetry Unit
SCADA: Supervisory Control and Data Acquisition
SGIP: Smart Grid Interoperability Panel
TETRA: Terrestrial Trunk Radio
USN: Ubiquitous Sensor Network
UTC: Utility Telecom Council
VPN: Virtual Private Network
WACS: Wide Area Control Systems
WAM: Wide Area Measurement
WAMS: Wide Area Monitoring Systems
WAN: Wide Area Networks
WAPS: Wide Area Protection Systems
WASA: Wide Area Situational Awareness
WIMAX: World Interoperability for Microwave Access
WLAN: Wireless Local Area Network
WMN: Wireless Mesh Network
WPAN: Wireless Personal Area Networks
WPM: Weighted Product Model
WPMS: Weighted Product Model Score
WSM: Weighted Sum Model
vii
Contents
Chapter 1 ... 1
1. Introduction ... 1
1.1. Overview ... 2
1.2. Background ... 4
1.3. Research Aim and Motivation... 6
1.4. Scope of Research... 7
1.5. Contribution of the Thesis ... 8
1.6. List of Publication... 9
1.7. Thesis Outline ... 10
Chapter 2 ... 12
2. Communication Technologies for Smart Grid: Background and Literature Review ... 12
2.1. Introduction... 13
2.2. Legacy in the Electrical Grid ... 14
2.2.1. Distributed Energy and Automation ... 15
2.2.2. Key Utility Applications ... 16
2.2.3. Data Management... 22
2.2.4. End-to-End Communication ... 23
2.3. Smart Grid Communication Architecture... 27
2.3.1. Adaptation of USN layers for Smart Grid ... 28
2.3.2. USN Sensor Network Layer ... 30
2.3.3. USN Access Network Layer ... 31
2.3.4. USN Next Generation Network (NGN) layer... 31
2.3.5. USN Middleware Layer for Smart Grid... 31
2.4. Smart Grid Communication Technologies ... 33
2.4.1. Wireless Communication Technologies... 33
2.4.2. Wired Communication Technologies ... 38
2.4.3. Optical Wireless Communication for Smart Grid ... 39
viii
2.5.1. Factors that determine choice of communication technologies ... 43
2.5.2. Requirement for NAN Communication ... 45
2.5.3. Routing Protocols for NAN ... 46
2.5.4. Key Research Challenge ... 48
2.5.5. Why Optimised Link State Routing (OLSR)... 49
2.6. Chapter Summary ... 50
Chapter 3 ... 51
3. Traffic Classification and Performance Analysis of Ad-hoc WMN routing protocols in NAN for AMI... 51
3.1. Introduction... 52
3.2. Ad hoc WMN Routing protocols ... 53
3.2.1. Hybrid Wireless Mesh Protocol (HWMP) ... 54
3.2.2. Optimised Link State Routing protocol ... 56
3.3. Communication over NAN ... 58
3.3.1. Classification of Smart Grid Application traffic ... 59
3.3.2. Traffic profiles for simulation... 62
3.4. Implementation of ad hoc WMN for AMI... 63
3.4.1. Components used for Experimental setup ... 64
3.4.2. Experimental setup and Node configuration ... 65
3.4.3. Performance Evaluation metric ... 70
3.4.4. Results and Discussion... 71
3.5. Simulation of NAN based ad hoc WMN. ... 75
3.5.1. Simulation Setup for NAN based ad hoc WMN ... 76
3.5.2. Simulation Results and Discussion... 79
3.5.3. Key Findings ... 88
3.6. Chapter Summary ... 89
Chapter 4 ... 90
4. Using OLSR-multiple-metric to improve reliability in NAN based ad hoc WMN ... 90
4.1. Introduction... 91
ix
4.2.1. Existing Problems of OLSR-single metrics... 93
4.2.2. Problems of OLSR Single metrics in NAN ... 94
4.3. Reliability Improvement in OLSR for NAN... 94
4.3.1. Multiple-metric Node Architecture for NAN devices in AMI ... 95
4.3.2. Module for multiple-metric path selection in NAN devices... 97
4.3.3. Pruning Methods ... 97
4.4. Link Metric Evaluation (Case Study) ... 97
4.4.1. Simulation Scenario ... 98
4.4.2. Used Link Metric... 99
4.5. Simulation Results ... 99
4.6. Combining multiple link metric with OLSR...103
4.6.1. Applying AHP for routing in NAN based WMN...103
4.6.2. Metric Weighting ...104
4.6.3. Priority weightings ...105
4.6.4. Total score calculations ...106
4.7. Chapter Summary ...108
Chapter 5 ... 109
5. Implementation of multiple metrics with OLSR using AHP ... 109
5.1. Introduction...110
5.2. Problem Statement ...110
5.3. Related Work ...111
5.4. Multi-Criteria Decision Making Techniques (MCDM) ...112
5.4.1. The Weighted Sum Model (WSM) Technique ...113
5.4.2. The Weighted Product Model (WPM) Technique ...114
5.4.3. Applying AHP and Further Discussions ...116
5.5. Multiple metric Implementation ...116
5.5.1. Implementation Overview and Description ...117
5.5.2. Implementation Description ...120
5.5.3. Multiple metrics Framework Discussion ...121
x
5.6.1. Simulation Scenario ...122
5.6.2. Simulation Setup ...124
5.6.3. Results and Discussions ...125
5.6.4. Performance Evaluation on different Grid cluster sizes...129
5.7. Key Findings ...132
5.8. Chapter Summary ...134
Chapter 6 ... 136
6. Conclusions and Future Work ... 136
6.1. Conclusions...137
6.2. Summary of Contributions...139
6.3. Future Research Direction ...142
References... 144
Appendix A ... 153
xi
List of Figures
Figure 1-1: The unidirectional power flow in existing electricity grid ... 2
Figure 2-1: Network components for end-to-end communication in Smart Grid ... 25
Figure 2-2: Schematic layers of the USN sensor network applied to Smart Grid... 29
Figure 2-3: USN layers with corresponding Smart Grid network components. ... 30
Figure 2-4: USN Middleware communication bus ... 33
Figure 3-1: An example of Ad hoc Wireless Mesh Network Topology ... 54
Figure 3-2: Selection of MPRs in OLSR routing protocols ... 57
Figure 3-3: Steps for android device configuration on ad-hoc model ... 65
Figure 3-4: Node chain topology with 1 hop to 4 hop routes ... 66
Figure 3-5: Network configuration snapshot on Nexus 7 device ... 67
Figure 3-6: OLSRd on smart meter node 4 showing single hop and two hop connection with smart meter node 5 and smart meter node 6 ... 68
Figure 3-7: IP-Table for smart meter node 192.168.0.4... 69
Figure 3-8: Chain topology for 2 hop and 3 hop experimental setup ... 70
Figure 3-9: AMI data traffic PDR for nodes transmitting to a backhaul node when the intermediate nodes are passive and active. AMI data traffic profile was configured with a packet size of 123 bytes sending 1 packet every 15 seconds. ... 72
Figure 3-10: PDR for Power quality measurement traffic for nodes transmitting to a backhaul node when the intermediate nodes are passive and active. Power quality measurement traffic profile was configured with a packet size of 512 bytes, sending 2 packets per second. ... 72
Figure 3-11: PDR for WAM traffic for nodes transmitting to a backhaul node when the intermediate nodes are passive and active. WAM traffic profile was configured with a packet size of 48 bytes, sending 25 packets per second. ... 73
Figure 3-12: PDR for video surveillance update traffic for nodes transmitting to a backhaul node when the intermediate nodes are passive and active. Video surveillance traffic profile was configured with a packet size of 1024 bytes, sending 1 packet per second. ... 73
Figure 3-13: Average PDR at different hop count for all applications transmitting to a destination node ... 74
Figure 3-14: Average Jitter at different hop count for all applications transmitting to a backhaul node ... 75
Figure 3-15: A 3 by 3 grid Wireless Mesh network for NAN ... 78
xii
Figure 3-17: Mean and median PDR for power quality measurement traffic on varying grid sizes
using OLSR and HWMP. ... 80
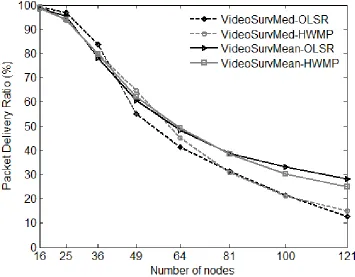
Figure 3-18: Mean and median PDR for video surveillance traffic on varying grid sizes using OLSR and HWMP ... 81
Figure 3-19: Mean and median PDR for WAM traffic on varying grid sizes using OLSR and HWMP ... 81
Figure 3-20: Mean and median ETE delay for AMI data traffic on varying grid sizes using OLSR and HWMP. ... 83
Figure 3-21: Mean and median ETE delay for power quality measurement traffic on varying grid sizes using OLSR and HWMP ... 83
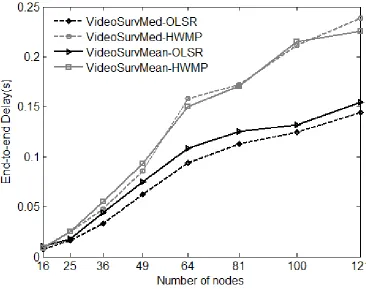
Figure 3-22: Mean and median ETE delay for video surveillance traffic on varying grid sizes using OLSR and HWMP... 84
Figure 3-23: Mean and median ETE delay for AMI application traffic on varying grid sizes using OLSR and HWMP. ... 84
Figure 3-24: Average throughput for AMI data traffic traffic on varying grid sizes using OLSR and HWMP. ... 86
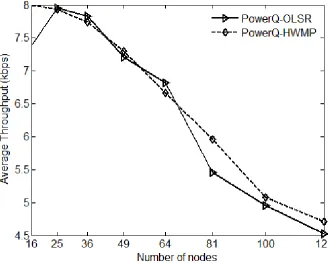
Figure 3-25: Average throughput for power quality measurement traffic on varying grid sizes using OLSR and HWMP. ... 86
Figure 3-26: Average throughput for video surveillance traffic on varying grid sizes using OLSR and HWMP. ... 87
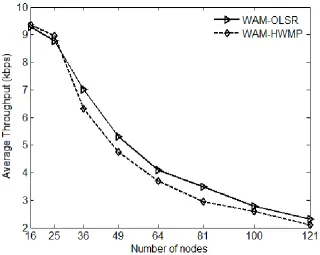
Figure 3-27: Average throughput for WAM traffic on varying grid sizes using OLSR and HWMP. . 87
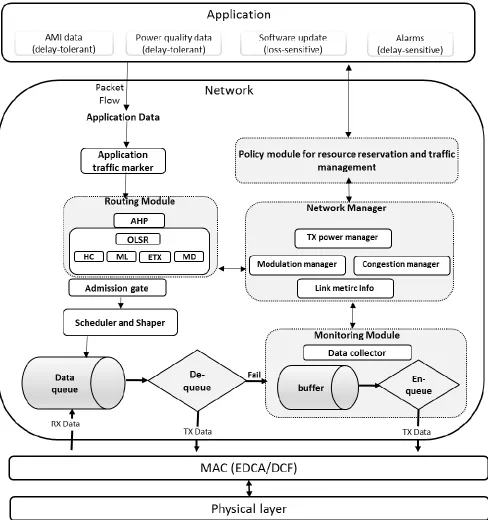
Figure 4-1: Structure of the node architecture for improving OLSR reliability on NAN devices for AMI ... 96
Figure 4-2: PDR for delay and loss sensitive AMI applications ...100
Figure 4-3: End-to-end delay for loss and delay sensitive AMI applications ...100
Figure 4-4 Average Throughput for delay and loss sensitive AMI applications ...101
Figure 4-5: PDR obtained from multiple traffic transmitted from Smart meters...102
Figure 4-6: Average delay obtained from multiple traffic types transmitted from NAN devices ...102
Figure 4-7: 3-by-3 Grid Mesh Network Topology for NAN ...103
Figure 5-1: Example of a Simple Network...113
Figure 5-2: Components of the multiple metrics framework...117
Figure 5-3: Example of using the multiple metrics framework for three different application traffic types ...119
Figure 5-4: Simulation Scenario of an AMI in NAN ...123
Figure 5-5: CBR packets Transmitted/Dropped for EV charging application traffic...125
Figure 5-6: CBR Transmitted/Dropped for AMI data application traffic ...126
xiii
Figure 5-8: DR CBR packets Transmitted/Dropped for peak pricing ...127
Figure 5-9: Average PDR for all application traffic ...128
Figure 5-10: Loss probability for all application traffic type ...128
Figure 5-11: Average end-to-end delay for all applications. ...129
Figure 5-12: PDR for Smart Grid application on Grid clusters with a central placement of the data concentrator. ...130
Figure 5-13: PDR for Smart Grid application on grid clusters with the data concentrator placed at the top corner...131
Figure 5-14: Average end to end delay for Smart Grid application on grid clusters with a central placement of the data concentrator. ...132
xiv
List of Tables
Table 2-1: Comparison of Todays Grid and Future Smart Grid ... 15
Table 2-2: Smart grid applications network bandwidth and latency requirement... 21
Table 2-3: Characteristics of Smart Grid communication technologies ... 42
Table 3-1: Smart Grid Application Traffic Classification... 61
Table 3-2: Traffic profiles Characteristics... 63
Table 3-3: Transmission environment parameters ... 77
Table 3-4: Routing protocol parameters... 77
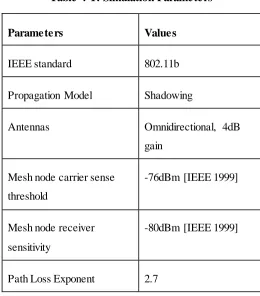
Table 4-1: Simulation Parameters ... 98
Table 4-2: Metric values for selected Paths from node 0 - 8 ...104
Table 4-3: Path score for different priorities ...106
Table 5-1: Summary the performance value of RLMT ...114
1
Chapter 1
2
1.1. Overview
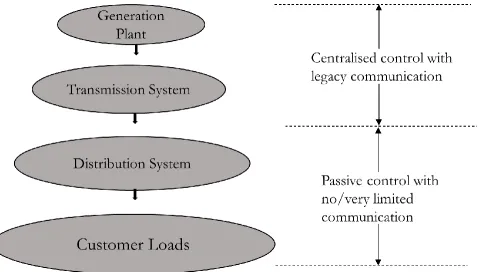
The traditional electric power infrastructure has remained unchanged since its inception. It has been a strictly hierarchical system for decades of operation, where power flows in one direction from generating plants towards the consumer load (as shown in Figure 1-1). This system of power generation and supply is rapidly approaching its limitations. As a result, the level of satisfaction currently expected by both the consumer and supplier is restrained for various reasons including:
i) the growth in demand for electricity driven by increase in population, electrical/digital equipment, automated manufacturing and the anticipated introduction of Electrical Vehicles (EV’s);
ii) the open loop method of operation in the existing grid, where the control centre has very limited or no near real-time information about the dynamic change in load and operating condition of the electrical system.
[image:17.596.81.559.433.705.2]The increasing load, poor visibility and lack of situational awareness have made the grid susceptible to frequent disturbances that may lead to cascading failures (Farhangi, 2010). These failures can easily create numerous levels of risk, both in grid components and at the consumer end. This underscores the necessity of reliable and secure power and information transfer in all directions.
3
Furthermore, the growing awareness of the adverse effects of climate change and environmental risk has led to the reduction of greenhouse gas emissions from power generation. The cost of generation associated with energy sources from fossil fuel depletion and nuclear energy has also brought about a shift towards renewable energy sources like solar and wind power. This is evident in the fact that many countries have set targets for the generation and integration of renewable energy. For example, according to a report ‘U. K. Renewable Energy Road Map’ released by the Department of Energy and Climate Change (DECC) in 2011 (Department of Energy & Climate Change (DECC), 2011), the UK has set a target to deliver 15 % of its total energy consumption from renewable sources by 2020. The target is already being achieved; in the 4th quarter of 2015, the renewables’ share of electricity generation was a record 26.9 %, up 5.0 % from the 4th quarter of 2014 (James Hemingway). This is a reflection of high renewable power generation on low overall power generation.
In addition, EVs, which will feed off the electrical grid, are also being considered promising solutions to reduce carbon emission and the dependence on fossil fuel. An increase in the adoption and usage of EVs is expected to become a major load to the grid in the near future. For instance, since the introduction of the Plug-in Car Grant in January 2011, there have been 63,100 eligible cars registered (Element Energy Limited, 2010). If EVs are adopted by all end users, additional peak electricity demand on the UK national grid is expected to be up to 1.5% by 2020 and 10% by 2030 (Element Energy Limited, 2010). The integration of EVs with the existing grid reserves, reverses the direction of the power flow since they are also expected to act as storage devices that can feed power back to the grid.
The Smart Grid aims to address all the shortcomings of the existing electrical grid by integrating information and communication technologies to support and augment the performance of existing electrical power networks. In a more detailed description, the U. S. Department of Energy (DoE) defines Smart Grid as “a distributed and automated energy delivery network that provides a two-way flow of
electricity and information as well as enables near-instantaneous balance of supply and demand by incorporating the benefits of distributed computing and communications”. Thus, a robust
communication infrastructure must act as a key enabler for Smart Grid. This would differentiate it from the conventional grid, by allowing the exchange of information between its components for data acquisition monitoring, control, and protection of applications.
4
1.2. Background
It is important to mention that Smart Grid is not a destination in itself. It is a journey motivated by ambitious goals such as energy savings, efficient and sustainable power supply, reduction of greenhouse gas emissions and attaining satisfactory levels of security and quality of energy supply (Balmert and Petrov, 2010). Achieving Smart Grid goals will involve a set of functionalities within the generation, distribution and consumer premises rather than a deployment of individual appliances or technologies (Tsado et al., 2015b).
The present electrical grid incorporates different types of systems, devices and communication media with specific procedures for exchanging data. For example, the Supervisory Control and Data Acquisition (SCADA) system with Remote Telemetry Unit (RTU) and Programmable Controllers, are used on the power grid for monitoring and control purposes. These are mostly based on proprietary protocols and wired communication networks such as cables using Modbus protocols, Power Line Communication (PLC) and fibre optic (Nordell, 2008). This is because wired networks were considered suitable for the high capacity and high-reliability transmission that were required at the time. With the growing portfolio of Smart Grid applications has come the need for ubiquitous sensing and communication by Utility operators that can provide sufficient measurement and bandwidth for supporting the large number of devices and their traffic requirements.
5
There are also efforts to develop communication network architecture or framework required to tie together the diverse applications and heterogeneous communication technologies that will be deployed on these network partitions.
Smart Grid communication has been researched with different media techniques, including wireless, coaxial, PLC or hybrid combinations of these technologies. However, the choice of technology has been largely determined by cost and personal interest. Among contemporary wireless technologies, the IEEE 802.11 ad hoc wireless mesh network will play an important role in meeting the existing and future communications needs for Smart Grid, especially in partitions, which involve Local Area Networking (LAN) such as NAN. This is because it has several advantages, they include, extended coverage, low-cost, low latency and Quality of Service (QoS) support; it has also been implemented to bridge seamlessly with several other wireless standards and wired technologies.
The IEEE 802.15.4g wireless standard has made outstanding progress in HAN, and plans to extend its capabilities to the area of NAN are being explored. However, there are various problems, one of which is its limited data rates, which will not provide the required bandwidth capacity for NAN. Aside from providing high bandwidth, IEEE 802.11 Wireless LAN (WLAN) standards are considered candidates for NAN because they provide high-speed and easy-to-deploy wireless backbone services. They also possess outdoor deployment properties where the network may support a number of different applications and services, which are essential requirements of a NAN communication network (Zhang et al., 2011). They can be deployed as Wireless Mesh Networks (WMN) which are capable of
self-organisation, self-configuration, and self-healing as well as transmit using a multi-hop environment (Akyildiz et al., 2005). The IEEE 802.11 has increasing throughput, Physical (PHY) Layer data rates and the ability to provide extended transmission range and reliability when deployed as ad hoc WMN, where a node can send information to a destination across multiple hops. However, reliability in 802.11 ad hoc WMN is not only dependent on the throughput and data rate capabilities, but also the ability of the routing protocols to find reliable paths to a destination.
6
delay and Packet Delivery Ratio (PDR). This can lead to congestion since it will require Smart meters to send all application traffic to the destination through a single path. It is, therefore, necessary to steer the design and modification of routing protocols for NAN based WMN towards the perspective of network management that will consider cross-layer QoS routing and adaptively support the requirement for different application traffic types.
1.3. Research Aim and Motivation
In IEEE 802.11 ad hoc WMN technology, routing protocols determine the path needed for data flow to the destination. Therefore, when ad hoc WMN is deployed for communication in NAN, the efficiency of the network and Smart Grid is dependent on the routing protocols. When designing a routing protocol for Smart Grid, it is most important to study the application traffic to be supported and the link metric for path selection. As one of the conventionally used and deployed routing protocols in ad hoc WMN, the Optimised Link State Routing (OLSR) protocol can be used to significantly extend the reliability of the Smart Grid NAN, by allowing fast and reliable communication over a wide neighbourhood coverage area. It is worth noting here that the conventional ad hoc WMN with OLSR routing protocol was only developed to support multimedia applications such as voice, video, web browsing and node mobility. In contrast, the communication network for smart grid applications has to support machine-to-machine communication (M2M), which is autonomous in nature and triggered by time or event. For instance, it must support information exchange between a large number of smart meters, intelligent electronic devices (IEDs) and sensors/actuators with limited or no human intervention. Moreover, each application operating on any of these M2M devices has different characteristics and traffic requirements, depending on their mode of operation (e.g. Normal/periodic, alert, fault). For example, while the meter reading traffic from a smart meter is fairly delay-tolerant, the demand management traffic from the same device is much more delay sensitive; likewise, the traffic priority of a demand management event and a substation event is quite different. Therefore, the coexistence of monitoring, control and reporting traffic poses additional challenge of providing strict QoS differentiation within a multi-service Smart Grid communication network.
7
several Smart Grid applications. For each network component, it highlights potential communication technologies and their challenges. Based on the review and having identified ad hoc WMN as a front runner for NAN component of the Smart Grid, a traffic classification and modelling of traffic profiles using transmission interval and delay requirements is presented. Subsequently, an experimental setup and a series of simulation studies (using smart meter as the traffic source) are conducted to identify and highlight QoS and capacity issues that application traffic will face within a NAN based ad hoc WMN using OLSR as its routing protocol. A key solution to the observed issues is to provide an adaptive QoS for routing targeted applications, as routing protocols with single link metric such as ETX, used for path selection are deficient in guaranteeing reliable QoS for variable Smart Grid applications. Amongst the different existing routing approaches, the focus of this thesis is mainly on the use of multiple metrics with OLSR to improve reliability of ad hoc WMN when they are deployed for NAN communication. As a result, a network architecture for smart meters communicating in a NAN based WMN that will incorporate the multiple metrics algorithm is proposed. The possibility of combining multiple metrics with OLSR protocol, through the Analytical Hierarchy Process (AHP) algorithm is also explored to provide adaptive QoS for variable applications. An implementation of multiple metrics OLSR in a NAN based ad hoc WMN is then presented and results are compared with other existing OLSR link metric versions.
It is important to note that this thesis focuses on packet delivery reliability of Smart Grid applications in NAN using predefined or modelled Smart Grid application traffic profiles. Though conventional telecommunication applications such as voice over IP (VOIP), streaming multimedia, and the Internet may also be present in a Smart Grid, they were not considered. Additionally, while security is a key issue in a large and complex cyber-physical system such as the Smart Grid, it is also not within the scope of this thesis.
1.4. Scope of Research
There has been a lot of research and modification on existing protocols for reliable routing of multimedia applications without necessarily considering Smart Grid scenarios and their application traffic. This thesis explores the use of OLSR routing protocol in Smart Grid’s NAN, based on ad hoc
8
1.5. Contribution of the Thesis
The contribution of this thesis can be summarised in twofold. The first contribution is the design of traffic profiles and a performance evaluation of ad hoc WMN using the OLSR protocol in Smart Grid NAN. This was achieved through an experimental and simulation evaluation of OLSR protocol in a NAN based ad hoc WMN scenario. The second contribution is the case study and simulation evaluation of multiple metric OLSR through the use of the AHP, a Multi Criteria Decision Making (MCDM) algorithm. It is designed to support target application level QoS requirement using different OLSR link metric versions to enable good quality links to a destination. Each chapter has a section which lists its specific contribution. However, a summary of the key contribution of each chapter of this thesis is highlighted as follows:
Chapter 2 provides an in-depth review on Smart Grids communication components and traffic for different applications that will utilise the communication components. The chapter also explores the use of the International Telecommunications Union (ITU)'s Ubiquitous Sensor Network architecture (USN) architecture for Smart Grid and presents the available communication technologies which can be deployed within the USN schematic layers for a secure and resilient communication, including a study of their pros and cons, vulnerabilities and challenges. This contribution has been published in the Computer Communication Journal (Elsevier).
Chapter 3 makes a case for the use of OLSR routing protocol in NAN based WMN, by carrying out an evaluation of conventional OLSR protocol through experimental setup and simulation, to demonstrate its multi-hopping capabilities in a NAN based ad hoc WMN scenario. Its delay, PDR and throughput performance were compared with the IEEE 802.11 standard HWMP, which shows that HWMP does not outperform OLSR. The results obtained from the performance evaluation of OLSR protocol in a NAN based ad hoc WMN network scenario using Smart Grid application traffic profiles have been published in the International Conference on Smart Systems and Technologies (SST) 2016.
Chapter 4 presents a case study on the modification of OLSR protocol to improve reliability and QoS support for Smart grid’s application traffic types using multiple metrics with AHP algorithm
and Pruning. Given that OLSR is only responsible for informing nodes about the best path to a destination, the study shows that the use of AHP with multiple metrics can inform nodes on better paths to a destination for a particular application traffic. The contribution of this study was presented and published in the IEEE Second International Smart Cities Conference (ISC2) 2016.
Chapter 5 develops a multiple metrics OLSR in ns-2 to adaptively support QoS for targeted Smart
9
Smart Grid application traffic types using the multiple metric OLSR with AHP shows an improvement in performance in terms of reliability and delay compared to other conventional OLSR link metric types.
1.6. List of Publication
At the start of this research in October 2012, Smart Grid was still a fledgling concept. The supporting company was highly interested in communication technologies that support cross-layer techniques, which involves multi-hopping and routing over extended distance within the Low Voltage (LV) and Medium Voltage (MV) areas. The company has also been involved in PLC technologies. Therefore, the author was compelled to review and explore other communication technologies, especially PLC. This led to the publication of papers establishing possible scenarios and their impact within the MV and LV area of communication. The majority of the papers were published in peer-reviewed conferences to keep pace with ongoing research activities in Smart Grid. The complete list of published and submitted articles related and unrelated to this thesis write up are presented as follows:
Article/Publications Related to the thesis write -up
Communication Technologies for Smart Grid Ubiquitous Sensor Network System submitted and presented at the “IEEE 4th International Conference on Power Engineering, Energy and
Electrical Drive” Istanbul, Turkey on May 12 – 18, 2013.
Resilient Wireless Communication Networking for Smart Grid Building Area Network (BAN) submitted and presented at the “IEEE International Energy Conference (EnergyCon)”
Dubrovnik, Croatia, May 13 – 16, 2014.
Performance Evaluation of Wireless Mesh Network routing protocol for Smart Grid networks presented at the “IEICE Information and Communication Technology Forum Manchester UK,
June 3 – 5, 2015”.
Resilient Communication for Smart Grid Ubiquitous Sensor Network: State of the Art and Prospects for Next Generation. Elsevier Journal for Computer Communication, July 2015.
10
Multiple Metrics-OLSR in NAN for Advanced Metering Infrastructures presented at the “IEEE Second International Smart Cities Conference (ISC2)” Trento, Italy, September 12 – 15, 2016.
Improving the Reliability of Optimised Link State Routing in a Smart Grid Neighbour Area Network based Wireless Mesh Network Using Multiple Metrics. energies Journal “Volume 10, issue 3, 2017”.
Other Publications generated as part of this research
Challenges of Time-critical Applications in Narrow Band Power Line Communication (NBPLC) Deployed for Smart Grid. Faculty of Science and Technology Christmas Conference 2013 Poster Presentation.
Performance of Time-Critical Smart Grid Applications in Narrow Band Power Line Communication submitted and presented at the “7th IET international conference on Power Electronics, Machines and Drives (PEMD)” Manchester 8 - 10 April 2014.
Narrowband PLC channel Modelling for Smart Grid Applications submitted for the “9th IEEE/IET International symposium on Communication systems, Networks and Digital Signal Processing, CSNDSP14” Manchester, UK July 23 – 25 2014.
1.7. Thesis Outline
This section outlines the remaining chapters of this thesis as follows:
Chapter 2
The main focus of Chapter 2 is to present an overview of network components/partitions that constitute a Smart Grid communication network and the different applications that will utilise the network components. In particular, it describes the Home Area Network (HAN), Neighbour Area Network (NAN), Field Area Network (FAN) and Wide Area Network (WAN), which is the focus of this thesis. Furthermore, an overview of the adaptation of the ITU’s USN is also presented to tie together the
11
Chapter 3
This Chapter presents a classification of Smart Grid traffic and examines the performance of HWMP (which is the default routing protocol of the IEEE 802.11s standard) with the OLSR protocol in a NAN based ad hoc WMN. An experimental setup of ad hoc WMN for NAN was implemented using Commercial Off The Shelf (COTS) devices to observe the performance of Smart Grid traffic over a real ad hoc WMN implementation. The ns-3 simulation was then used to simulate a larger network of Smart meters in a NAN scenario. Results from simulations in ns-3 show that HWMP does not outperform OLSR. This allows the possibility of exploring the modification of OLSR protocol to address the routing challenges and improve reliability in a NAN based ad hoc WMN.
Chapter 4
A case study of the performance of three OLSR link metric versions is carried out on a grid topology wireless mesh NAN using the ns-2 network simulator. The two best performing metrics were used to demonstrate the possibility of combining multiple metrics with the OLSR protocol, through the AHP decision-making algorithm to improve link quality and fulfil the QoS routing requirements of targeted AMI application traffic.
Chapter 5
This Chapter presents a multiple-metric OLSR route framework which is designed for cross-layer and multiple metric routing decision in NAN based ad hoc WMN. The framework uses multiple OLSR link metric versions to support Smart grid application level QoS requirements, by allowing different applications to use different paths provided by the OLSR link metric types. This is aimed at allowing or enabling appropriate route decisions for target Smart Grid application traffic at the network layer. The chapter also analyses the multiple metrics framework and evaluates its performance on a NAN scenario using the ns-2 simulation.
Chapter 6
12
Chapter 2
2.
Communication Technologies for Smart
13
2.1.
Introduction
The next generation electrical grid or Smart Grid is envisioned to use a combination of existing communication technologies for advanced monitoring, control and protection to enable active customer participation and management capabilities, integrate distributed energy resources, and implement self-healing functionalities. This is in contrast to the proprietary communication technique for control and monitoring currently used in the existing electrical grid. A system of converged pervasive communication, comprising different heterogeneous networks, is the key enabler to a complex, multidimensional energy delivery system that allows information exchange among a large number of distributed devices over a vast geographic area.
Smart Grid communication is classified as M2M communication, since it involves information exchange between two or more end devices and a remote server situated at a substation or control centre with very little or no human interaction. Smart Grid M2M communication will provide interaction for a set of applications within power generation, distribution and consumer premises with the aim of achieving important goals such as: improving load estimation, facilitating and integrating renewable power generation and enabling consumer energy management capabilities. The communication network must be resilient (i.e. traffic must be able to mitigate failures in the network) and able to guarantee certain Quality of Service (QoS) requirements which include latency, bandwidth and throughput, before these functionalities can be successfully carried out. Since most existing communication technologies vary in their ability to provide a certain QoS, they will have to be deployed at different levels of Smart Grid network to provide optimal flexibility and scalability.
Presently, most commercially available Smart Grid applications are limited to smart metering and non-real time demand side management. However, Smart Grid’s ambitious goals go far beyond these two applications to include Electronic Vehicle Charging (EVC), power quality measurement and other applications to be developed. Utility companies are now considering the implementation of other prospective applications and develop a much more reliable, resilient and future-proof network to satisfy current and future communication needs.
14
The focus of the study is then placed on routing in Smart Grid’s NAN with emphasis on ad hoc WMN and the OLSR protocol which is the research area of this thesis.
2.2.
Legacy in the Electrical Grid
Since its inception, the traditional electrical grid involves large centralised generation of electrical energy from different energy sources, mainly fossil fuels, transmitted in bulk over long distances through high voltage transmission lines to a distribution substation. The electricity is then distributed to end users at low voltages (< 240 V). There have been a lot of technological advances in power generation from nuclear, gas turbines and renewable energy sources (solar and wind energy) (Erlinghagen and Markard, 2012), however, transmission and distribution, which are core parts of the electricity sector has experienced very little or no change over the last 100 years (Bauknecht, 2011). This is evident in the fact that even in societies with advanced technologies, the only way utility companies know there is an outage is when a customer calls in to report it. The utility electrical grid has become more unreliable over the years, characterised by frequent brownouts and blackouts. These not only seriously affect the lives of consumers, but also cause substantial economic losses.
Zeng Bo et al (Bo et al., 2015) presented a comprehensive list of recent blackouts and summarised their causes into four categories, namely: environment, inadequate grid structure, management (i.e load forecasting errors) and market aspect (regulatory and tariff system).
Recent awareness of the cost of generation and risks associated with energy sources from fossil fuel depletion and nuclear energy has accelerated the shift towards renewable energy sources. However, renewable energy sources challenge the existing grid architecture, which is not able to cope with a large share of intermittent and possibly decentralised energy sources. Thus, the energy sector is poised for transformation to a Smarter and intelligent grid in order to achieve long term sustainability and reliability. This will not only involve the shift to renewable energy, but also the development of infrastructure that can cope with: a) transmission losses, b) integrating multiple energy sources, and c) enhanced efficient energy distribution and consumption.
15
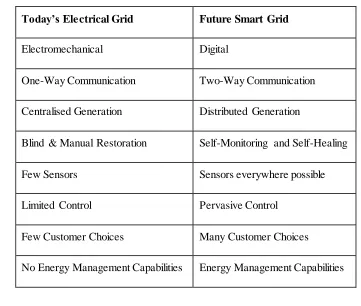
Table 2-1: Comparison of Todays Grid and Future Smart Grid (Farhangi, 2010) Today’s Electrical Grid Future Smart Grid
Electromechanical Digital
One-Way Communication Two-Way Communication
Centralised Generation Distributed Generation
Blind & Manual Restoration Self-Monitoring and Self-Healing
Few Sensors Sensors everywhere possible
Limited Control Pervasive Control
Few Customer Choices Many Customer Choices
No Energy Management Capabilities Energy Management Capabilities
2.2.1.
Distributed Energy and Automation
Nearly 90% of all power outages and disturbances have originated from the distribution network (Glover et al., 2012). This means that the shift towards the Smart Grid should start at the distribution system, which is the bottom of the chain. In Smart Grid, the specification of distributed generation over centralised generation is subject to requirements related to the renewable energy and other distributed power sources, as well as their effect on the power-system operation.
16
2.2.2.
Key Utility Applications
A plethora of new applications with variable requirements and features for energy integration and capacity building are expected to emerge in Smart Grid operations. For the purposes of this section, only a selected set of applications which have drawn significant attention from the utility industry and research community is considered. These applications have been classified by the United States (US) Department of Energy (DOE) into six functional categories (Saputro et al., 2012). The following subsections discuss the characteristics and traffic requirements of these applications and highlight their key challenges:
2.2.2.1.
Advanced Metering Infrastructure (AMI)
AMI is regarded as the most fundamental and crucial part of Smart Grid. It is expected to link consumers and power utility companies and provide the foundation for future distribution automation and other Smart Grid functionalities. The system-wide measurement and visibility enabled by AMI will enhance the utilities' system operation and asset management process. AMI is designed to read, measure, and analyse the energy consumption data of consumers through smart meters to allow for dynamic and automatic electricity pricing.
17
2.2.2.2.
Demand Side Management (DSM)
DSM is the action that influences the quantity or pattern of energy consumption by end users. These actions may include targeting reduction of peak demand by end users during periods when energy supply systems are constrained. In the UK, the duration of peak demand times/periods are affected by factors such as weather and holidays which makes it vary for different quarter in a year. However, in most cases, they are between 6.30 am to 9.30 pm (Pout et al., 2008). Energy peak management does not necessarily decrease the amount of total energy consumption, but it will reduce the need for investments on power generation sources or electricity spinning reserves at peak periods (Wang et al., 2011) (Palensky and Dietrich, 2011) (Davito et al., 2010). DSM programs include the following activities:
Demand Response (DR) - DR enables the utility operator to optimally balance power generation and consumption, either by offering dynamic pricing programs or implementing various load control programs. This includes programmes aimed at reducing energy consumption during peak usage hours by encouraging customers through various incentives to limit their usage or shift them to other periods. Examples of incentives based on DR:
I. Direct Load Control: utility or grid operator gets free access to customer processes. II. Emergency demand response programs: voluntary response to emergency signals. III. Capacity market programs: customers guarantee to pitch in when the grid is in need. IV. Demand bidding programs: customers can bid for curtailing at attractive prices
Time based load management - This is achieved through dynamic pricing which helps to reduce energy consumption during peak hours and encourage customers to limit energy usage or shift demand to other periods. Examples of Time based load management include:
I. Time of Use (TOU) - Achieved by dividing the day in to contiguous blocks of hours with varying prices. The highest price is allocated to the on-peak block.
II. Real Time Pricing (RTP) - The price is tied to the real market cost of delivering electricity and may be varied hourly.
III. Critical Peak Timing (CPT) – a less predetermined variant of TOU (only applied on a relatively small number event days).
IV. Peak Time Rebates (PTRs): Electricity rebates given to customers for minimising power usage during peak periods.
Conservation of energy through load control programs, this involves performing remote load control programs where communicating networks are used to control usage of appliances remotely to use less energy across many hours. The remote load control programs can be classified into the following:
18
load control signals to interrupt and reschedule the load process are required to ensure that when the waiting period of the load is over, the rebound of the load to the grid does not cause additional congestion (Palensky and Dietrich, 2011).
II. Reducible Loads – refers to loads that can be reduced to lower levels for certain periods of time. Examples of this type of loads include – refrigerators and air conditioners which can have their thermostats adjusted to higher temperatures to reduce load. III. Partially Interruptible Loads – as the name implies, refers to loads that can be partially
interrupted over peak periods by limiting the run-time cycle. Examples of the loads that can have their runtime cycles reduced are washing machines.
2.2.2.3.
Wide Area Situational Awareness (WASA)
WASA involves near real-time monitoring, protection and control of the power grid across large geographical areas. It requires collating information on the description of the current state of the power grid in the area concerned. The information is then analysed in order to diagnose the current situation, or predict the evolution of the power grid state under different operational conditions and energy control strategies (Zhang et al., 2010) (Terzija et al., 2011) (Johnson et al., 2011). WASA application traffic requires very high frequency or granularity of information in order of milliseconds, collected from the transmission networks and electric substations, about the state of the power grid (Wang et al., 2011). The information is used to provide timely prevention of power disruption and to optimise the performance of the grid. WASA information is also used to implement monitoring (Wide Area Monitoring Systems or WAMS), Control (Wide Area Control Systems or WACS) and for Protection (Wide Area Protection Systems or WAPS) (Khan and Khan, 2013). This is achieved by using hundreds of Phase Measurement Units (PMU) to provide accurate system state measurements in near real-time. GPS is used to provide a timestamp for each measurement (Phadke and Thorp, 2008).
2.2.2.4.
Distributed Energy Resource (DER) and Storage
19
2.2.2.5.
Electric Vehicle (EV) Monitoring and Control:
This involves monitoring the activities of plug-in electric or hybrid electronic vehicles (PEV or PHEV) that are expected to enhance or replace fossil fuel transportation systems. Electric Vehicles (EV) use one or more electric motors which are powered by a rechargeable storage device in the vehicle. The connection of the storage device on an EV to the electrical grid to recharge is called Grid to Vehicle (G2V) flow. In the event where an EV is connected to the electrical grid to discharge electric power back to the grid when it is not being used, the process is known as Vehicle to Grid (V2G).
EV charging systems must be well managed, as high concentrations of charging requests within a short period can cause severe overloading in the distribution network. Smart charging concepts that enable controlled charging have been proposed to mitigate the problem of overloading the distribution circuit (Khan and Khan, 2013) (Sortomme et al., 2011). They incorporate DR programs known as “demand dispatch”, which aggregate a large number of controllable loads like EVs to improve the energy efficiency of the grid by optimally balancing its load supply profile. The key instrument behind smart charging is a centralised EV charging controller (EVCC) which is located at the utility control centre. The EVCC is responsible for coordinating each energy transfer session in real-time to accommodate the time-varying nature of the total available power and the number of EVs being charged. In order to accomplish this, the EVCC sends control signals to the EV charging station (EVCS). It also receives the state of charge (SoC) of the battery from the EVCS through the communication networks. It is important to note that fast and reliable transfer is a key requirement for EV charging systems. This is because, the SoC update messages are very critical for EV charging applications, since the controller relies on them to adjust the charging rate. They are also delay sensitive because the charger may remain idle and energy may only be transferred (hence, wasted) until a status against the SoC update message is received (Khan et al., 2013).
2.2.2.6.
Distributed Grid Management (DGM)
This encompasses the various Smart Grid automation technologies for real-time information and remotely controlled devices. This also provides utility companies with a comprehensive suite of applications and tools for efficient, reliable and cost effective management of distribution networks. The applications involve technologies that can integrate different grid applications such as Substation Automation, Video Surveillance, SCADA and Automatic Vehicle Location (AVL) used for directing workforce to locate faults that need to be repaired (Seal and Uluski, 2012).
20
21
Table 2-2: Smart grid applications network bandwidth and latency requirement (Locke and Gallagher, 2010) (Khan and Khan, 2013) (Tsado et al., 2015b)
Smart Grid Applications
Network Requirement (Throughput)
Traffic Type Latency Criticality
AMI (Billing, Metering)
10 - 100 kbps/node, 500 kbps backhaul
Periodic 2 - 15 s Low
DSM (DR, Dynamic Pricing and Load Control)
14 - 100 kbps per node per device
Periodic/Random 500 ms to several min Medium,/High WASA (WAMS, WAPS, WACS)
600 - 1500 kbps Random 20 - 200
ms
High
EV Monitoring 9.6 – 56 kbps, 100 kbps is a good target
Random 2s – 5
min
High
DGM 9.6 – 100 kbps Periodic/Random 0.1 – 2 s High/Medium
Video surveillance 15 – 128 kbps, camera Random 1 s Medium
Operational telephony
8 kbps, call Random 1 s High
SCADA 1.8 – 9.6 9.6 kbps Random < 0.5 High
22
2.2.3.
Data Management
Integration of distributed generation and ever increasing utility applications bring a huge amount of growth in the volume of data that must be managed by the utility company. The evolution of Smart Grid drives has led to a massive increase in the deployment of sensor and actuators (IEDs for SCADA and smart meters), this has resulted in accumulation of enormous sums of data associated with these devices. In order to extract the most value from Smart Grid’s data, it is essential for utility companies to develop a data management strategy that takes into account collection, correlation, and analysis of data from disparate sources for conversion into actionable information for grid management and business functions.
Snart Grid’s data analysis includes customer analytics, asset analytics and financial analytics, and the practical techniques to support these data analytics are just emerging. The electrical grid will not be smart from just storing time household usage data, unless knowledge patterns are generated in real-time and humans can convert this into actionable processes. For example, suppliers should be able to determine house hold utility profiles (or demand profiling) from gas and electricity usage and adjust costs appropriately for billing purposes. This is why novel techniques are being explored to analyse collected data readings in order to identify and explain electricity usage patterns. The techniques include recent advances in data mining and machine learning algorithms for handling and capturing useful patterns on Smart Grid’s data.
Smart Grid’s data refers to volume, velocity and variety of data, and researchers have begun to explore some of these efforts (Han et al., 2013) (Bryant et al., 2005) (Feller et al., 2013). Currently, it has been observed that data processing with single machines is inhibited by resources (memory and processor speed). An alternative cost-effective solution being explored is horizontally scaling several machines over low-cost networks and storage.
Apart from data security and privacy concerns, other technological challenges of data management include the variability of communication standards due to encoding of data in different specifications and propriety formats. Hence, a typical Smart Grid management system must consist of the following:
23
Data types and handling methods: Data available for processing at the utility companies ranges from structured data to semi-structured and unstructured data. Data with a specific format like meter data, temperature, voltage and geographical coordinates are referred to as structured data, while, unstructured data refers to pictures, audio and video files. The use of middleware systems and complex event processing is required for handling and processing synchronous and asynchronous (event) data in an efficient manner, to deal with information which requires quick response (Budka et al., 2014).
Data Quality: Accuracy, timeliness, and relevance to specific task being performed are some of the characteristics of good-quality data. Thus, the degree of quality required is significantly dependent on the application data being analysed. For example, in billing applications, a periodic data feed with hourly updates or less would suffice. Whereas, in power flow state estimation and voltage control applications, it is critical to have quality data in a timescale of seconds to minutes, since real-time computations are being made using these quality data at a resolution of 50 or 60 samples per second.
2.2.4.
End-to-End Communication
A reliable and effective communication infrastructure with low latency all through the Smart Grid network is required to coordinate and integrate the DER with DGM and the consumer. As earlier stated, Smart Grid network infrastructure is expected to be heterogeneous with seamless interoperability, to successfully meet performance requirements and achieve Smart Grid functionalities. Although a consensus about the architecture and scope of a highly cross-functional infrastructure for Smart Grid has not been reached, some sub-networks have been widely accepted across several domains on the electrical grid. Communications network viewpoint of IEEE P2030 provides sub-network components that interconnect the Smart Grid generation and distribution as well as the transmission and customer premises to form an end-to-end Smart Grid communication model. Derived from (IEEE Standards Association, 2011) and (Saputro et al., 2012), Figure 2-1 shows a communication model for information transmission from home, business and field areas to the control centres. Smart Grid end-to-end communication network is made up of sub-networks which are described briefly in the following sub sections.
2.2.4.1.
Home Area Networks (HAN)
24
25
Figure 2-1: Network components for end-to-end communication in Smart Grid (Saputro et al., 2012)
Utilities/Control/Operations Centers
Field
Devices
Power
Plant
Field
Devices
Field
Devices
Field
Devices
Smart
Meter
Home
Appliances
Generation
Transmission
Distribution
Customer Premises
26
2.2.4.2.
Neighbour Area Networks (NAN)
NAN can be regarded as a logical AMI system that connects customer premises and the utility control centre. NAN can be said to involve networks of multiple HANs that deliver the metering data to data-concentrators and deliver control and information data to HANs. Many wireless metering gateways of home/field areas may connect to each other to form a possible wireless mesh network (Gao et al., 2012). For example, smart meters acting as gateways for in-home application data can be used as wireless mesh nodes to transfer information. Smart meters are the major constituent of NAN, acting as the interface between private networks and Utility control centres. NAN end points are either smart meters at the customer end or data concentrators to a group of smart meters at the utility end, which send the aggregated information to the MDMS via a backhaul network (Khan and Khan, 2013).
2.2.4.3.
Field Area Network (FAN)
A FAN is a network of field devices such as feeder equipment, transformers, switches and circuit breakers in the transmission and distribution substations that facilitate information exchange between utility control centres. High voltages are usually converted to low voltage as required by homes, businesses and industries. The electricity supplies to customer premises are carried out through the distribution feeder equipment which includes transmission lines and cable poles. Smart Grid FANs will include RTUs, PMUs and Programmable controllers to perform substation automation functions. Automation functions using this terminal unit may be carried out according to embedded logic, or by an external operator/utility command which overrides the internal or local commands. FAN is also responsible for communicating to the utility control, information on DER/micro grids which are connected to the distribution grid (Wang et al., 2011) (Ancillotti et al., 2013a) and (Khalifa et al., 2011).
2.2.4.4.
Wide Area Networks (WAN)
27
2.2.4.5.
Mobile Workforce Networks
Mobile Workforce networks are used to provide routine maintenance and operation services by the utility workforce/employees. The network requirements include broadband connectivity that will enhance VOIP, Virtual Private Network (VPN) and geographic information system (GIS) based applications for asset management and logistics. In addition, in-vehicle applications and fleet telematics such as Automatic Vehicle Location (AVL) and location-based services (LBS) with global positioning system (GPS) based tracking and navigation are expected to be integrated with the Mobile Network Work Force.
2.3.
Smart Grid Communication Architecture
Understanding the smart grid architecture is vital for identifying and addressing the needs and requirements of the complex end-to-end communication. The most widely accepted Smart Grid architectures are:
1) A model for Smart Grid information networks proposed by the US National Institute of Science and Technology (NIST) architecture (Locke and Gallagher, 2010), which identifies actors, communication pathways, domain interactions, potential applications and capabilities enabled by the interactions in Smart Grid;
2) CEN-CENELEC-ETSI Smart Grid Coordination Group proposed a Smart Grid Architecture Model (SGAM) Framework which aims to offer support for the design of Smart Grids use cases with an architectural approach, allowing for a representation of interoperability viewpoints in a technology neutral manner, both for current implementation of the electrical grid and future implementations of the Smart Grid, and (CEN-CENELEC-ETSI, 2012);
3) The IEEE 2030-2011 standard which provides guidelines regarding Smart Grid architecture and interoperability reference model (SGIRM) (IEEE Standards Association, 2011). SGIRM uses a system-level approach to provide guidance on interoperability among various components of communication, power systems and information technology platforms in the Smart Grid.
28
Grid, using the International Telecommunication Union’s (ITU) Ubiquitous Sensor Network (USN) architecture. The network architecture successfully adapts and applies the ITU-Telecommunication Standardisation Sector USN Next Generation Network (ITU-T USN /NGN) system to Smart Grid architecture to allow better management of QoS and facilitate interoperability with other technologies. The USN based heterogeneous communication architecture for Smart Grid is adopted in this research as the platform for seamless and efficient end-to-end Smart Grid communication.
2.3.1.
Adaptation of USN layers for Smart Grid
Integrating the actions of consumers and generators in an electrical grid will involve a system of distributed sensor nodes that will interact with themselves as well as with the electrical infrastructure to provide and process information extracted from the physical world. Applications of sensor nodes can be assigned to any of the following three useful elements in Smart Grid applications (ITU-T Technology Watch Briefing Report Series, February 2008):
Detection – e.g., measure temperatures of transformers, pressure, sound, humidity and motion of intruders on electrical equipment.
Tracking – e.g., household items or equipment, supply and distribution of electricity, plug in electrical vehicles in intelligent transport systems.
Monitoring – e.g., monitoring of inhospitable environments such as volcanoes, hurricanes and storms that may affect the grid.