Abstract—The choice of manpower policy is very strategic. Manpower policy affects the wage bill, the total product of labour, a firm’s utility, as well as the historical probabilities of losses, gains and promotions. Hence, optimum policy that maximizes utility for both the workforce and the firm should be the equilibrium policy according to game theoretic predictions. Hence, evaluation tools, such as game theory, that take into account the manpower policy economics and dynamics, should evaluate alternative manpower policies very effectively. In this work a combination of Markov manpower model and game theoretic modelling is used to obtain optimal/equilibrium manpower policy. An oil company operating in the oil rich Niger Delta Region of Nigeria was used as case study. The results of the study show that game theoretic analysis would be a very useful tool for manpower policy planning and evaluation. In addition the model gives a more refined equilibrium wage policy than prescribed by Nash’s wage bargaining model.
Index Terms—Manpower planning; Game theory; Markov processes; Stochastic processes
I. INTRODUCTION
uite a substantial number of business organizations in the world experience one form of manpower problem or another. This especially true in the oil-rich Niger Delta Region of Nigeria where a large number of firms, mostly indigenous companies, in the oil industry experience large labour turnover. Quite often many business organizations fail to motivate their workforce. Motivating the work force is very critical to the survival of any business organization. Hence, optimal manpower policies must always be sought by serious minded business enterprises. In a similar vein, a lot of industrial organizations have been run underground by unmotivated workers. Nigerian firms are not exempt from this. Practices by these workers that contributed to the collapse of these enterprises include but not limited to:
a. Fraudulent sale of company properties.
b. Soldering which culminate in low productivity to punish management.
c. Vandalization of company properties.
d. Fraudulent turn around maintenance (TAM) contracts.
e. Inflated procurement contract prizes, including over invoicing.
Manuscript received October 17, 2013; revised July 06, 2014.
C. C. Nwobi-Okoye is with Anambra State University, Uli, Nigeria
(phone: 234-08060013240; e-mail:nwobi@
ansu.edu.ng;[email protected]).
A. C. Igboanugo is with Production Engineering Department, University of Benin, Nigeria (e-mail: [email protected]).
f. Lack of competitive bidding in supply contract award.
g. Procurement of low quality spares, etc.
The choice of manpower policy is very strategic especially in this age of globalisation and rapid technological advancement. Motivated workforce can make any organization realize its goals effectively. This assertion is built around the motivation principle that what gets rewarded gets done. There are many approaches to manpower policy analysis and planning. The literature has reported four methods and they include: Markov chain models, computer simulation models, optimization models and supply chain management through System Dynamics [1].
Markov chain analysis has been at the heart of manpower policy analysis and assessment. Markovian models have been used to estimate distribution of future manpower as well as to maintain new recruitment and promotion or firing policies (see Kennington et al. [2], Abodunde and McClean [3], Zanakis and Maret [4], Price et al. [5], Bartholomew [6], Edwards [7], and Raghavendra [8]). A combination of Markov models and linear programming is used to obtain optimal policies taking into account not only the manpower requirements but also costs and conflicting objectives (see Young and Abodunde [9], and Zanakis and Maret [10]). Young and Abodunde related manpower policy to manpower capacity planning, an aspect of production planning. In their paper, they assumed that different manpower policies could cause either lead to undercapacity or overcapacity which leads to overproduction or underproduction to which they assigned costs. Hence, they used the principle of mathematical programming using Markov manpower modelling as the decision variable and minimization of the cost of overproduction or underproduction as their objective function in order to arrive at the optimal manpower policy. Zanakis and Maret used goal programming approach in their analysis of optimal manpower requirements.
In the setting of fierce competition among competing firms, choosing the optimal policy is very strategic. Game theory is the best decision making tool when active opponents are involved. With stiff competition existing among many firms in the modern world, it is obvious that game theoretic approach to manpower planning would be invaluable. The earliest attempt to use game theory in manpower planning was due to John Nash [11], [12]. Nash developed his wage bargaining model in order to obtain the equilibrium wage
Application of Game Theory to Manpower
Policy Development
Chidozie Chukwuemeka Nwobi-Okoye, Member, IAENG and Anthony Clement Igboanugo
policy for firms intending to higher workers. Nash’s model is deterministic. The model used calculus and assumed zero wastage in order to determine the equilibrium wage. Secondly, Nash’s model assumed that wage alone determines the manpower policy. But in practice, these assumptions are rarely true. For example, a firm may offer lower wage but other conditions of employment may be very favourable such that job seekers might prefer them to others who offer higher wages but employment conditions are generally unfavourable. Secondly, employment conditions are not generally clear to recruits until after acclimatization within the organization. Furthermore, manpower flow is stochastic, hence in order to obtain a refined equilibrium manpower/wage policy statistical analysis is necessary.
In this work an attempt is made to combine Markov models and game theory in order to obtain equilibrium manpower policy among competing policies according to game theoretic prescriptions. This approach measures not only manpower flow but takes into account economic considerations in order to obtain the optimal/equilibrium policy. The presentation in this work is kept simple enough to be understood by management science/operations research (OR) professional and students. An industrial case study was used for illustration.
II. THEORETICAL BACKGROUND A. Games Theory
Game theory is a branch of applied mathematics that is applied in many fields including: economics, managment, engineering, psychology, computer science, sociology, biology and political science. Game theory mathematically capture behaviour in strategic situations where an individual’s chances of making success based on his choices depends on the choice of others.Game theory studies the ways in which strategic interactions among rational players produce outcomes with respect to the preferences (or utilities) of those players, none of which might have been intended by any of them. Since the mathematical theory of games was formalized by John von Neumann and Oskar Morgenstern [13], a lot of work has been done to expound and advance the theory of games. There are many types of games but the emphasis in this work is on Markov queue game [14]. For better understanding of the concepts in game theory, there is a rich literature and these include: Binmore [15], von Stengel and Turocy [16], von Stengel [17], Osborne [18], Fudenberg & Tirole [19], Ritzberger [20], Nwobi-Okoye [21], Nwobi-Okoye [22], Nwobi-Okoye [23], Nwobi-Okoye [24], Nwobi-Okoye [25]etc.
B. Markov Queue Game
DEFINITION: A general Markov queue game is defined as a game with a finite set of players i Є J, a grand/secondary payoff matrix, GG, a set of strategies, V = (V1, V2, V3, V4 … Vn) for each player with each strategy
tied to a payoff matrix, G, an associated probability
matrix/vector, E (v), and an effective payoff matrix, Gev,
where Gev = E (v) ∙Gn.
C. Markov Chain Model for Manpower Planning
Consider a Markov process which has state space S such that:
S = {1, 2, 3, …k} The states are: M = {1, 2, 3 … k}
These represent various manpower states, such as: active staff, recruitment, wastage, retirement etc. Wastages refer to any of the situations when recruited staff leaves an organization in any manner other than retirement. They include: termination, sack, dismissal, interdiction, resignation, redundancy, diseased, blank, voluntary withdrawal
Denoting PTij as the transition probability of the system
from state i to state j, the transition matrix is defined as
kk
P
k
P
k
P
k
P
P
P
k
P
P
P
...
2
1
...
...
...
...
2
...
22
21
1
...
12
11
PT
=
Workforce systems could be described by the terminology: stocks and flows (Bartholomew et al, 1991). The stock
)
(t
n
i is the expected number of people in class i at time t. The flown
ij(t
)
=n
i(
t
)
PT
ij denotes the expected number of members moving from class i to class j in an interval of unit length of time from t to t + 1 withPT
ij being the transition probability that an individual in class i at the start of the time interval sitting in class j at the end [6]. The transition probabilities PTij could be estimated from thehistorical data of stocks and flows using the method of maximum likelihood [6], [26], [27].
∑
∑
=
t i t
ij
t n t
n
) ( )
(
T Pˆ
ij
D. The Markov Game Theory Model
Game Characteristics and Assumptions
The game model used in the analysis in this work is based on the following characteristics and assumptions:
1. The game corresponds to model/variant 2 of the game developed by Nwobi-Okoye [14].
2. An infinite population source [28], [29] which represents the population from which the possible number of potential recruits could be drawn. 3. There is no possibility of moving from an
absorbing state to any other state.
Mathematical Analysis
Here it is assumed that competitors try to use strategies (manpower policies) that would attract and retain employees in their respective organizations. The potential employees could queue behind any organization they wish to be employed in. The entire mathematical analysis is based on the model developed by Nwobi-Okoye [14].
Since the game corresponds to variant 2 as has earlier been mentioned, the applicable equations for modelling the game theoretic aspect of manpower policies are:
EG = P∙G ………. (1)
The dot operator in equation 1 carries out the operation of multiplying each payoff by its associated probability of occurrence.
GT=G– R ……….………..… (2) Here R is the payoff reduction.
R represents the extra cost incurred due to the specific manpower policy implementation.
...(4)
...
...
....(3)
...
...
Y
R
IYJY
G
IYJY
GT
X
R
IXJX
G
IXJX
GT
−
=
−
=
EG=PT∙GT ………..……….. (5)
The grand payoff matrix, GG, is shown in Figure 1.
NY NY GG NX NX GG Y NY GG X NX GG Y NY GG X NX GG N
NY Y GG NX X GG Y Y GG X X GG Y Y GG X X GG
NY Y GG NX X GG Y Y GG X X GG Y Y GG X X, GG
N
, , , ... 2 , , 2 , 1
, , 1 ,
. .
. .
. .
. .
. .
. .
, 2 , , 2 ... 2 , 2 , 2 , 2 1 , 2 , 1 , 2 2
, 1 , , 1 ... 1 , 1 , 1 , 1 1 , 1 , 1 1 1
... 2
1
Figure 1: Grand payoff matrix, GG Here
GGiX,jX = the cumulative payoff for player X in the effective
payoff matrix, EG, when X uses strategy i-1. GGiY,jY = the
cumulative payoff for player Y in the effective payoff matrix, EG, when Y uses strategy j-1. The strategies are denoted by numbers 1 to N.
∑
=
∑
=
=
N
I
N
J
IYJY
EG
IYJY
GG
1 1
(6)
...
...
∑
=
∑
=
=
N
I
N
J
IXJX
EG
IXJX
GG
1 1
(7)
...
...
N= maximum value of strategies i.e. possible number of manpower policies/strategies.
Replacing E (v) with the manpower transition probabilities matrix PTij, a Markov queue game applicable to manpower
planning is redefined as a game with a finite set of players i Є J, a grand/secondary payoff matrix, GG, a set of strategies, V = (V1, V2, V3, V4 … Vn) for each player with
each strategy tied to a payoff matrix, Gn, an associated
probability matrix/vector, PTij, and an effective payoff
matrix, Gev, where Gev = PTij∙Gn.
In order to obtain the payoffs from the policies we consider the firms utility function which is given by (Carmichael, 2005):
(8)
)
(
Lw
L
TP
w
f
U
=
−
where TPL is the total product of labour, the total
contribution of labour to output, L is the number of workers employed by the firm, w is the wage per worker and Lw is the wage bill. With this utility function, the firm like the union, is risk neutral and the firm’s utility is equal to its profits if labour is the firm’s only input and product price equals 1. In this case if the wage per worker w is equal to the average product of labour,
L
L
TP
, the firm profits are zero.
Hence,
(w
)
f
U
constitute elements of the payoff matrix Gn.Thus the equilibrium of the game GG [30], i.e. the equilibrium/optimal manpower policy, is given by:
(9)
)
(
max
Ri
P
i
Lw
Li
TP
−
Or
(10)
)
(
max
Ri
P
w
fi
U
Where
Ri
P
is the proportion of manpower of player/policy i that stays till retirement. Since the payoff from wastages is assumed to be zero (0).III. METHODOLOGY
ܲ
, represents elements for competitor y assuming a 2-persons game. The strategies are denoted by numbers 1 to N.1 2 … ܰ
1
2
⋮
ܰ
ተ
ܲ
ଵ,ଵܲ
ଵ,ଵܲ
ଵ,ଶܲ
ଵ,ଶ… ܲ
ଵ,ேܲ
ଵ,ேܲ
ଶ,ଵܲ
ଶ,ଵܲ
ଶ,ଶܲ
ଶ,ଶ… ܲ
ଶ,ேܲ
ଶ,ே⋮
⋮
⋮
⋮
ܲ
ே,ଵܲ
ே,ଵܲ
ே,ଶܲ
ே,ଶ… ܲ
ே,ேܲ
ே,ே [image:4.595.47.285.102.186.2]ተ
Figure 2: Transition Matrix, P Proposition 1
Let represent elements of competitor X of
the matrix GG at period n and
1
1
+
+
JX
n
n
IX
GG
atperiod n+1. It follows that
1
1
+
+
<
n
JX
n
IX
GG
n
JX
n
IX
GG
provided the equilibrium of the transition matrix P is not reached at period n.
Corollary
Similarly,
provided the equilibrium of the transition matrix P is reached at period n.
Proof
It can easily be shown that for the transition matrix P, that
N
i
Provided
,
1
)
(
≠
∑
∞
=
≠
∞
n
n
ii
P
Therefore, each state is transient except N. Since state N is the absorbing state and transition matrix P is reducible; hence, at equilibrium the probability of staying at state N is one, while the probability of staying in any other state is
zero. But from equations 6 and 7
∑
=
∑
=
=
N
I
N
J
EG
IX
n
JX
n
n
JX
n
IX
GG
1
1
and. It follows that provided the equilibrium of the transition
Matrix P is not reached,
1
1
+
+
<
n
JX
n
IX
GG
n
JX
n
IX
GG
.□
Proposition 2
For a given payoff reduction factor z, if strategy n is
necessarily be optimal at period n+1 provided the equilibrium state of the transition matrix P is not reached at period n and the game is not biased in favour of any player.
Corollary
For a given payoff reduction factor z, if strategy n is optimal i.e. an equilibrium at period n, it is also optimal at period n+1 provided the equilibrium state of the transition matrix P is reached at period n and the game is not biased in favour of any player.
Proof
Assuming some values of payoff reduction factor z denoted by z1 and z2 .Let
ܩܩ
ூ
భ
భ represent the gain forcompetitor X while playing the optimal strategy n at period n when the payoff reduction factor is z1 and
ܩܩ
ூ
ሺశభሻమ
ሺశభሻమ represent the gain for competitor X while playing the optimal strategy n at period n+1 when the payoff reduction factor is z2. Since z1=z2 and from proposition 1 it is shown that at equilibrium1
1
+
+
=
n
JX
n
IX
GG
n
JX
n
IX
GG
, it follows that fora given payoff reduction factor z, if strategy n is optimal i.e. an equilibrium at period n, it is also optimal at period n+1 provided the equilibrium state of the transition matrix P is reached at period n and the game is not biased in favour of any player.
IV. APPLICATION CASE STUDY
Consider a Markov process which has state space S such that:
S = {1, 2, 3, 4} The states are: M = {1, 2, 3, 4}
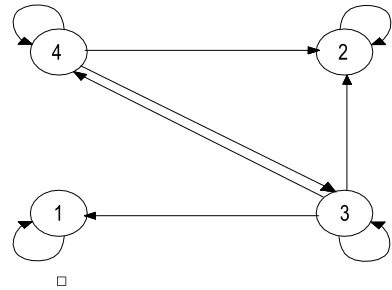
The states represent various manpower states. State 1 assumes that manpower retirement occurred; state 2 assumes that wastage occurred; state 3 assumes the staff is in active employment of the firm while state 4 assumes that the staff is newly recruited.
The transition diagram for the system is shown in Figure 3 below:
4
3
1
[image:4.595.343.539.607.752.2]2
Figure 3: Transition Diagram for the manpower transitions
n
JX
n
IX
GG
1
1
+
+
=
n
JX
n
IX
GG
n
JX
n
IX
GG
∑
=
∑
=
+
+
=
+
+
N
I
N
J
EG
IX
n
JX
n
n
JX
n
IX
GG
1
1
1
1
An oil company at Port Harcourt, in the oil rich Niger Delta region of Nigeria is used as our case study. Two manpower policies were analysed in order to obtain the optimal/equilibrium policy.
A. Policy 1
[image:5.595.46.233.511.673.2]In this case, 5 year manpower data of the oil service company in Port Harcourt, Rivers State, Nigeria was obtained as shown in Table 1. The manpower policy that resulted to Table 1 involves irregular recruitment, strict sack policy and pull-system of promotion.
Table 1: Company’s Manpower Statistics
S/N ITEM DESCRIPTION NUMBER
1 Retirement 692
2 Wastages 1,903
3 Active Staff 35, 758
4 Recruitment 1,840
Markov chain analyses was used to determine the proportion of recruited staff that go on retirement and the proportion that are wasted as shown in the following analysis.
Solution
The states are: 1(Retirement), 2 (Wastages), 3 (Active Staff), 4 (Recruitment)
Consider Table 1 above, since states 1 and 2 are absorbing states, the proportion ‘P’ of active staff (state 3) that either move to states 1, 2, 3 or 4 is determined thus:
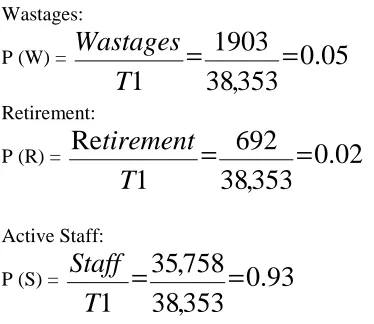
Let T1 = Wastages + Retirement + Active Staff T1 = 38,353
Wastages:
P (W) =
0
.
05
353
,
38
1903
1
=
=
T
Wastages
Retirement:
P (R) =
0
.
02
353
,
38
692
1
Re
=
=
T
tirement
Active Staff:
P (S) =
0
.
93
353
,
38
758
,
35
1
=
=
T
Staff
The proportion ‘P’ of recruited staff (state 4) that either move to states 1, 2, 3 or 4 is determined thus:
Let T2 = Wastages + Active Staff + Recruitment T2 = 39,501
Wastages:
P (W) =
0
.
05
501
,
39
1903
2
=
=
T
Wastages
Active Staff:
P (S) =
0
.
90
501
,
39
758
,
35
2
=
=
T
Staff
Recruitment:
P (W) =
0
.
05
501
,
39
1840
2
Re
=
=
T
cruitment
The description of the various transition probabilities are as follows:
1
11
=
P
0
12
=
P
0
13
=
P
0
14
=
P
0
21
=
P
1
22
=
P
0
23
=
P
0
24
=
P
02
.
0
31
=
P
0
.
05
32
=
P
0
.
93
33
=
P
0
34
=
P
0
41
=
P
0
.
05
42
=
P
0
.
90
43
=
P
05
.
0
44
=
P
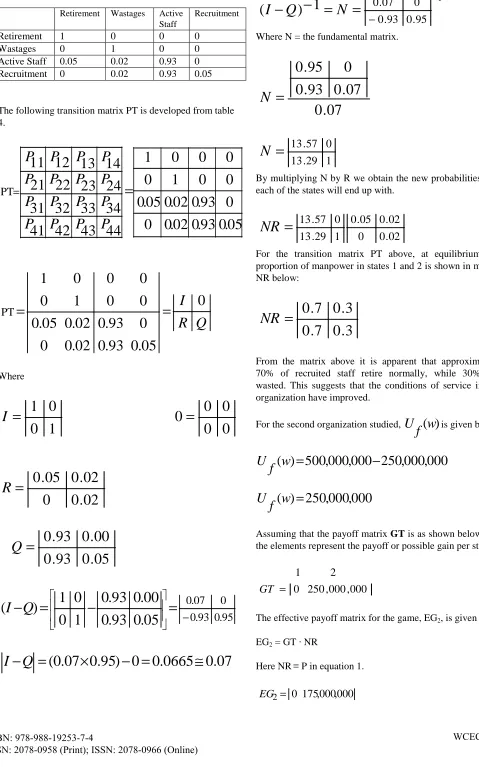
Table 2: The Transition Matrix
The following transition matrix PT is developed from Table 2.
05
.
0
90
.
0
05
.
0
0
0
93
.
0
05
.
0
02
.
0
0
0
1
0
0
0
0
1
44
43
42
41
34
33
32
31
24
23
22
21
14
13
12
11
PT
=
=
P
P
P
P
P
P
P
P
P
P
P
P
P
P
P
P
Retirement Wastages Active Staff
Recruitment
Retirement 1 0 0 0
Wastages 0 1 0 0
Active Staff 0.02 0.05 0.93 0
[image:5.595.297.569.519.593.2]Q
R
I 0
05
.
0
90
.
0
05
.
0
0
0
93
.
0
05
.
0
02
.
0
0
0
1
0
0
0
0
1
PT
=
=
Where1
0
0
1
=
I
0
0
0
0
0
=
05
.
0
0
05
.
0
02
.
0
=
R
05
.
0
90
.
0
00
.
0
93
.
0
=
Q
Multiplying the transition matrix PT by itself to infinity we obtain the steady state probabilities of the transition matrix, hence:
ܲܶஶ= ฬܫ 0 ܴ ܳฬ
ஶ
= ฬܴሺܫ + ܳ + ܳܫଶ+, . . +ܳஶ ܳ0ஶฬ ሺ11ሻ
Remembering that the sum to infinity of a geometrical progression is given by:
(12)
1
r
a
S
−
=
∞
Where a = first term and r = common ratio.
0
1
)
(
0
−
−
=
∞
Q
I
R
I
PT
If
b
d
c
a
Q
I
−
)
=
(
then
N
a
c
b
d
bc
ad
Q
I
=
−
−
−
=
−
−
)
1
1
(
95
.
0
90
.
0
0
07
.
0
05
.
0
90
.
0
00
.
0
93
.
0
1
0
0
1
)
(
−
=
−
=
−
Q
I
07
.
0
0665
.
0
0
)
95
.
0
07
.
0
(
≅
=
−
×
=
−
Q
I
195
.
0
90
.
0
0
07
.
0
1
)
(
−−
=
=
−
−
Q
N
I
Where N = the fundamental matrix.
07
.
0
07
.
0
90
.
0
0
95
.
0
=
N
1
86
.
12
0
57
.
13
=
N
By multiplying N by R we obtain the new probabilities that each of the states will end up with.
05
.
0
0
05
.
0
02
.
0
1
86
.
12
0
57
.
13
=
NR
For the transition matrix PT above, at equilibrium the proportion of manpower in states 1 and 2 is shown in matrix NR below:
7
.
0
3
.
0
7
.
0
3
.
0
=
NR
From the matrix above it is apparent that approximately 30% of recruited staff retire normally, while 70% are wasted. This suggests that the conditions of service in the organization are relatively poor. Hence, the manpower policy requires drastic improvement in order to reduce wastages.
In order to obtain the payoffs from the policies equation (8) was used. Hence:
)
(
w
TP
L
Lw
f
U
=
−
For the first organization studied,
(w
)
f
U
is given by:000
,
000
,
200
000
,
000
,
500
)
For wastages it is assumed that
(w
)
f
U
=0.Assuming that the payoff matrix GT is as shown below and the elements represent the payoff or possible gain per state.
000
,
000
,
300
0
2
1
=
GT
The effective payoff matrix for the game, EG1, is given by:
EG1 = GT ∙ NR
Here NR≡ P0 in equation 1.
000
,
000
,
90
0
1
=
EG
Possible total payoff for state 1 = 0
Possible total payoff for state 2 = 90,000,000
The transition and payoff matrices P0 and GT above
represent the state of the game using strategy 1 or manpower policy 1. The matrix NR represents the long term labour/manpower reaction to the utility state
(w
)
f
U
.B. Policy 2
[image:7.595.303.488.49.197.2]The manpower policy of the company was changed. The new manpower policy involves constant yearly recruitment, relaxed sack policy and push-system of promotion. In this case, 5 year manpower data the oil service company is as shown in Table 3.
Table 3: Company’s Manpower Statistics
S/N ITEM DESCRIPTION NUMBER
1 Retirement 1,903
2 Wastages 692
3 Active Staff 35, 758
4 Recruitment 1,840
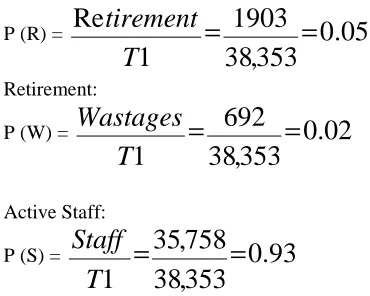
Markov chain analyses was used to determine the proportion of recruited staff that go on retirement and the proportion that are wasted as shown in the following analysis. The states are: 1(Retirement), 2 (Wastages), 3 (Active Staff), 4 (Recruitment)
Consider Table 2 above, since states 1 and 2 are absorbing states, the proportion ‘P’ of active staff (state 3) that either move to states 1, 2, 3 or 4 is determined thus:
Let T1 = Wastages + Retirement + Active Staff T1 = 38,353
Wastages:
P (R) =
0
.
05
353
,
38
1903
1
Re
=
=
T
tirement
Retirement:
P (W) =
0
.
02
353
,
38
692
1
=
=
T
Wastages
Active Staff:
P (S) =
0
.
93
353
,
38
758
,
35
1
=
=
T
Staff
The proportion ‘P’ of recruited staff (state 4) that either move to states 1, 2, 3 or 4 is determined thus:
Let T2 = Wastages + Active Staff + Recruitment T2 = 38290
Wastages:
P (W) =
0
.
018
290
,
38
692
2
=
=
T
Wastages
Active Staff:
P (S) =
0
.
934
290
,
38
758
,
35
2
=
=
T
Staff
Recruitment:
P (W) =
0
.
048
290
,
38
1840
2
Re
=
=
T
cruitment
The description of the various transition probabilities are as follows:
1
11
=
P
0
12
=
P
0
13
=
P
0
14
=
P
0
21
=
P
1
22
=
P
0
23
=
P
0
24
=
P
05
.
0
31
=
P
0
.
02
32
=
P
0
.
93
33
=
P
0
34
=
P
0
41
=
P
0
.
02
42
=
P
0
.
93
43
=
P
05
.
0
44
=
Table 4: The Probability Matrix
The following transition matrix PT is developed from table 4.
05
.
0
93
.
0
02
.
0
0
0
93
.
0
02
.
0
05
.
0
0
0
1
0
0
0
0
1
44
43
42
41
34
33
32
31
24
23
22
21
14
13
12
11
PT
=
=
P
P
P
P
P
P
P
P
P
P
P
P
P
P
P
P
Q
R
I 0
05
.
0
93
.
0
02
.
0
0
0
93
.
0
02
.
0
05
.
0
0
0
1
0
0
0
0
1
PT
=
=
Where1
0
0
1
=
I
0
0
0
0
0
=
02
.
0
0
02
.
0
05
.
0
=
R
05
.
0
93
.
0
00
.
0
93
.
0
=
Q
95
.
0
93
.
0
0
07
.
0
05
.
0
93
.
0
00
.
0
93
.
0
1
0
0
1
)
(
−
=
−
=
−
Q
I
07
.
0
0665
.
0
0
)
95
.
0
07
.
0
(
≅
=
−
×
=
−
Q
I
195
.
0
93
.
0
0
07
.
0
1
)
(
−−
=
=
−
−
Q
N
I
Where N = the fundamental matrix.
07
.
0
07
.
0
93
.
0
0
95
.
0
=
N
1
29
.
13
0
57
.
13
=
N
By multiplying N by R we obtain the new probabilities that each of the states will end up with.
02
.
0
0
02
.
0
05
.
0
1
29
.
13
0
57
.
13
=
NR
For the transition matrix PT above, at equilibrium the proportion of manpower in states 1 and 2 is shown in matrix NR below:
3
.
0
7
.
0
3
.
0
7
.
0
=
NR
From the matrix above it is apparent that approximately 70% of recruited staff retire normally, while 30% are wasted. This suggests that the conditions of service in the organization have improved.
For the second organization studied,
(w
)
f
U
is given by:000
,
000
,
250
000
,
000
,
500
)
(
w
=
−
f
U
000
,
000
,
250
)
(
w
=
f
U
Assuming that the payoff matrix GT is as shown below and the elements represent the payoff or possible gain per state.
000
,
000
,
250
0
2
1
=
GT
The effective payoff matrix for the game, EG2, is given by:
EG2 = GT ∙ NR
Here NR≡ P in equation 1.
000
,
000
,
175
0
2=
EG
Retirement Wastages ActiveStaff
Recruitment
Retirement 1 0 0 0
Wastages 0 1 0 0
Active Staff 0.05 0.02 0.93 0
Possible total payoff for state 1 = 0
Possible total payoff for state 2 = 175,000,000
The transition and payoff matrices P and GT above represent the state of the game using strategy 2 or manpower policy 2.
C. Summary
Considering firms 1 and 2 as players 1 and 2, let us consider the two-person coordination game represented by GG.
175000000
,
175000000
90000000
,
175000000
175000000
,
90000000
90000000
,
90000000
2
1
=
GG
A look at the payoff matrix of the coordination game GG above shows that the optimum strategy for players 1 and 2 corresponds to strategy 2, hence, Nash equilibrium point corresponds to strategy 2.
As has been previously noted, in general, the equilibrium/optimal manpower policy is given by:
)
(
max
TP
Li
−
Lw
i
P
Ri
Or)
(
max
Ri
P
w
fi
U
V. RESULTS AND DISCUSSION
From the analysis above, it is obvious that the choice of manpower policies has different effects on the business enterprises studied. The second policy studied has optimal manpower policy even though the wage bill required for its implementation was higher than that of the first policy studied. This is because the proportion of recruited staff that stay till requirement is much higher in policy 2 than policy 1. The optimal policy did not correspond to the highest utility for the firm; this is in conformity with game theoretic results from Nash wage bargaining model where the optimal wage does not correspond to the highest utility for the firm [11]. Nash’s wage bargaining model is built on the assumption that at equilibrium the possibility of wastage is zero, as the equilibrium wage must always be higher than any alternative wage outside the firm. But this assumption is not always true; hence, game theoretic approach to manpower policy planning could result to more efficient equilibrium wage. This is because it makes use of historical data and stochastic methodology to arrive at equilibrium/optimal manpower/wage policy. The assumption of zero wastage in Nash’s wage bargaining model, though idealistic, is similar to game theoretic prescriptions of optimal manpower policy, where the optimal policy aims to reduce as much as feasible the possibility of wastage.
The consequence of proposition 1 is that a player that starts the game earlier than his opponent is more likely to win. Hence any firm that adopts a particular manpower policy first is most likely to make more profits provided all conditions remain the same for the competing firms.
Favourable manpower policies lead to higher proportion of recruited workers working in the organization till retirement. Also, favourable manpower policies lead to higher profits for enterprises because employees give in their best for the overall good of the firm. The implication of proposition 2 is that the full effect of manpower policy takes time to materialise. Nevertheless, huge/bloated wage bills could wipe off the benefits of a highly effective manpower policy.
VI. CONCLUSIONS
Manpower planning is concerned with the allocation of the right number of personnel to different tasks in order to achieve short and long term goals of an organization without violating organizational policies [2]. Sustainability of enterprises depends a lot on manpower performance. Hence, optimal manpower policy must always be sought by practitioners. The benefits of active and well motivated workforce are numerous. Hence, the well being of its workforce should be the priority of any good organization. In this work we have been able to prescribe a guide to manpower policy planners using game theoretic modelling. The analysis done here will be very useful to game theorists, management scientists, systems scientists and operations researchers who help in manpower policy development and planning. This will result to optimal manpower policies beneficial to the firm and its workforce.
REFERENCES
[1] J. Wang, A Review of Operations Research Applications in Workforce Planning and Potential Modelling of Military Training, DSTO Systems Sciences Laboratory, Edinburgh Australia, 2005.
[2] J. L. Kennington, F. Mohammadi, R.A. Mohammad, The Army New Personnel System Evaluation Model. United States Army Research Institute for the Behavioral and Social Sciences, 1993.
[3] T. Abodunde, S. McClean, 'Production Planning for a Manpower System with a Constant Level of Recruitment,' Applied Statistics, Vol. 29, No.1, 43-49, 1980.
[4] S. Zanakis, M. Maret, A Markov Chain Application to Manpower Supply Planning," Journal of Operational Research Society, Vol. 31, No. 12, 1095-1102, 1980.
[5] W.L. Price, A. Martel, K.A. Lewis, A Review of Mathematical Models in Human Resource Planning. Omega, 8(6):639-645, 1980.
[6] D.J. Bartholomew, A.F. Forbes, S.I. McClean, Statistical Techniques
for Manpower Planning. John Wiley & Sons, New York, USA, 1991.
[7] J. Edwards, A Survey of Manpower Planning Models and Their Applications, Journal of Operational Research Society, Vol.37, No.
11, 1031-1040, 1983.
[8] B. Raghavendra, 'A Bivariate Model for Markov Manpower Planning Systems,' Journal of Operational Research Society,Vol. 42, No. 7, 565-570, 1991.
[9] A. Young, T. Abodunde, 'Personnel Recruitment Policies and Long-term Production Planning,' Journal of Operational Research Society, Vol. 30, No. 3, 225-236, 1979.
[10] S. Zanakis, M. Maret, "A Markovian Goal Programming Approach to Aggregate Manpower Planning,' Journal of Operational Research Society, Vol. 32, No. 1, 55-63, 1981.
[12] L. M. Kahn, Employment protection reforms, employment and the incidence of temporary jobs in Europe: 1996–2001. Labour Economics 17 (2010) 1–15.
[13] J. von Neumann, O. Morgenstern, The Theory of Games and Economic
Behavior. Princeton: Princeton University Press, 2nd edition, 1947.
[14] C.C. Nwobi-Okoye, “Markov Queue Game with Virtual Reality Strategies”. Science World Journal. 4(3): 35-40, 2009.
http://www.scienceworldjournal.org/article/viewFile/5352/3673
(accessed 1/23/10).
[15] K. Binmore, Game Theory a Very Short Introduction. Oxford University Press, Oxford, UK, 2008.
[16] B. von Stengel, T. Turocy, Game Theory. CDAM Research Report LSE-CDAM-2001-09, 2008.
[17] B. von Stengel, Game Theory Basics. Lecture Notes, Department of Mathematics, London School of Economics, Houghton St, London WC2A 2AE, United Kingdom, 2008.
[18] M.J. Osborne, A Course in Game Theory. MIT Press, Cambridge, MA, USA, 1998.
[19] D. Fudenberg, J. Tirole, Game Theory. MIT Press, Cambridge, MA., 1991.
[20] K. Ritzberger, Foundations of Non-Game Theory. Oxford University Press, Oxford, UK, 2003.
[21] C.C. Nwobi-Okoye, “General Theory of Games with Virtual Strategies”. Pacific Journal of Science and Technology. 11(1):317-327,
2010. Available from:
http://www.akamaiuniversity.us/PJST11_1_317.pdf [Accessed May 28 2010]
[22] C.C. Nwobi-Okoye, Game Theoretic Aspects of Crowd Renting.
Science World Journal, Vol 5(No 2), pp.35-40, 2010. Available from:
http://www.scienceworldjournal.org/article/viewFile/5352/3673
[Accessed June 22 2010]
[23] C.C. Nwobi-Okoye, “Equilibrium Points in Games with Virtual Strategies”. Pacific Journal of Science and Technology. 11(2):332-341,
2010. Available from:
http://www.akamaiuniversity.us/PJST11_2_332.pdf [Accessed May 28 2010]
[24] C.C. Nwobi-Okoye, “Game Theoretic Aspect of Phishing and Virtual Websites”. Pacific Journal of Science and Technology. 12(1): 260-269,
2011. Available from:
http://www.akamaiuniversity.us/PJST11_1_260.pdf
[25] C.C. Nwobi-Okoye, A.C. Igboanugo, Game Theoretic Aspects of Production Process Transfer Functions. Research Journal of Applied Sciences, Engineering and Technology, 3(11): 1325-1330, 2011. [26] P.C.G. Vassiliou, The Evolution of the Theory of Non-Homogeneous
Markov Systems. Applied Stochastic Models and Data Analysis. Vol. 13: p. 159. Wiley & Sons, 1998.
[27] W. Ching, M. Ng, Markov Chains: Models, Algorithms and Applications. Springer Science + Business Media, Inc., 233 Spring Street, New York, NY 10013, USA, 2006.
[28] T. Hamdy. Operations, Research. Prentice Hall of India Ltd, New Delhi, 2004.
[29] S. Asmussen, S. , Applied Probability and Queues. Springer Publications, New York, 2003.