Towards an Action Perspective for Urban Water Security: Design and Use of Indicators as a Boundary Object
52
0
0
Full text
(2) 1. Introduction. Water security is at the top of the research agenda. It emerged to address the most prominent waterrelated challenges nowadays (Basco-Carrera, Warren, et al., 2017) and, recently, its study at the urban scale and under an integrative vision has been gaining increased recognition among scholars (see Cook & Bakker, 2012; Hoekstra et al., 2018; Zeitoun et al., 2016). There are two fundamental reasons for this. First, although the scale of water security at the national level facilitates stronger links with national goals and the interconnected sectors, a focus on the urban scale puts a bigger emphasis on highly dynamic environmental and socio-economic conditions (Beek & Arriens, 2014; Srinivasan et al., 2017). This is particularly critical in the context of increasing urbanization, climate change, and a growing demand for better living standards (Bigas, 2013; Bogardi et al., 2012; Koop & van Leeuwen, 2017; Pedrazzini, 2011; Zeitoun et al., 2016). Second, the adoption of an integrative vision aims to guarantee efficient water-related services and use, and manage water-related threats in a way in which welfare, equity, and long-term sustainability are improved (Basco-Carrera, Warren, et al., 2017; Bogardi et al., 2012; Cook & Bakker, 2012; Gerlak et al., 2018; GWP, 2014; Hoekstra et al., 2018; Varady et al., 2016; Zeitoun et al., 2016). This view contrasts with some scholars whose focus lies on more narrow approaches such as water supply and accessibility (Krueger et al., 2019; Padowski et al., 2016; Srinivasan et al., 2017). Despite the stigmatization around the fact that a broad approach is difficult to incorporate into practice (Cook & Bakker, 2012), this study underlines the aspects thereof as part of the many complex and interrelated problems and challenges of the natural and built-in water systems (Basco-Carrera, van Beek, et al., 2017; Bigas, 2013; Biswas & Tortajada, 2016; Hoekstra et al., 2018). To characterize the inherent complexity surrounding urban water security (UWS), efforts have been directed to the development of appropriate UWS indicator-based frameworks (see Arcadis, 2015; Hoekstra et al., 2018; Jensen & Wu, 2018; Koop & van Leeuwen, 2015; Romero-Lankao & Gnatz, 2016; van Ginkel et al., 2018; Vink, 2019).; and, due to their benefits, their adoption as policy decision making tools has been rising (Wilder, 2016). The use of indicators provides a good starting point towards a water-secure future by offering the possibility of “a new and comprehensive understanding of society’s water needs and the water system, with a clear pathway to public and private decisionmakers (Grey et al., 2013, p.8)”. Water related indicators have the potential to simplify complex realworld phenomena into quantifiable information that is easier to communicate (Molle & Mollinga, 2003). Looking at numbers facilitates evaluation and monitoring (Wilder, 2016) and can reflect differences in water-related matters (Jensen & Wu, 2018). Indicators offer a quick-scan of the situation of the urban water system highlighting its strengths and weaknesses. They appoint what seem to be the most critical issues and contribute to an enhanced problem formulation (Jensen & Wu, 2018) which in turn, gives room to the allocation of better practices (van Leeuwen et al., 2012). Furthermore, when applied to the urban scale, those participating in the policy decision making are given the opportunity to distinguish a direct link between their actions and what the indicators measure (Jensen & Wu, 2018). In spite of the benefits provided by indicator-based frameworks in the field of UWS, there are some design concerns surrounding their use in the policy decision making processes: the majority of the current tendencies in the design of indicator frameworks on the UWS domain place much attention in the technical and analytical properties, and leave political and practical aspects of their design and use in the background (Howlett & Cuenca, 2017). Furthermore, their contribution to the policy decision making processes is theoretical; little is known on their process of adoption (Howlett & Cuenca, 2017), and an increased rate of use does not translate into satisfaction with the outcomes (Garfin et al., 2016; Hoppe, 2010). Howlett & Cuenca (2017) found that political and practical aspects of the use of UWS indicators are significant to determine their success. The participation of the users has an effect on their success when they are using it (Lehtonen, 2013). Also, the influence the indicators exert is partly subjected to the policy decision making context and settings such as culture, structure and conditions (Howlett & Cuenca, 2017; Lehtonen, 2013). Still, literature regarding UWS is scarce for a comprehensive indicator design that considers characteristics of its use in the policy decision making processes from the beginning. An example of comprehensive design corresponds to a tailored index for UWS developed by Jensen & Wu (2018) that, to our knowledge, bears the closest resemblance to a farreaching design careful of including aspects beyond the technical and analytical envision. This study explores the design of an indicator-based framework with a clear link to aspects of its use in the policy decision making processes. Indicators can be used in many different modes in the 2.
(3) policy decision making (see Howlett & Cuenca, 2017; Jensen & Wu, 2018; Lehtonen, 2013; Molle & Mollinga, 2003). Our aim is to create a comprehensive indicator-based framework that provides specialists and non-specialists with an improved understanding of integral water-related issues for the purpose of decision making about effective interventions. In order to do that, we focus on the indicators’ role in assisting collective learning and joint problem formulation at the science-policy interface. We conceive the science-policy interface as the knowledge intersection between science actors from diverse fields, policy actors, and stakeholders, all interacting in a participatory setting with the purpose of enriched decision making (Gustafsson & Lidskog, 2018; MacDonald et al., 2015; Wiek et al., 2007). In the science-policy interface, actors have different interests which results into a disagreement on what the problem is and what it means (Hegger et al., 2012; Hommes et al., 2009; Lang et al., 2012; Zeitoun et al., 2016). In the context of UWS, indicator-based frameworks can be used to facilitate effective communication among the different actors relevant for the field of water: scientific, bureaucratic and stakeholders (Edelenbos et al., 2011). Consequently, dialogues about UWS-related issues and potential solutions would be enabled (Howlett & Cuenca, 2017; Molle & Mollinga, 2003). We conceptualize the resulting indicator-based framework as a boundary object (see Hegger et al., 2012; Hoppe, 2010; Kimble et al., 2010; Lang et al., 2012; Molle & Mollinga, 2003; Star & Griesemer, 1989; Voinov & Bousquet, 2010; White et al., 2010). We define a boundary object for the UWS domain as an instrument that functions as a knowledge base and is capable of enabling effective communication across different scientific domains, policy divides and stakeholders found in the science-policy interface. It has the purpose of assisting knowledge co-production to arrive at an integrative definition of the problem, establish a priority agenda, and serve as a solid base for an enriched policy- and decision-making towards effective action perspectives for urban water security. The practical implications extend to the use of the resultant design by consultants that work with water related actors relevant for participatory policy decision making. The intervention of actors and organizations that span research and practice surrounding UWS policy decision making are catalogued as an effective approach to co-produce knowledge at the science-policy interface (Varady et al., 2016). Co-producing knowledge in this way often employs strategies to set rigorous interactions among the different actors which results in intensive use of resources (Hegger et al., 2012; Kirchhoff et al., 2015; Lang et al., 2012). We provide a standardized approach that presents a less demanding alternative that is not restricted to the analysis of a consultant oblivious to the policy decision making processes (Jordan et al., 2018). Furthermore, the designed indicator-based framework can be used to prevent institutional fragmentation either from different departments of the same organization or from different organizations. This research adopts a design-science methodology (Wieringa, 2014). Section 2 presents key insights from the literature on boundary objects and UWS indicators. In Section 3, the theoretical insights retrieved from the last step are integrated with insights retrieved from experts into a conceptual framework. Section 4 provides a research overview and describes the method to incorporate the conceptual framework into a design. Also, the Urban Water Security Dashboard (UWSD) developed by van Ginkel et al. (2018), which constitutes the starting point for the design, and the case study of Mexico City, are introduced. Section 5 presents the resultant design, an approach based on the UWSD to be operationalized as a boundary object in the context of UWS. Section 6 contains the result of the application of the framework to the case study in Mexico City and in an experts’ session. Section 7 discusses the main findings of the design and its application, and the trade-offs with similar approaches. Finally, Section 8 summarizes our main conclusions and recommendations. 2. Theoretical Background – UWS Indicator-Based Boundary Object Success Criteria. This section presents the success criteria for an indicator-based framework conceptualized as a boundary object. First, we present the main components of an indicator-based framework. Following, we introduce inherent features that should be considered for the success of a boundary object. These are specifically described for an indicator-based framework and its components.. 3.
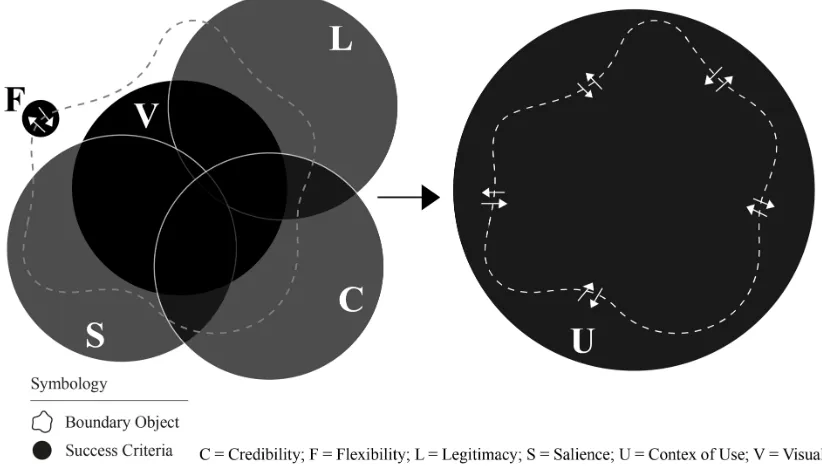
(4) 2.1. UWS Indicator-Based Frameworks: What to Consider for their Composition?. Our understanding of an indicator-based framework distinguishes between four fundamental components, namely indicators, analytical base, portrayal, and the process of development. Indicators refer to the basic unit of analysis; analytical base, to the structure of analysis (e.g. modular approach, system approach); and portrayal, to the way in which the indicators and the analytical base are represented (e.g. graphs, list, dashboard). The fourth one is an underlying component and refers to the process of development of indicators (i.e. definition and/or selection and/or population). According to the OECD (Linster, 2003), water-related indicators should have a balance between the relevance and utility for users, the analytical soundness and the measurability. The process of development of indicators should be careful of including the aforementioned aspects and also of considering that the acceptancy of the selected indicators is subjected to a collaborative development with those who are likely to use it (Sullivan, 2002; Wilder, 2016). Furthermore, this process is considered as dynamic where the indicators selected are neither final, nor exhaustive; they keep evolving over time and space (UN-Water, 2006). However, it is important to keep in mind that, even with the right indicators of UWS in place, meaningful results will be elusive until their relative interrelations are identified (Romero-Lankao & Gnatz, 2016). The analytical base should provide the opportunity to visualize those interrelations. A defficient understanding of the interaction between environmental, socio-economic and physical aspects in the water system makes it hard to fully grasp the impacts on the functions of the water sector, and those interconnected to it (Biswas & Tortajada, 2016). In terms of portrayal, the visual communication of the index must prevent information loss (Hoekstra et al., 2018). Indicators embed large amounts of information in its composition, which can lead to inadequate conclusions derived from an oversimplified reading and presentation (Molle & Mollinga, 2003; Nardo et al., 2005; Sullivan et al., 2006). 2.2. Boundary Objects: How to Achieve Success?. Figure 1. Success criteria for a boundary object. A boundary object is not restricted to a predefined shape and it is flexible to changes that may arise during it use. It is composed by a combination of elements that contemplate an interplay between credibility, legitimacy and salience displayed by means of a set visualization.. Boundary objects are instruments that bridge the gap between science and policy (Hoppe, 2010) by enabling effective communication between different actors found at the science-policy interface (Crona & Parker, 2011; Hegger et al., 2012; Howlett & Cuenca, 2017; Molle & Mollinga, 2003; Voinov & Bousquet, 2010; White et al., 2010). They function as a knowledge base that integrates aspects of the local context and the scientific body of knowledge (Lang et al., 2012). They facilitate a cooperation that 4.
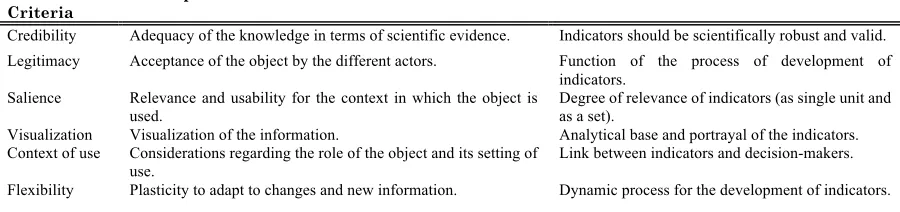
(5) takes place in “social processes which encompass relations between scientists and other actors in the policy process, and which allow for exchanges, co-evolution and joint construction of knowledge with the aim of enriching decision-making (Hegger et al., 2012, p.53)”. As a result, they can target some of the issues found at the science-policy interface like insufficient problem awareness and framing; deficient integration across knowledge types, communicative styles and/or technical aspects; and an absence of legitimate and transdisciplinary outcomes (Lang et al., 2012). Boundary objects are not restricted to a specific type of artefact (Hegger et al., 2012; Hoppe, 2010; Molle & Mollinga, 2003; White et al., 2010). Therefore, they can take the form of indicator-based frameworks. However, disregarding the type, we identified certain features that boundary objects have in common that dictate their success based on the function they fulfil, namely credibility, legitimacy and salience, visualization, context of use and flexibility. Figure 1 illustrates a boundary object and in terms of the success criteria and Table 1summarizes each of the criteria of success of a boundary object and relates it to indicator-based frameworks. 2.2.1. Credibility, Legitimacy and Salience. The production and mobilization of knowledge is more effective when the criteria of salience, legitimacy and credibility are met and the trade-offs among them are balanced for the different users (Hegger et al., 2012). Credibility refers to adequacy of the knowledge integrated into the object in terms of scientific validity and technical evidence. Salience can be defined as the perceived relevance of the boundary object for the policy decision making processes according to the interests and needs of the actors involved in regard of the context. Legitimacy contemplates the extent to which the users perceive the object as fair, balanced, unbiased, respective and inclusive of their perceptions (Edelenbos et al., 2011; Hegger et al., 2012; Kolkman et al., 2005; Lang et al., 2012; Voinov & Bousquet, 2010; White et al., 2010). Credibility for an indicator framework means that indicators need to be valid and scientifically robust which substantiates their value for the actors involved in the policy decision making process. They need to accurately capture levels and changes in their phenomenon of interest. Their construction must be coherent and transparent built upon data that already exists, and is feasible to collect within time and budget from a trusted source (Jensen & Wu, 2018). A boundary object needs to be legitimate to be accepted. In an indicator system, this is largely a function of the process of the indicators’ development. It concerns the involvement of stakeholders in the definition, selection and population of the indicators. It needs to be contextual and collaborative to include a wide range of perspectives (Jensen & Wu, 2018; Molle & Mollinga, 2003; Sullivan et al., 2003). Salience will influence the degree to which an indicator is useful for the policy decision making process (Linster, 2003). They should be relevant to the actors involved in regard of the context and the scale of action (Jensen & Wu, 2018). 2.2.2. Visualization. The visual communication of the boundary object influences the compelling and persuasive capacity of the artefact and should not be neglected. Boundary objects help to visualize intricated and large amounts of information. Adequate visualization techniques are required for the exploration and understanding of the resulting large set of information and knowledge. An adequate visualization format with capacity to communicate information, data and knowledge enables an engaging and substantial process (Voinov et al, 2016). Visualization for an indicator-based framework not only considers the portrayal of the object, but also its analytical base. In first place, in indices, a large amount of information is contained in the composition of the indicators (Molle & Mollinga, 2003; Sullivan et al., 2006). The construction of comprehensive indices and indicators considered of multiple variables can result in information losses (Hoekstra et al., 2018). In addition, to facilitate understanding, the relationships between the phenomenon that single indicators measure must be perceptible (Biswas & Tortajada, 2016; RomeroLankao & Gnatz, 2016). 5.
(6) 2.2.3. Context of Use. The role that boundary objects play in the policy decision making process influences them. The actors considered for the development of a boundary object must correspond to the actors who will use it (Hegger et al., 2012; Kolkman et al., 2005; Lang et al., 2012). Also, where and how the boundary object will be used in the process must be clear for the participants (Lang et al., 2012). Furthermore, Kimble et al. (2010) identified that, despite the fact that literature regarding boundary objects stresses that their success relies on the selection of the right object to fit the purpose, their success involves not just the artefact itself but also the role of the ‘guide’ (i.e. boundary actors). A boundary actor refers here to as the person or organization behind the development of the object. The role of a boundary actor is commonly compared to the one played by facilitators or moderators. They are objective and impartial, and are normally placed outside the formal decision-making processes (Voinov & Bousquet, 2010). They often come from a scientific background (Hegger et al., 2012). Yet, this does not mean that they are restricted to their background; their contribution goes beyond informing and/or consulting and is compared to those of ‘issue advocates’ and ‘honest brokers’ (Hegger et al., 2012). They play a key role in the pre-structuration of the problems and in giving direction to the process (Hegger et al., 2012; Hoppe, 2010; Kirchhoff et al., 2015). At the end, a one-directional piece of advice, such as the one provided by an instrument on itself, is not translated into immediate and effective uptake in the policy decision making processes (Hoppe, 2010). An indicator-based framework that targets the science-policy dialogues interface in the early stages (i.e. collective learning and joint problem identification) (Jensen & Wu, 2018; Lehtonen, 2015), has to consider important aspects regarding its context of use. Actors from the scientific domain, the bureaucratic field and stakeholders will be brought together (Edelenbos et al., 2011). Scientific knowledge may come from scientists or consultants and is based on education and professionalism (Hommes et al., 2009). Bureaucratic refers to that knowledge retrieved from the institutions and stakeholder to that collected from local actors with a direct interest in the problem (Edelenbos et al., 2011). Scientific knowledge cares about the credibility; whilst bureaucratic and stakeholder about the practical relevance (i.e. salience) and legitimacy (Lang et al., 2012). According to Hegger et al. (2012), successful joint knowledge production is reliant on a dynamic interplay between such actors and their discourses, rules and resources. An indicator-based framework under this context should facilitate such interplay in a way in which a stronger link between indicators and the actors involved will allow them to perceive a direct link between their actions and what the indicators measure (Jensen & Wu, 2018). The indicators would perform an instrumental and conceptual function: they can inform specific decisions or projects, and, at the same time, they are a knowledge base for informed decisions (Howlett & Cuenca, 2017; Lehtonen, 2013). Table 1. Link of success criteria for boundary objects to UWS indicator-based frameworks. References are found in the text. Success Criteria Credibility. Description. Link to indicator-based frameworks. Adequacy of the knowledge in terms of scientific evidence.. Indicators should be scientifically robust and valid.. Legitimacy. Acceptance of the object by the different actors.. Salience. Relevance and usability for the context in which the object is used. Visualization of the information. Considerations regarding the role of the object and its setting of use. Plasticity to adapt to changes and new information.. Function of the process of development of indicators. Degree of relevance of indicators (as single unit and as a set). Analytical base and portrayal of the indicators. Link between indicators and decision-makers.. Visualization Context of use Flexibility. 6. Dynamic process for the development of indicators..
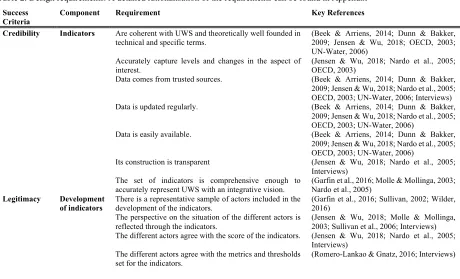
(7) 2.2.4. Flexibility. Boundary objects must be flexible and plastic enough not only for the specific needs of the local context, but also in the face of changes and new information that may arise during their use (Star & Griesemer, 1989; Voinov & Bousquet, 2010; Voinov et al., 2016). Their context of use influences them and vice versa. In response, boundary objects, just as the process in which they are implemented, should be adaptive. This means that they must be ready be redefined and adjusted (Voinov & Bousquet, 2010). To achieve this, boundary objects may be developed as modular, robust and/or hierarchical, which allows a smooth change of components (Voinov & Bousquet, 2010). In an indicator-based framework, flexibility is attributed to the dynamic process. Indicators are neither final, nor exhaustive. They keep evolving over time and space (UN-Water, 2006). Indicators must remain plastic enough to withstand changes and additions necessary for their usability without compromising their balance and structure. 3. Conceptual Framework – UWS Indicator-Based Boundary Object Requirements. From the past section, we can determine that an UWS indicator-based boundary object must foster a variety of indicators that preserve a balance over credibility, legitimacy and salience (Howlett & Cuenca, 2017; Jensen & Wu, 2018; Molle & Mollinga, 2003). Furthermore, its visualization must allow interrelations among indicators to be distinguished (Hoekstra et al., 2018; Krueger et al., 2019; RomeroLankao & Gnatz, 2016; van Ginkel et al., 2018) in a format that enables effective communication of information, data and knowledge (Hoekstra et al., 2018; Molle & Mollinga, 2003; Nardo et al., 2005). Lastly, its composition ought to consider important characteristics of the context of use in which it will be operated (Howlett & Cuenca, 2017; Jensen & Wu, 2018; Molle & Mollinga, 2003) and remain flexible to adapt to changes and new information that may arise (Howlett & Cuenca, 2017; Lehtonen, 2013; UN-Water, 2006). Error! Reference source not found. summarizes the boundary object success criteria coupled to indicator-based frameworks for the UWS domain. To address the success criteria, 25 design requirements were developed supported by theory and experts’ opinion (the insights retrieved by the experts’ consultation can be found in Appendix 1). Such requirements are displayed in Table 2. They correspond to the aspects that should be taken into account for the design of a comprehensive indicator-based framework characterized as a boundary object for the UWS domain. Table 2. Design requirements. A detailed rationalisation of the requirements can be found in Appendix Success Criteria Credibility. Component. Requirement. Key References. Indicators. Are coherent with UWS and theoretically well founded in technical and specific terms.. (Beek & Arriens, 2014; Dunn & Bakker, 2009; Jensen & Wu, 2018; OECD, 2003; UN-Water, 2006) (Jensen & Wu, 2018; Nardo et al., 2005; OECD, 2003) (Beek & Arriens, 2014; Dunn & Bakker, 2009; Jensen & Wu, 2018; Nardo et al., 2005; OECD, 2003; UN-Water, 2006; Interviews) (Beek & Arriens, 2014; Dunn & Bakker, 2009; Jensen & Wu, 2018; Nardo et al., 2005; OECD, 2003; UN-Water, 2006) (Beek & Arriens, 2014; Dunn & Bakker, 2009; Jensen & Wu, 2018; Nardo et al., 2005; OECD, 2003; UN-Water, 2006) (Jensen & Wu, 2018; Nardo et al., 2005; Interviews) (Garfin et al., 2016; Molle & Mollinga, 2003; Nardo et al., 2005) (Garfin et al., 2016; Sullivan, 2002; Wilder, 2016) (Jensen & Wu, 2018; Molle & Mollinga, 2003; Sullivan et al., 2006; Interviews) (Jensen & Wu, 2018; Nardo et al., 2005; Interviews) (Romero-Lankao & Gnatz, 2016; Interviews). Accurately capture levels and changes in the aspect of interest. Data comes from trusted sources. Data is updated regularly. Data is easily available. Its construction is transparent. Legitimacy. Development of indicators. The set of indicators is comprehensive enough to accurately represent UWS with an integrative vision. There is a representative sample of actors included in the development of the indicators. The perspective on the situation of the different actors is reflected through the indicators. The different actors agree with the score of the indicators. The different actors agree with the metrics and thresholds set for the indicators.. 7.
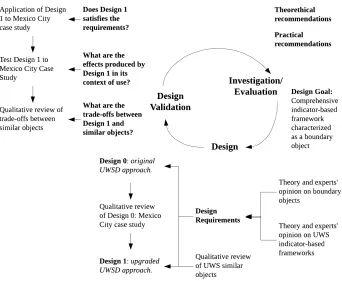
(8) Salience. Indicators. The indicators are populated with data according to the spatial scale selected and the specific context. The indicators are applicable to the local area situation. The indicators are simple to understand and interpret. Visualization. Portrayal. Analytical base Context use. of. Flexibility. 4. -. Various. The framework helps visualize large amounts of information as required. The framework presents information in a simple and inspiriting manner (it's not overwhelming). The framework is visually appealing. The relationships between indicators are visible, clear, and simple to understand. The actor(s) that built-up the object (i.e. boundary actor(s)) are neutral, objective, and placed outside the formal policy decision making processes. The actor(s) that built-up the object (i.e. boundary actor(s)) is(are) present in the context of use. The users (i.e. actors that will interact with the object) are considered for the development of the object. It is clear in which part(s) of the context of use the object will be operated. It is clear how will the object be operated. Object considers and complies with the rules of its context of use. The output of the object is linked with the rest of the policy decision making process. The object remains flexible to allow changes and to be responsive when new information arises.. (Jensen & Wu, 2018; UN-Water, 2006; interviews) (Beek & Arriens, 2014; Dunn & Bakker, 2009; Jensen & Wu, 2018; Interviews) (Beek & Arriens, 2014; Dunn & Bakker, 2009; Jensen & Wu, 2018; Nardo et al., 2005; Interviews) (Howlett & Cuenca, 2017; Molle & Mollinga, 2003; Sullivan et al., 2003; Voinov & Bousquet, 2010; Wilder, 2016; Interviews) (Interviews) (Voinov et al., 2016; Interviews) (Basco-Carrera, Warren, et al., 2017; Romero-Lankao & Gnatz, 2016; UN-Water, 2006; Indicators) (Voinov & Bousquet, 2010) (Basco-Carrera & Francisco-Mendoza, 2017; Hegger et al., 2012; Hoppe, 2010; Kimble et al., 2010) (Basco-Carrera & Francisco-Mendoza, 2017; Kolkman et al., 2005; Sullivan, 2002) (Interviews) (Interviews) (Hegger et al., 2012, Interviews) (Interviews) (OECD, 2003; UN-Water, 2006; van Bruggen et al., 2019; Voinov & Bousquet, 2010; Wilder, 2016). Method. This section starts by providing a brief description of the strategy followed to perform this research: design-science. Next, we describe the specific methods followed for the different stages contemplated by the design-science methodology. Following, the UWSD, which is the starting point for our design, is presented and described. It is followed by the introduction to the case study of Mexico City, from which real-life information is collected in the form of qualitative and quantitative data (Yin, 2017) necessary for the design and validation processes. 4.1. Research Strategy: Design-Science Methodology. This study is based on the design-science methodology (Wieringa, 2014). The strategy followed for this research and its specific stages are illustrated in Figure 2. The design is iterative and takes as starting point what we call Design 0. The Design 0 corresponds to an existent UWS indicator-based framework: the Urban Water Security Dashboard (see van Ginkel et al., 2018) (further explained in Section 4.4). Design 1 corresponds to an upgraded UWSD and corresponds to the design of a UWS indicator-based framework (originated from the UWSD) characterized as a boundary object. The stages and activities of the research displayed in Figure 2 can be translated into the following questions: (1) According to literature and experts’ opinion, what should be considered for the design of an indicator-based framework (design requirements) that aims to operate as a boundary object in the context of UWS? (2) To what extent are the design requirements present in the original UWSD? (3) How can the UWSD be upgraded to enhance the incorporation of the design requirements? (4) How does the design of the upgraded UWSD perform? (5) What are the theoretical and practical implications derived from the performance of the upgraded UWSD approach?. 8.
(9) Figure 2. Research strategy based on the design-science methodology. Adapted from (Wieringa, 2014).. 4.2. Design. To find the weaknesses and the strengths of the UWSD in terms of the requirements obtained in Section 3, we made use of a learning-by-doing approach and an expert consultation procedure. The premise was that the UWSD in its original form complies with the criteria of success for an indicator-based boundary object only to a certain extent. However, the extent of compliance was unknown. To overcome this issue, we applied the original UWSD methodology to the area of the case study in Mexico City. This exercise allowed us to describe in a qualitative way if and in which form the UWSD was addressing each of the design requirements. Furthermore, we consulted experts (related to the use of boundary objects) about their opinion of the UWSD in relation with the criteria of success of a boundary object. The output of both tasks provided a basis for the upgrade of the UWSD. Subsequently, we reviewed literature about indicator-based frameworks for the UWS domain to get a grasp on the different alternatives developed by other scholars and practitioners to address the subject. The focus of our investigation at this step revolved around the composition of the frameworks and their underlying methodology. After the performance of the UWSD in terms of the design requirements was evaluated, and different practices for indicators development were identified, an upgrade on the original UWSD approach took place. Where a requirement was absent or partially met, measures to improve the UWSD were taken. The output of this process corresponded the design of an indicator-based boundary object. 4.3. Design Validation. The upgraded UWSD obtained in the design process was applied to the case study of Mexico City. This allowed us to test the approach to a large extent and to get a real-life example of its application. However, it was not possible to apply the upgraded UWSD to its actual context of use, in this case Mexico City. 9.
(10) To address the aforementioned limitation, an expert session that simulated the science-policy interface of the Mexican context was conducted at Deltares. Deltares is an independent Dutch research institute in the field of water. They work around the world to provide smart solutions, innovations, and applications for people, environment and society. In response to the complexity of the management of socio-ecological systems under the current rapid urbanization, increasing population growth, and climate change, Deltares works along with governments, businesses, and other research institutes and universities, both in the Netherlands and abroad. They have close relationships with Mexican actors and institutes and are familiar with their context. Furthermore, they have experience working at the intersection where different types of knowledge coexist. In this session, the upgraded UWSD approach was tested with a sample of Deltares experts, and we observed and recorded how it performed in terms of the effects produced by the interaction of the boundary object and its ‘context of use’. Lastly, we engaged into a discussion on the upgraded UWSD itself and its strengths and opportunities. The last step of validation consisted of a qualitative review of the upgraded UWSD approach supported by literature against a selection of similar objects and approaches. The purpose of this task was to identify the differences between the effects of different instruments in the same context of use. 4.4. The Urban Water Security Dashboard (UWSD). The Urban Water Security Dashboard (UWSD) (van Ginkel et al., 2018) has an integrative theoretical base and a system-oriented analytical base, hence making it an adequate starting point for the design of an indicator-based framework characterized as a boundary object. The UWSD is an indicator-based framework that follows an integrative understanding of UWS based on a system approach: pressure – state – impact – response (PSIR). PSIR has been commonly used to represent dynamic environmental systems due to the opportunity it provides for system analysis (Hoekstra, 1998; Hoekstra et al., 2018; Sekovski et al., 2012; van Ginkel et al., 2018) which is why Hoekstra et al (2018), proposed it as an appropriate alternative for understanding the complexity of UWS. From a policy and decision-making point of view, a PSIR approach provides actors involved the opportunity to see environmental, economic and societal issues as interconnected (Hommes, 2008; OECD, 2003). The conceptual framework of the UWSD is represented and further described in Figure 3. Indicators to fit each of the categories that compose its conceptual framework were developed and measured on a 1-5-point scale. The term water security implies thresholds that set a minimum standard for living beyond which a compromise is unacceptable (Bakker & Morinville, 2013; Grey et al., 2013; van Ginkel et al., 2018). The proposed scale captures such thresholds in a way where very secure means a low level of concern in terms of UWS whereas very insecure refers to a very high level of concern.. Figure 3. UWSD Conceptual Framework. Adapted from Van Ginkel et al. (2018).. 4.5. Case Study: Mexico City. Mexico City is one of the most densely populated cities around the world. The greater area of Mexico City is home to more than 21 million people which has granted it the title of mega city. Mexico City’s population faces big challenges in relation to water. Water management impacts different areas that include health, environment, access to basic water services, etc. (De Urbanisten, 2016; Romero-Lankao, 10.
(11) 2010; Tellman et al., 2018; Tortajada, 2006a; Tortajada & Castelán, 2003). Although Mexico City is subjected to well-known critical issues such as severe flooding and water shortages, the use of narrow approaches has created a chain of problems in other parts of the system (De Urbanisten, 2016). Depicting the complexity of Mexico City’s water system provides a challenging opportunity for an indicator-based boundary object that follows an integrative understanding of UWS. For this reason, Mexico City was chosen as the case study. The data collection methods employed correspond to document analysis, observation, and a survey. Following, they are briefly described. (1) Document analysis – Review of official documents, scientific literature, national data bases, and Deltares internal documents and information to investigate the situation regarding UWS in Mexico City. (2) Observation – Attendance to a participatory modelling process in the area named ‘Too Little or Too Much: Addressing Mexico City’s Water Issues’. There, policy- and decision-makers were brought together with practitioners and science-related actors to breakdown the water-related problems and create a map of the topic. This session allowed us to get a grasp on the sciencepolicy interface for the Mexican context around the topic of UWS. The insights retrieved improved our understanding of the policy decision making processes. (3) Survey – Approach of critical actors to retrieve information by means of a questionnaire about their knowledge regarding the UWS situation of the area (more information about the questionnaire is provided in Section 5 and Appendices 4 and 5. 5. Results – Upgraded UWSD Approach. This section contains the main output of this research: the design of an indicator-based framework that can function as a boundary object. The first sub-section provides a review of the performance of the original UWSD in terms of the design requirements presented in Table 2. The second one, the design of the upgraded UWSD where the flaws found in the previous step have been addressed. A detailed review of the original UWSD approach developed by van Ginkel et al. (2018) and the design hereby presented can be found in the Appendix 3. 5.1. Review of the Original UWSD. Table 3 provides a description of the components of the UWSD. In terms of credibility, the indicators composing the UWSD have a strong theoretical basis and their influence on the UWS picture is clearly justified. They are able to capture levels and changes in aspects that are being measured. The data to populate the indicators comes from trusted sources as a result of an extensive search procedure. However, such search procedures, in some cases, are time consuming since the information is not easily available. The legitimacy is partially addressed in the development of indicators, where the search procedures cover a wide range of studies before issuing a judgement. However, external actors are not included in the development of indicators. External actors are only consulted to give a score to the response dimension based on their perceptions. Salience is partially covered in the development of indicators. The UWSD is focused on the city proper scale. Accordingly, most of the indicators require to be populated with local data. However, the data required to fit the local scale are sometimes hard to find and, as a consequence, some indicators are populated with data at the national scale. This threatens an accurate representation of the local context. Furthermore, the original UWSD serves the purpose of systematic cross-comparison between different cities. This means that the selection of indicators is generalized up to the extent where the local context cannot be accurately represented. This has two major consequences. On the one hand, some indicators are not applicable to certain contexts at all. For example, Mexico City is not a coastal city; therefore, all indicators related to the coast are of null importance for this context. This is partly solved by the protocol of assigning to such indicators the highest score. However, interviews disclosed that 11.
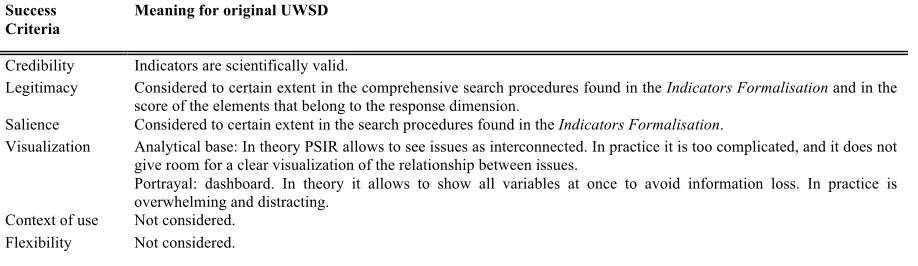
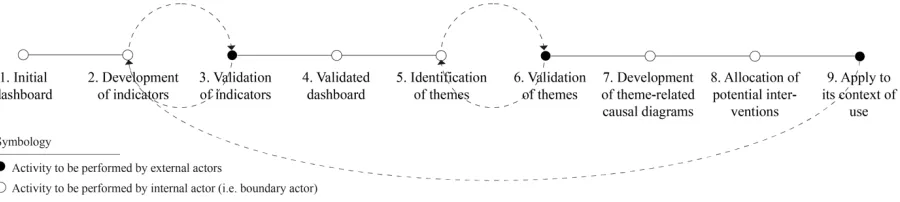
(12) indicators that are not applicable to the context interfere with the identification of the actual challenges by adding irrelevant information to an already large knowledge base. On the other hand, a generalized selection of indicators, may leave important aspects of the local context behind. For example, one of the biggest environmental pressures for Mexico City corresponds to the seismic hazard. Mexico City is an area subjected to high seismic activity, where earthquakes, for example, can have large impacts on the water infrastructure. However, such pressure is not included in the set of indicators developed for the original UWSD. Table 3. Description of the components of the original UWSD. Parts. Description. Description on the original UWSD approach. Indicators. Basic unit of analysis.. 56 static indicators that cover relevant aspects for UWS.. Analytical base Portrayal. Structure of analysis. Representation of the indicators and the analytical base.. System approach: pressure-state-impact-response (PSIR) Dashboard.. Development of indicators. Definition and/or selection and/or population of indicators.. Procedure described in article by van Ginkel et al. (2018) and its supplementary data.. In terms of visualization, one of the main criticisms towards the UWSD corresponds to the ability for the users to spot clear interrelations between indicators. Even though the PSIR approach comprises its analytical base, the UWSD fails to provide a clear system understanding. Characterizing UWS with appropriate indicators and recognizing their causal mechanisms with the help of a system approach, can assist the operationalization of the concept in “a broad, yet practicable, way” (van Ginkel et al., 2018, p.9). Nevertheless, the UWSD lacks a clear way to provide the user with the visualization of well-defined interrelations among elements and their causal mechanisms. Furthermore, a dashboard approach makes it even more complicated. A dashboard constitutes the UWSD choice of portrayal for the opportunity it provides to prevent information loss by displaying all variables at once (Hoekstra et al., 2018). However, information obtained in the experts’ consultation brought to light that the PSIR approach is complicated to understand, especially when there is a large number of variables displayed. The context of use and flexibility are not considered to any extent in the original UWSD approach. Table 4 provides a summary of the assessment of the UWSD. It provides a short description on if and how the UWSD is addressing the success criteria of a boundary object. Table 4. Quick assessment of the UWSD in terms of UWS indicator-based boundary object success criteria. Success Criteria. Meaning for original UWSD. Credibility Legitimacy. Indicators are scientifically valid. Considered to certain extent in the comprehensive search procedures found in the Indicators Formalisation and in the score of the elements that belong to the response dimension. Considered to certain extent in the search procedures found in the Indicators Formalisation. Analytical base: In theory PSIR allows to see issues as interconnected. In practice it is too complicated, and it does not give room for a clear visualization of the relationship between issues. Portrayal: dashboard. In theory it allows to show all variables at once to avoid information loss. In practice is overwhelming and distracting. Not considered. Not considered.. Salience Visualization. Context of use Flexibility. 5.2. Design: UWSD Approach (UWSDA). Reacting to the weaknesses found in the original UWSD, an upgraded UWSD together with a methodology that dictates it, from now on referred to as the UWSD Approach (UWSDA), were developed. We put emphasis on both the object (i.e. UWSDA) and the specifications to obtain it. The UWSDA is displayed in Figure 4. The UWSDA involves not only the boundary, or internal actor, behind its development, but also the potential users, or external actors, related to the object.. 12.
(13) Figure 4. Upgraded UWSD Approach.. The situation of UWS for a given area is context dependent (Cook & Bakker, 2012). Therefore, an integrative definition of UWS applied to a certain context must consider different variables. The notion of a static indicator-based framework contradicts the aforementioned condition. Accordingly, we take a step back and conceive the UWSDA as dynamic in a relatively similar way as the SETEG framework developed by Romero-Lankao & Gnatz (2016). This involves that we assert that the boundary actor who applies the UWSDA has the liberty to select adequate indicators and data sources to fit the categories proposed in Figure 5 for the area to be studied. The main changes and additions correspond to a rearrangement of the original UWSD categories and several additions. For pressures and state, the new categories are a logical partition from the originals. In the impact dimension we kept many of the original categories and developed three new categories: (1) basic water services replacing the original categories of water supply and sanitation, to capture the fulfilment of the population’s basic water needs; (2) conservation of natural resources, for the long-term sustainability of the natural water system; and (3) environmental protection, for the state of the water system in terms of pollution. These categories are derived in the same way as the original dashboard with an origin in the classification of the functions of the water systems provided by Brown et al. (2008). For the response dimension, an important addition was made: the inclusion of the individual and community capacity. While the original UWSD has a strong focus on governmental capacity, the UWSDA acknowledges that the societal response is equally important (Hoekstra et al., 2018). We conceptualize this category as the capacity of individuals and community to respond to water-related challenges when the government is unable or fails to provide (Krueger et al., 2019). The supplementary material Indicators Formalisation provides a full explanation of indicators that corresponds to the Step 1- Initial Dashboard of the UWSDA, which contains a set of indicators for each category and explains if they are either likely to be found in every context despite of its particularities from now on referred as static, therefore part of the Initial Dashboard, or are more likely to belong only to certain contexts from now on referred as dynamic. The development of indicators described earlier in this paragraph is consistent with the Step 2 – Development of Indicators. It is important to mention that, beyond the process of selection of indicators, the processes of definition and population of indicators can also change. For example, if a detailed study regarding flood propensity has been performed for the area and is publicly available, the boundary actor can change the search and score methods proposed to fit the study. This is also addressed with the static and dynamic labels in the Indicators Formalisation. To address the legitimacy and the salience in the UWSDA, we combined and adapted the methodologies proposed by Jensen & Wu (2018) and Pires et al. (2017). We propose a validation of indicators through a consultation of relevant actors by means of a digital questionnaire. The general questions include whether the indicators provide a representative picture of the following aspects: (1) the UWS pressures, states, impact and/or responses for the area; (2) whether their own perspective on the UWS for the area was reflected by the set of indicators, (3) whether any UWS concern was omitted, (4) whether any additional indicators should be included, (5) whether any indicator was poorly chosen, hard to understand and/or interpret, (6) whether any score was a source of disagreement, and (7) whether they were aware of other local sources of information. Furthermore, just as in the original UWSD, data on actors’ perceptions for the scoring of the response dimension was collected. The actors approached for the validation correspond to those likely to be the users of the object and their variety is attributed to the type of knowledge they provide. We consider that the required types of knowledge correspond to expert (or scientific), bureaucratic and stakeholder knowledge (Edelenbos et al., 2011). This procedure. 13.
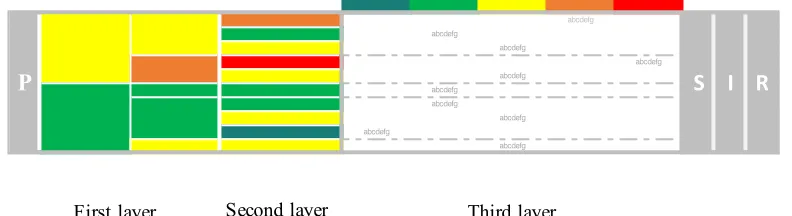
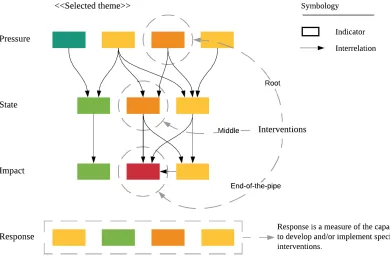
(14) corresponds to the Step 3 – Validation of Indicators. The questionnaires to be applied for this step can be found in Appendices 4 and 5.. Figure 5. UWSDA theoretical and Analytical Base. *corresponds to change and additions from the original UWSD.. In terms of visualization, we developed a layered dashboard. The layers allow the user to choose the level to which they want to explore information. This technique was suggested in the interviews. We used the WaterLOUPE tool developed by Deltares (Deltares, 2019) as an example for this type of visualization. Once the iteration between Steps 2 and 3 (Development and Validation of indicators) has taken place, we can apply the layered dashboard approach to the indicators and arrive at Step 4 – Validated Dashboard. Figure 6 provides a graphic that illustrates the layered dashboard approach and its characteristics. abcdefg abcdefg abcdefg abcdefg. P. abcdefg abcdefg. S I R. abcdefg abcdefg abcdefg abcdefg. First layer. Second layer. Third layer. Figure 6. Layered dashboard approach. Users of the dashboard can visualize the information in three layers, where the deeper you go, the more information you get. The first layer provides the upgraded UWSD categories and their correspondent score in the form of colours. The second layer provides the indicators that are behind the score of the category and their correspondent score. Lastly, the third layer provides the key aspect from which the score of each indicator was derived.. Furthermore, to make the interrelations among indicators visible, we propose the development of theme-related causal diagrams. Due to the many variables that the dashboard comprises, the issues of major concern need to be isolated. We followed the methodology of Linster (2003) who identifies the issues of concern for a selected area and breaks them down into a PSIR scheme. In the UWSDA, the main issues of concern, or themes, can be derived and broken down into elements with the indicators from the validated dashboard. This corresponds to the Step 6 – Identification of themes. Still, we propose a validation in Step 7 – Validation of themes to prevent the omission of any issues of concern. This question is included in the digital questionnaire from Step 3 – Validation of indicators. Once the issues are identified and validated, we can proceed to Step 7 – Development of Theme-Related Causal Diagrams and map the causal diagrams for the selected themes. It is very important to stress that the more specific and narrowed down the theme is, the clearer the diagram will be. The process for the development of the causal diagrams is illustrated in Figure 7. The response dimension is not mapped with the interrelation since it is assumed that it is a measure of the capacity to develop/or implement 14.
(15) specific interventions. It can be argued that good response capacity, such as the governmental or the institutional, is a necessary mean to improve water security rather than an outcome. One may therefore argue that it might not be scientifically correct to include response capacity as part of the assessment for UWS. Nevertheless, it is an important precondition to achieve a water secure future and it should be considered in its evaluation (Beek & Arriens, 2014).. Figure 7. Causal diagrams composition and interpretation. The colour of the indicators corresponds to their assigned score. Interventions are allocated by their level of action.. Step 8 – Allocation of Potential Interventions corresponds to the allocation of possible measures and takes place after the build-up of the theme-related causal diagrams. The logic behind this action is that more detailed solutions can be reached through a broad understanding of the system and its functions and the potential impacts of possible interventions. As an example, system approaches had been used as a common approach to develop causal loop diagrams under participatory processes for environmental and water management issues (Basco-Carrera & Francisco-Mendoza, 2017; Voinov & Bousquet, 2010; Voinov et al., 2016). This approach has proven to enhance social learning by creating a shared understanding of the problem which eventually leads to the development of potential solutions (BascoCarrera & Francisco-Mendoza, 2017). A study performed by Basco-Carrera et al (2017) used a coconstructed model that does justice to system dynamics that characterized system interactions and cause-effect relations in the context of water management. The authors proved that due to the use of such model, the awareness between the interconnections of the elements increased, even for those actors with non-technical backgrounds. It supported the policy decision making process by increasing the understanding of the different actors regarding the system and its functions so as the potential impacts of possible interventions. This eventually led to more detailed solutions such as decision support systems, awareness raising, and regulations and licensing, compared to those obtained in traditional processes such as better land use measures or better water resources management. The authors thus demonstrated that a lack of good understanding of the physical, socio-economic and institutional system will likely result in generic solutions whereas improved understanding results in more sophisticated measures. In addition, the PSIR approach allows to define their level of action: those interventions that take place in the impact dimension are considered end-of-the-pipe solutions whereas those that take place at the state are considered as root interventions. ‘Quick fixes’ or end-of the-pipe solutions to water security often result in new and more complicated problems (Hoekstra et al., 2018; Nazemi & Madani, 2018). This is why this approach gives the opportunity to allocate solutions higher in the chain. The interventions level is illustrated in Figure 7. 15.
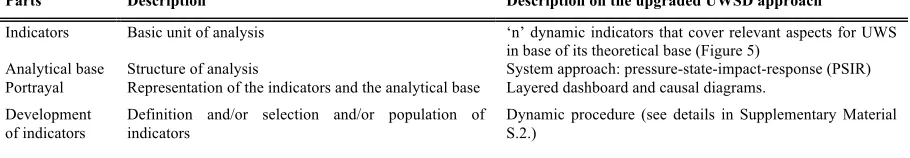
(16) For the context of use, it is of key importance to include the boundary actor(s) that developed the object in the process. Ideally, the actor must be neutral, and even though the actor should prestructure the problem, and give direction to the process and the use of the object, they should be outside the formal policy decision making process to avoid the use of the indicators as political tools with the purpose of defending one’s own interests (Howlett & Cuenca, 2017; Lehtonen, 2013; Molle & Mollinga, 2003). Furthermore, it is also important to keep in mind that actors should have been introduced to the object and its use before it is formally used in the policy decision making processes to make an efficient use of time and avoid confusions. A description of the components and an assessment of the upgraded UWSD approach are provided in Table 5 and Table 6 respectively. Table 5. Description of the components of the UWSDA. Parts. Description. Description on the upgraded UWSD approach. Indicators. Basic unit of analysis. Analytical base Portrayal. Structure of analysis Representation of the indicators and the analytical base. ‘n’ dynamic indicators that cover relevant aspects for UWS in base of its theoretical base (Figure 5) System approach: pressure-state-impact-response (PSIR) Layered dashboard and causal diagrams.. Development of indicators. Definition and/or selection and/or population of indicators. Dynamic procedure (see details in Supplementary Material S.2.). Table 6. Quick assessment of the UWSDA in terms of UWS indicator-based boundary object success criteria. Success Criteria. Meaning for original UWSD. Credibility Legitimacy. Indicators are scientifically valid capture levels and changes in the phenomena of interest. Considered to certain extent in the comprehensive search procedures found in the Indicators Formalisation and in the score of the elements that belong to the response dimension. Considered to certain extent in the search procedures found in the Indicators Formalisation. Analytical base: In theory PSIR allows to see issues as interconnected. In practice it is too complicated, and it does not give room for a clear visualization of the relationship between issues. Portrayal: dashboard. In theory it allows to show all variables at once to avoid information loss. In practice is overwhelming and distracting. Considered in the actors involved in the validation of indicators and themes. Additions can be made to the upgraded UWSD during the process.. Salience Visualization. Context of use Flexibility. 6. Application. This section describes the results of the application of the UWSDA to the case study of Mexico City and the Deltares experts’ session. Detailed information about the application to Mexico City can be found in the supplementary materials Indicators Formalisation and Mexico City UWSDA and the Appendices 4 and 5. 6.1. UWSDA Applied to Mexico City. The UWSDA was applied to the case study of Mexico City. The development of indicators for Mexico City considering the dynamic framework concept can be illustrated with two examples. First, economic stress for this case is measured by the gross income (UNDP, 2019) since precise data about GDP PPP (economic stress indicator proposed in the original UWSD) was not available. Gross income data information was publicly available for each of the boroughs of the city. This implies that not only the method changes, but also the scoring. The second example corresponds to the fact that the original UWSD conceives the areas below one meter above mean sea level as vulnerable to coastal flooding. Mexico City is not subjected to coastal flooding, but it is to urban floodings where the inherent topographic characteristics exacerbate the vulnerability to flooding of certain areas. Mexico City has an official in-depth study regarding areas prone to flood (Gobierno de la Ciudad de México, 2018) that takes topographic characteristics and historical floods data for their results. In face of this information, it was decided decided that it was an important addition for the Mexico City pool of indicators. 16.
(17) Table 7. Stakeholder analysis for the context of Mexico City. Classification by the knowledge distinctions introduced by Edelenbos et al. (2011). Expert Knowledge Universities (UNAM, LANCIS, IPN, UAM, etc.) Knowledge agencies (Rockefeller Foundation, WRI, World Bank, etc.). Bureaucratic Knowledge Governmental agencies (CONAGUA, SEDEMA, SEDUVI, IMTA, etc.) Authorities (head of government, public space authority, city major, etc.). Stakeholder Knowledge Water utilities (SACMEX) Designer firms and professional stakeholders (architects, engineers, contractors, consultants (e.g. Agencia de Resilencia Urbana, Isla Urbana, etc.) Representatives of the communities NGO’s (e.g. Agua para todos). Subsequently, the selection of indicators obtained was subjected to the validation process. To select the actors, we first conducted an analysis for their identification. The results of this analysis are listed in Table 7 where the main organizations related to water for the Mexican context are presented. We sent the validation questionnaire (results found in Appendix 4 and 5) to a large variety of actors considered as relevant for the context and kept it short (15-20 minutes as expected time of completion) with the purpose of ensuring a sufficient response rate. We evaluated the questions in a scale from 1 to 5, 1 being the lowest and 5 the highest. The average of the answers for each of the criteria assessed in the validation questionnaire was in all cases 4. This suggests that, in general, the different actors approached were satisfied with the overall selection of indicators. However, the lack of an indicator that measures the consumer willingness to pay for water was brought to light in the answers of the validation questionnaire. It is important to mention though, that this indicator could not be assembled into the final dashboard because the majority of the responses to the questionnaire were received outside the timeframe were changes could still be implemented. Once the selection of indicators was validated, the validated dashboards were assembled. The indicators selected for Mexico City and their score are presented in Table 8. The dashboard for the state dimension is displayed in Figure 8 as an example. The rest of the dashboards for Mexico City can be found in the supplementary material Mexico City UWSDA and more information about the indicators selected can be found in the one called Indicators Formalisation. Once the complete dashboard was filled out, important themes were identified. They were validated with the perception of the actors approached. The key validated themes were: (1) Local groundwater drawdown: Around 60% of the water supplied in Mexico City has its origin in the local aquifers (CONAGUA, 2016, 2018; Tortajada & Castelán, 2003; World Bank, 2013). They represent the most important source of water for the city. Yet, half of them are classified as overexploited (World Bank, 2013). Still, relevant studies regarding the expected time of depletion of the Mexican aquifers are scarce. (2) Water quality: Mexico City has the worst surface water quality of the entire country (CONAGUA, 2018; Tellman et al., 2018; Tortajada, 2006a). The levels of BOD (biochemical oxygen demand), COD (chemical oxygen demand), TSS (total solids suspended), and fecal coliforms are beyond the acceptable thresholds (CONAGUA, 2018). Groundwater has generally good quality with anomalies detected near to contamination hotspots (Alfredo Ramos Leal et al., 2010). However, in recent years, it has been reported to be degrading with more than 20% of the aquifers reported to being polluted (Godinez Madrigal et al., 2018). (3) Water image: In general, the inhabitants of Mexico City have a negative perception of water in the city. This comes as a result from the combination of the water-related problems to which the city is subjected. The case study revealed that this is one of the issues of most concern for most of the actors. (4) Stormwater flooding: Mexico City is regularly flooded in the rainy seasons (about half of the year) (De Urbanisten, 2016). Such floodings are characterized for their long duration, and the large societal disruption and damages that they cause (El País, 2017). (5) People with adequate water supply: Although most of the inhabitants have access to piped water either in the premise or in a radius of 10 minutes from the premise, the service is unreliable,. 17.
(18) intermittent and of dubious quality (Espinosa-García et al., 2014; González-Villarreal et al., 2016; INEGI, 2017; Tortajada, 2006b; WHO & UNICEF, 2015). Table 8. Selection of indicators for case study of Mexico City. Pressure Index Environmental pressures Climate Precipitation and variability Rainfall intensity Freshwater scarcity Land Area prone to flood. State Index 2 2 3 2 1 2. Natural resources Groundwater Groundwater availability Groundwater quality Surface water Surface water availability. Impact 2 4. Supply dependencies Water supply conflicts. 3. 3. Dependency on overexploited resources. 1. Vertical coordination and communication. 2. 1. Access to basic water services. 4. Corruption. 2. 1. People with adequate water supply. 3. 1. People with adequate sanitation. 4. Regulatory agreements. 2. 2. Enforcement capacity. 2. 3. Planning. 3. 1. 2. Subsidence. 1. Green spaces. 1. River flooding. 2. Garbage in surface and subsurface. 3. 3. Infrastructure. 2. Public health. 2. Water supply. 3. Water-associated diseases. Economy and Development. Clarity of roles and responsibilities. 2. Flood. Water supply coverage 4. 3. Horizontal coordination and communication. Land. Population Growth. 2. 3. Seismic hazard. Population. Institutional framework. Dependency on external resources. Surface water quality. Demographic. 2. 4. 3. Socio-economic. Response. 3. Stormwater flooding. Conservation of natural resources. Data and information. 2. 2. 2. Finance. 3. 2. Participatory decision-making. 3. 1. Strategic planning (disaster, water efficiency, sustainability, etc.). State of the water supply infrastructure. 3. 3. Adequacy of the water supply service. 2. Overexploitation of surface water bodies. 1. Inflation rate. 4. Sanitation. 2. Environmental protection. 3. Maintenance. 2. Education. 3. Sanitation coverage. 2. Pollution of surface water. 1. Efficiency. 2. Slums. 2. State of the sewer. 1. Pollution of groundwater. 3. Redundancy of critical nodes. 2. 5. Community and individual capacity. 2. 2. Individual water efficiency measures. 2. 1. Active community structures. 2. 1. Awareness and sense of urgency. 2. Geo-political Political stability Immigration rate Consumption behaviour. 3 3 2 2. Wastewater treatment Water treatment coverage Water treatment adequacy Flood protection. 3 2 3 2. Domestic water use. 1. River protection. 2. Water footprint of consumption. 2. Stormwater urban drainage. 2. Industrial activity. 1. Water-intensive industry External. 1. Condition upstream or significant outside watersheds. 2. 2. 18. Salt water intrusion Garbage in surface water Aesthetics and recreation Water image of the city. 1. Operational management. 3. 3. Economic stress. Local groundwater drawdown. 1. Accountability. Monitoring system. 2 3.
(19) Figure 8. State UWSDA dashboard for Mexico City. Indicators in grey are not applicable for the context and should be dismissed.. 19.
(20) Figure 9. Sample PSIR diagram for groundwater pollution in Mexico City.. Figure 9 displays the causal diagram for groundwater pollution. It can be seen that groundwater pollution is connected to many elements higher in the PSIR chain. For example, the state of the sewer is very insecure, some parts are almost 300 years old and it’s full of leakages (Tellman et al., 2018; Tortajada & Castelán, 2003). Those leakages allow untreated wastewater to perm to the aquifers and contribute to the groundwater pollution. Furthermore, the rainy seasons in combination with the garbage stored in the land subsurface, decreases the quality of the stormwater that infiltrates to the aquifers. The diagram also shows that during the rainy seasons, the drainage is insufficient and the wastewater in combination with the rainwater produces water associated diseases (Baeza et al., 2018). Figure 9 also displays potential discussions that can arise about possible interventions and how are they related to the system. 6.2. UWSDA in its Context of Use: Deltares Expert Session. We conducted the Deltares Expert session to evaluate the effects produced by the UWSDA in its context of use. Appendix 6 contains the actors involved in the session and their expertise. The role of the boundary actor in the experts’ session was assigned to the authors of this study. At the beginning of the document, we characterized the expected result of this research, the UWSDA, as a boundary object. From the definition of boundary object, we can derive five main goals, namely (1) instrument that functions as a knowledge base and (2) is capable of enabling effective communication across different scientific domains, policy divides and stakeholders in the sciencepolicy interface. It has the purpose of assisting knowledge co-production to arrive at an (3) integrative definition of the problem, (4) establish a priority agenda, and (5) serve as a solid base for an enriched policy decision making towards effective action perspectives for urban water security. Following, we. 20.
(21) will address each of the goals and will explain the related effects produced by the UWSDA in its context of use: (1) The UWSDA and its products, namely the dashboards and diagrams, acted as a very comprehensive knowledge base regarding the UWS situation of Mexico City. The provided the actors involved in the meeting with relevant information regarding the water situation of Mexico City; (2) Since the actors that were approached for validation were those that actually belong to the context of use of the UWSDA applied to Mexico City, there were many sources of conflict about the indicators selected, their composition and their scores for the actors involved in the session. This situation imposed a more intensive role to the boundary actor in clarifying confusions. Furthermore, the experts gave some feedback on how to introduce the object to the intended audience to facilitate its comprehension; (3) Nevertheless, the participants of the session engaged into a joint problem formulation process that considered different perspectives through dialogues inspired by the indicators and its measurements; (4) Conclusions about the key concerns for Mexico City and their causality were developed. As expected, new information was brought to light, especially regarding the causality of the problems and the interconnections between different indicators, which confirms the importance of the flexibility for the object. In fact, the causal diagrams had to be almost fully mapped during the session. This revealed that the understanding of the interrelations of the water system and among different issues increases when the maps are drawn together with the actors; (5) Finally, discussions around potential interventions took place, and although there was no consensus on concrete solutions, actors acknowledge that they were much more aware of the limitations of the system. Furthermore, they were able to perceive a link between the measures that they were proposing and the influence that they would have on the phenomena that the indicators were measuring and vice versa. 7. Discussion. The present section provides the discussion about key important findings of the application of the design and a comparison between the UWSDA and other similar objects. 7.1. Application of the UWSDA. For the development of indicators, there are five important points to discuss. First, different trade-offs are in place between credibility, salience and legitimacy. As identified by Sarkki et al. (2014), these are context dependent and must be treated according to the situation. For example, as mentioned before, Mexico City suffers from a lack of information regarding the levels of the aquifers. Given the importance of the aquifers for the Mexican context, the government could issue mandates to develop the necessary studies. This argument brings an important point to light, the credibility, legitimacy and salience of a boundary object are highly dependent on external factors. Perhaps, the only decision given to the boundary actors corresponds to a balance in terms of the indicators’ selection. To exemplify this, we make use of the following statement: Zeitoun et al. ( 2016) argue that for policy decision making regarding water security to be sustainable, ‘nexus’ issues, such as the water-energy-food nexus, must be considered. Although we agree with the aforementioned statement, to preserve the balance of the boundary object, important cross-sectoral interdependencies may not be illustrated in depth in the UWSDA. This may reduce credibility but increases salience and visualization. Now, if the context corresponds to a city where the economy is driven by coal energy production, such nexus cannot be neglected. This emphasizes the argument that the trade-offs are context dependent. Other examples of trade-offs found within the results of the application of the UWSDA to Mexico City are: credibility vs legitimacy where extensive research procedures enhance legitimacy but might decrease credibility for the difficulty of access the information; legitimacy vs salience where including a wide-variety of perspectives enhances legitimacy but might decrease salience due to an increased number of indicators; 21.
Figure
+7

Related documents
This research has extended our understanding of relationship quality including the triggers for attrition, the thought process customers go through when leaving their
olism of carbon-i4 labeled pyruvate by the newborn rat. : Anaerobic lipogenesis in fetal liver slices. : Ef-. fects of oxygen deprivation on the me- tabolism of fetal and adult
Standardization of herbal raw drugs include passport data of raw plant drugs, botanical authentification, microscopic & molecular examination, identification of
On the Saudi Gulf coast the major environmental effects of coastal and marine use.. are concentrated in and around, Jubayl and
In (c), we checked for both heterogeneity linked to observable characteristics of the responses, and to unobservable heterogeneity, which resulted in random-coefficient models.
The observed signal strengths for the individual analyses and their combination are shown in Figure 5.28a, while Table 5.5 summarizes the observed and expected µ, as well as
In this PhD thesis new organic NIR materials (both π-conjugated polymers and small molecules) based on α,β-unsubstituted meso-positioning thienyl BODIPY have been
