Original citation:
Hislop, Jenni, Adewuyi, Temitope E., Vale, Luke D., Harrild, Kirsten, Fraser, Cynthia,
Gurung, Tara, Altman, Douglas G., Briggs, Andrew H., Fayers, Peter, Ramsay, Craig R.,
Norrie, John D., Harvey, Ian M., Buckley, Brian and Cook, Jonathan A.. (2014) Methods
for specifying the target difference in a randomised controlled trial : the difference
ELicitation in TriAls (DELTA) systematic review. PLoS Medicine, Volume 11 (Number 5).
Article number e1001645.
Permanent WRAP url:
http://wrap.warwick.ac.uk/65669
Copyright and reuse:
The Warwick Research Archive Portal (WRAP) makes this work of researchers of the
University of Warwick available open access under the following conditions.
This article is made available under the Creative Commons Attribution 4.0 International
license (CC BY 4.0) and may be reused according to the conditions of the license. For
more details see:
http://creativecommons.org/licenses/by/4.0/
A note on versions:
The version presented in WRAP is the published version, or, version of record, and may
be cited as it appears here.
Randomised Controlled Trial: The Difference ELicitation
in TriAls (DELTA) Systematic Review
Jenni Hislop1, Temitope E. Adewuyi2, Luke D. Vale1, Kirsten Harrild3, Cynthia Fraser4, Tara Gurung5,
Douglas G. Altman6, Andrew H. Briggs7, Peter Fayers3,8, Craig R. Ramsay4, John D. Norrie9,
Ian M. Harvey10, Brian Buckley11, Jonathan A. Cook4,6* "
1Institute of Health and Society, Newcastle University, Newcastle upon Tyne, United Kingdom,2Academic Urology Unit, University of Aberdeen, Aberdeen, United Kingdom,3Population Health, University of Aberdeen, Aberdeen, United Kingdom,4Health Services Research Unit, University of Aberdeen, Aberdeen, United Kingdom,
5Warwick Evidence, University of Warwick, Coventry, United Kingdom,6Centre for Statistics in Medicine, Nuffield Department of Orthopaedics, Rheumatology and Musculoskeletal Sciences, University of Oxford, Oxford, United Kingdom,7Institute of Health and Wellbeing, University of Glasgow, Glasgow, United Kingdom,
8Department of Cancer Research and Molecular Medicine, Norwegian University of Science and Technology, Trondheim, Norway,9Centre for Healthcare Randomised Trials, University of Aberdeen, Aberdeen, United Kingdom,10Faculty of Health, University of East Anglia, Norwich, United Kingdom,11National University of Ireland, Galway, Ireland
Abstract
Background: Randomised controlled trials (RCTs) are widely accepted as the preferred study design for evaluating healthcare interventions. When the sample size is determined, a (target) difference is typically specified that the RCT is designed to detect. This provides reassurance that the study will be informative, i.e., should such a difference exist, it is likely to be detected with the required statistical precision. The aim of this review was to identify potential methods for specifying the target difference in an RCT sample size calculation.
Methods and Findings:A comprehensive systematic review of medical and non-medical literature was carried out for methods that could be used to specify the target difference for an RCT sample size calculation. The databases searched were MEDLINE, MEDLINE In-Process, EMBASE, the Cochrane Central Register of Controlled Trials, the Cochrane Methodology Register, PsycINFO, Science Citation Index, EconLit, the Education Resources Information Center (ERIC), and Scopus (for in-press publications); the search period was from 1966 or the earliest date covered, to between November 2010 and January 2011. Additionally, textbooks addressing the methodology of clinical trials and International Conference on Harmonisation of Technical Requirements for Registration of Pharmaceuticals for Human Use (ICH) tripartite guidelines for clinical trials were also consulted. A narrative synthesis of methods was produced. Studies that described a method that could be used for specifying an important and/or realistic difference were included. The search identified 11,485 potentially relevant articles from the databases searched. Of these, 1,434 were selected for full-text assessment, and a further nine were identified from other sources. Fifteen clinical trial textbooks and the ICH tripartite guidelines were also reviewed. In total, 777 studies were included, and within them, seven methods were identified—anchor, distribution, health economic, opinion-seeking, pilot study, review of the evidence base, and standardised effect size.
Conclusions: A variety of methods are available that researchers can use for specifying the target difference in an RCT sample size calculation. Appropriate methods may vary depending on the aim (e.g., specifying an important difference versus a realistic difference), context (e.g., research question and availability of data), and underlying framework adopted (e.g., Bayesian versus conventional statistical approach). Guidance on the use of each method is given. No single method provides a perfect solution for all contexts.
Please see later in the article for the Editors’ Summary.
Citation:Hislop J, Adewuyi TE, Vale LD, Harrild K, Fraser C, et al. (2014) Methods for Specifying the Target Difference in a Randomised Controlled Trial: The Difference ELicitation in TriAls (DELTA) Systematic Review. PLoS Med 11(5): e1001645. doi:10.1371/journal.pmed.1001645
Academic Editor:Michael Dewey, Institute of Psychiatry, King9s College London, United Kingdom
ReceivedSeptember 10, 2013;AcceptedApril 4, 2014;PublishedMay 13, 2014
Copyright:ß2014 Hislop et al. This is an open-access article distributed under the terms of the Creative Commons Attribution License, which permits unrestricted use, distribution, and reproduction in any medium, provided the original author and source are credited.
Data Availability:The authors confirm that all data underlying the findings are fully available without restriction. Reviewing documentation is available from the authors.
Funding:This study was part of a project commissioned and funded by the UK Medical Research Council & National Institute for Health Research Joint Methodology Research Programme (G0902147 & 06/98/01). JAC holds a Medical Research Council Methodology Fellowship (G1002292). The Health Services Research Unit is funded by the Scottish Government Health and Social Care Directorates. The funders had no involvement in study design, collection, analysis and interpretation of data, reporting or the decision to publish. The full project findings will be published in the Health Technology Assessment Journal. Views express are those of the authors and do not necessarily reflect the views of the funders nor of the UK Government’s Department of Health.
Competing Interests:The authors have declared that no competing interests exist.
Abbreviations:ICH, International Conference on Harmonisation of Technical Requirements for Registration of Pharmaceuticals for Human Use; RCT, randomised controlled trial; SD, standard deviation; SEM, standard error of measurement; SES, standardised effect size.
* E-mail: [email protected]
"Membership of the DELTA group is provided in the Acknowledgments.
Introduction
A randomised controlled trial (RCT) is widely regarded as the preferred study design for comparing the effectiveness of health interventions [1]. Central to the design and validity of an RCT is a calculation of the number of participants needed: the sample size. This provides reassurance that the study will be informative. Using the Neyman-Pearson method (a conventional approach to sample size calculation), a (target) difference that the RCT is designed to detect is typically specified.
Selecting an appropriate target difference is critical. If too small a target difference is estimated, the trial may be a wasteful and an unethical use of data and resources. If too large a target difference is hypothesized, there is a risk that a clinically relevant difference will be overlooked because the study is too small. Both extremes could therefore have a detrimental impact on decision-making [2]. Additionally, through its impact on sample size, the choice of target difference has substantial implications in terms of study conduct and associated cost.
However, unlike the statistical considerations involved in sample size calculation, research on how to specify the target difference has been greatly neglected, with no substantive guidance available [3,4]. While a variety of potential approaches have been proposed, such as specifying what an important difference would be (e.g., the ‘‘minimal clinically important difference’’) or what a realistic difference would be given the results of previous studies, the current state of the evidence base is unclear. Although some reviews of different types of methods have been conducted [2,5], there is still a need for a comprehensive review of available methods. The aim of this systematic review was to identify potential methods for specifying the target difference in an RCT sample size calculation, whether addressing an important differ-ence (a differdiffer-ence viewed as important by a relevant stakeholder group [e.g., clinicians]) and/or realistic difference (a difference that can be considered to be realistic given the interventions to be evaluated). The methods are described, and guidance offered on their use.
Methods
A comprehensive search of both biomedical and selected non-biomedical databases was undertaken. Search strategies and databases searched were informed by preliminary scoping work. The final databases searched were MEDLINE, MEDLINE In-Process, EMBASE, the Cochrane Central Register of Controlled Trials, the Cochrane Methodology Register, PsycINFO, Science Citation Index, EconLit, Education Resources Information Center (ERIC), and Scopus (for in-press publications) from 1966 or earliest date coverage; the searches were undertaken between November 2010 and January 2011. Given the magnitude of the literature identified by this initial search and the belief that updating the search would not lead to additional approaches of specifying the target difference, an update of this search was not carried out. There was no language restriction. It was anticipated that reporting of methods in the titles and abstracts would be of variable quality and that therefore a reliance on indexing and text word searching would be inadvisable. Consequently, several other
methods were used to complement the electronic searching and included checking of reference lists, citation searching for key articles using Scopus and Web of Science, and contacting experts in the field. The protocol and details of the search strategies used are available in Protocol S1 and Search Strategy S1.
Additionally, textbooks covering methodological aspects of clinical trials were consulted. These textbooks were identified by searching the integrated catalogue of the British Library and the catalogues (for the most recent 5 y) of several prominent publishers of statistical texts. The project steering group was also asked to suggest key clinical trial textbooks that could be assessed. Because of the nature of the review, ethical approval was unnecessary.
To be included in this review, each study had to report a formal method that had been used or could be used to specify a target difference. Any study design for original research was eligible, provided its assessment was based on at least one outcome of relevance to a clinical trial. Studies were excluded only if they were reviews, failed to report a method for specifying a target difference, reported only on statistical sample size considerations rather than clinical relevance, or assessed an outcome measure (e.g., number needed to treat) without reference to how a difference could be determined.
Potentially relevant titles and abstracts were screened by either or both of two reviewers (J. H. or T. G.), with any uncertainties or disagreements discussed with a third party (J. A. C.). Full-text articles were obtained for the titles and abstracts identified as potentially relevant. These were provisionally categorised accord-ing to method of specifyaccord-ing the target difference (if detailed in the abstract). One of four reviewers (J. H., T. G., K. H., or T. E. A.) screened the full-text articles and extracted information, after having screened and extracted information from a practice sample of articles and compared results to ensure consistency in the screening process. Where there was uncertainty regarding whether or not a study should be included for data extraction, the opinion of a third party (J. A. C.) was sought, and the study discussed until consensus was reached.
Data were extracted on the methodological details and any noteworthy features such as unique variations not found in other studies reporting the same method. Specific information relevant to each particular method was recorded, and no generic data extraction form was used across all methods. It was felt that a generic data extraction form that included all fields of relevance to all methods would be too cumbersome, because the methods varied in conception and implementation.
Results
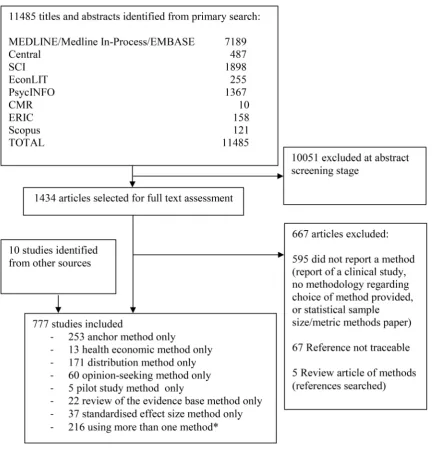
We identified 11,485 potentially relevant studies from the databases searched. The number of studies found within each database is detailed in Figure 1 (PRISMA flow diagram), showing the number of studies for each method.
Of the potentially relevant studies identified, 1,434 were selected for full-text assessment; a further nine were identified from other sources. Fifteen clinical trial textbooks and the International Conference on Harmonisation of Technical Requirements for Registration of Pharmaceuticals for Human Use tripartite guide-lines were also reviewed, though none identified a method that had not already been identified from the journal database searches. In total, 777 studies were included. Seven methods were identified— anchor, distribution, health economic, opinion-seeking, pilot study,
review of the evidence base, and standardised effect size (SES). Descriptions of these methods are provided in Box 1. No methods were identified by this review beyond those already known to the reviewers. The anchor, distribution, opinion-seeking, review of the evidence base, and SES methods were used in studies in varied clinical and treatment areas, but predominantly in those pertaining to chronic diseases. Although the number of included studies for both the health economic and pilot study methods was much smaller, real or hypothetical trial examples covered pharmacolog-ical and non-pharmacologpharmacolog-ical treatments for both acute and chronic conditions.
[image:4.612.62.495.62.513.2]Substantial variation between studies was found in the way the seven methods were implemented. In addition, some studies used several methods, although the combinations used varied, as did the extent to which results were triangulated. The anchor method was Figure 1. PRISMA flow diagram.*For a breakdown of studies that used more than one method in combination, please see Table 1. Central, Cochrane Central Register of Controlled Trials; CMR, Cochrane Methodology Register; ERIC, Education Resources Information Center; SCI, Science Citation Index.
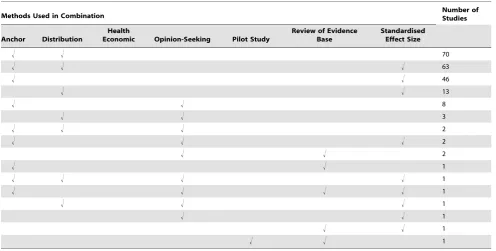
the most popular, used by 447 studies, of which 194 (43%) used it in combination with another method. The distribution method was used by 324 studies, of which 153 (47%) used it alongside another method. Eighty studies used an opinion-seeking method, of which 20 (25%) also used additional methods. Twenty-seven studies used a review of the evidence base method, of which five (19%) also used another method. Six studies used a pilot study method, of which one (17%) also used another method. The SES method was used by 166 studies, of which 129 (78%) also used another method. Thirteen studies used a health economic method. For all methods used in combination with others, Table 1 provides a breakdown of the variety of combinations identified and their frequency. The main variations identified from the systematic review for each of the methods are described in Table 2, and are further described in the text below. A brief summary of the literature for each method is given below and also of studies that used a combination of methods. Table 3 contains an assessment of the value of the individual methods. Table 4 contains examples and key implementation points for the use of each method.
Anchor Method
Implementation of the anchor method varied greatly [6–37]. In its most basic form, the anchor method evaluates the minimal (clinically) important change in score for a particular instrument. This is established by calculating the mean change score (post-intervention minus pre-(post-intervention) for that instrument, among a group of patients for whom it is indicated—via another instrument
(the ‘‘anchor’’)—that a minimum clinically important change has occurred. The anchor instrument, the number of available points on the anchor instrument for response, and the corresponding labelling varied between applications. The anchor instrument was most often a subjective assessment of improvement (e.g., global rating of change), though objective measures of improvement could be used (e.g., a 15-letter change in visual acuity as measured on the Snellen eye chart) [34]. The anchor instrument was usually posed to patients alone [19,35], though in some cases the clinicians’ views alone were used. Older studies tended to use a 15-point Likert scale for the anchor instrument, as suggested by Jaeschke and colleagues [16]; more recent studies tended to use five- or seven-point scales instead. Depending upon the study size and/or clinical context, merging of multiple points on the scale may be required. For example, if a seven-point scale has been used but very few people rate themselves at the extremes of this scale (1 and 7), it may be possible to merge points 1 and 2 of the scale and points 6 and 7. It should be noted that it may not always be appropriate to do this, depending on the clinical question under consideration.
Relative change can be incorporated by comparing those for whom an important change was identified to another patient subset (tested using the same instrument and anchor) who reported no change over time. Another common variation is to consider the percentage change score in the instrument under consideration [33], rather than the absolute score change. Determination of what constituted an important difference was sometimes based
Box 1. Methods for Specifying an Important and/or Realistic Difference
Methods for specifying an important difference
N
Anchor:The outcome of interest can be ‘‘anchored’’ byusing either a patient’s or health professional’s judgement to define an important difference. This may be achieved by comparing a patient’s health before and after treatment and then linking this change to participants judged to have shown improvement/deterioration. Alternatively, a more familiar outcome, for which patients or health professionals more readily agree on what amount of change constitutes an important difference, can be used. Alternatively, a contrast between patients can be made to determine a meaningful difference.
N
Distribution:Approaches that determine a value based upon distributional variation. A common approach is to use a value that is larger than the inherent imprecision in the measurement and therefore likely to represent a minimal level for a meaningful difference.N
Health economic: Approaches that use principles of economic evaluation. These typically include both resource cost and health outcomes, and define a threshold value for the cost of a unit of health effect that a decision-maker is willing to pay, to estimate the overall net benefit of treatment. The net benefit can be analysed in a frequentist framework or take the form of a (typically Bayesian) decision-theoretic value of information analysis.N
Standardised effect size:The magnitude of the effect on a standardised scale defines the value of the difference. For a continuous outcome, the standardised difference (most commonly expressed as Cohen’s d ‘‘effect size’’) can be used. Cohen’s cutoffs of 0.2, 0.5, and 0.8 for small, medium, and large effects, respectively, are often used. Thus a ‘‘medium’’ effect corresponds simply to a change inthe outcome of 0.5 SDs. Binary or survival (time-to-event) outcome metrics (e.g., an odds, risk, or hazard ratio) can be utilised in a similar manner, though no widely recognised cutoffs exist. Cohen’s cutoffs approximate odds ratios of 1.44, 2.48, and 4.27, respectively. Corresponding risk ratio values vary according to the control group event proportion.
Methods for specifying a realistic difference
N
Pilot study:A pilot (or preliminary) study may be carried out where there is little evidence, or even experience, to guide expectations and determine an appropriate target difference for the trial. In a similar manner, a Phase 2 study could be used to inform a Phase 3 study.Methods for specifying an important and/or a realistic difference
N
Opinion-seeking: The target difference can be based on opinions elicited from health professionals, patients, or others. Possible approaches include forming a panel of experts, surveying the membership of a professional or patient body, or interviewing individuals. This elicitation process can be explicitly framed within a trial context.upon the use of methodology more typically used to assess diagnostic accuracy, such as receiver operating characteristic curves [6,11,20], or more complex statistical approaches. It is worth noting that the anchor method was not always successful in deriving values for an important difference; failure was usually due to either practical or methodological difficulties [17,23].
A substantially different way of achieving an anchor-based approach for specifying an important difference was proposed by Redelmeier and colleagues [28]: in this study, other patients formed a reference against which a patient could rate their own health (or health improvement) [10,27–30]. Generalisability of the resulting estimate of an important difference is a key concern. For example, if the disease is chronic and progressive, an important change value from a newly diagnosed population may not apply to a population with a far longer duration of illness [15,24,25,32,36]. A key consideration is how to decide on an appropriate cutoff point for the anchor ‘‘transition’’ tool.
Participant biases, such as recall bias, are also potentially problematic [13,14,21,22,25], as are response shift (whereby patients’ perceptions of acceptable change alter during the course of disease or treatment and become inconsistent) [37] and gratitude factor or halo bias (whereby responses that are more favourable than is realistic need to be taken into account) [31,35]. Another key choice is whether to consider improvement and deterioration together or separately. If a Likert scale has been used as the anchor, improvement and deterioration can be merged to obtain one more general measure for ‘‘change’’ by ‘‘folding’’ the scale at zero, though this assumes symmetry of effect, with ‘‘no change’’ centred upon zero difference. This approach may be unrealistic because of response biases and regression to the mean, and is inappropriate if patients are likely to rate improvements in their health differently from how they would rate deterioration with the same condition. The method proposed by Redelmeier and colleagues, where other participants act as the anchor, avoids recall bias because all data can be collected at the same time,
though it may not be a universally appropriate method, as participants might find it difficult to discuss particularly sensitive or private health issues with others.
Distribution Method
Three distinct distribution approaches were found [38–56]: measurement error, statistical test, and rule of thumb. The measurement error approach determines a value that is larger than the inherent imprecision in the measurement and that is therefore likely to be consistently noticed by patients. The most common approach for determining this value was based upon the standard error of measurement (SEM). The SEM can be defined in various ways, with different multiplicative factors suggested as signifying a non-trivial (important) difference.
The most commonly used alternative to the SEM method (although it can be thought of as an extension of this approach) was the reliable change index proposed by Jacobson and Truax [47], which incorporates confidence around the measurement error. For the statistical test approach, a ‘‘minimal detectable difference’’—the smallest difference that could be statistically detected for a given sample size—is calculated. This is then used as a guide for interpreting the presence of an ‘‘important’’ difference in this study. The rule-of-thumb approach defines an important difference based on the distribution of the outcome, such as using a substantial fraction of the possible range without further justifica-tion (e.g., 10 mm on a 100-mm visual analogue scale measuring symptom severity being viewed as a substantial shift in outcome response) [54].
[image:6.612.63.560.89.340.2]Measurement error and rule-of-thumb approaches are widely used, but do not translate straightforwardly to an RCT target difference. This is because for measurement error approaches, assessment is typically based on test–retest (within-person) data, whereas many trials are of parallel group (between-person) design. Additionally, measurement error is not suitable as the sole basis for determining the importance of a particular target difference. More
Table 1.Use of multiple methods.
Methods Used in Combination Number ofStudies
Anchor Distribution
Health
Economic Opinion-Seeking Pilot Study
Review of Evidence Base
Standardised Effect Size
! ! 70
! ! ! 63
! ! 46
! ! 13
! ! 8
! ! 3
! ! ! 2
! ! ! 2
! ! 2
! ! 1
! ! ! ! 1
! ! ! ! 1
! ! ! 1
! ! 1
! ! 1
! ! 1
Table 2. Main variations in implementation of the methods. Anchor Distribution Health Economic Opinion-Seeking Pilot S tudy Review of the Evidence Base S tandardised Effect Size Two main a reas of variation: 1. Anchor design N Judgement based anchor (e.g., patient’s, health professional’s, or carer’s); judgements can be changes in individual over time or contrasting between individuals N The number o f points on the anchor instrument (Likert scale, VAS)
[8,9,12] NObjective measurements
(e.g., $ 5 m m toenail growth) as the anchor [26] N Using a measure with an accepted definition o f importance as an the a nchor 2.
Determination ofimportant difference
N Considering deterioration a s w ell as improvement
[7,18,22] NCalibrating
generally, the setting and timing of data collection may also be important to the calculation of measurement error (e.g., results may vary between pre- and post-treatment) [52]. The statistical test approach cannot be used to specify a priori a target difference in an RCT sample size calculation, as the observed precision of the statistical test is conditional on the sample size. Rule-of-thumb approaches are dependent upon the outcome having inherent value (e.g., Glasgow coma scale), where a substantial fraction of a unit change (e.g., one-third or one-half) can be viewed as important.
Health Economic Method
The approaches included under the health economic method typically involve defining a threshold value for the cost of a unit of health effect that a decision-maker is willing to pay and using this threshold to construct a ‘‘net benefit’’ that combines both resource cost and health outcomes [57–65]. The extent to which data on the differences in costs, benefits, and harms are used depends on the decision and perspective adopted (e.g., treatment x is better than treatmentywhen the net benefit forxis greater than that for
y,i.e., the incremental net benefit forxcompared toyis positive) [62]. The net benefit approach can be extended into a decision-theoretic model in order to undertake a value of information analysis [60,61,65], which seeks to address the value of removing the current uncertainty regarding the choice of treatment. The optimal sample size of a new study given the current evidence and the decision faced can be calculated. The perspective of the decision-making is critical, i.e., whether it is from the standpoint of clinicians, patients, funders, policy-makers, or some combination. More sophisticated modelling approaches can potentially allow a comprehensive evaluation of the treatment decision and the potential value of a new study, though they require strong assumptions about, for example, different measurements of effectiveness, harms, uptake, adherence, costs of interventions, and the cost of new research. The increased complexity, along with the gap between the input requirements of the more sophisticated modelling approaches and the data that are typically available, and the need to be explicit about the basis of synthesis of all the evidence upfront, perhaps explains the limited use of these modelling approaches in practice to date.
Opinion-Seeking Method
The opinion-seeking method determines a value (or a plausible range of values) for the target difference, by asking one or more individuals to state their view on what value or values for a particular difference should be important and/or realistic [66–86]. The identified studies varied widely in whose opinion was sought (e.g., patients, clinicians, or trialists), the method of selecting individual experts (e.g., literature search, mailing list, or confer-ence attendance), and the number of experts consulted. Other variations included the method used to elicit values (e.g., interview or survey), the complexity of the data elicited, and the method used to consolidate results into an overall value or range of values for the difference.
One advantage of the opinion-seeking method is the ease with which it can be carried out (e.g., through a survey). However, estimates will vary according to the specified population. Additionally, different perspectives (e.g., patient versus health professional) may lead to very different estimates of what is important and/or realistic [73]. Also, the views of approached individuals may not necessarily be representative of the wider community. Furthermore, some methods for eliciting opinions have feasibility constraints (e.g., face-to-face methods), but alternative approaches for capturing the views of a larger number
of experts require careful planning or may be subject to low response rates or partial responses [77].
Pilot Study Method
A small number of studies used a pilot study method to determine a relevant value for the target difference [87–90]. A pilot study can be defined as running the intended study in miniature prior to conducting the actual trial, to guide expecta-tions on an appropriate value for the target difference. The simplest approach is to use the observed effect in the pilot study as the target difference in an RCT. More sophisticated approaches account for imprecision in the estimate from the pilot study and/ or use the pilot study to estimate only the standard deviation (SD) (or control group event proportion) and not the target difference. However, there are practical difficulties in conducting a pilot study that may limit the relevance of results [87], most notably the inherent uncertainty in results due to the small study sample size, rendering the effect size imprecise and unreliable. Additionally, a pilot study can address only a realistic difference and does not inform what an important difference would be. Finally, it is worth noting that an internal pilot study, using the initial recruits within a larger study, cannot be used to pre-specify the target difference, though it could inform an adaptive update [90]. Notwithstanding the above critique, a pilot study can have a valuable role in addressing feasibility issues (e.g., recruitment challenges) that may need to be considered in a larger trial [89]. Pilot studies are most useful when they can be readily and quickly conducted. While few studies addressed using a pilot study to inform the specification of the target difference, trialists may use pilot studies to help determine the target difference without reporting this formally in trial reports.
Review of the Evidence Base Method
Implementation of the review of the evidence base method varied regarding what studies and results were considered as part of the review and how the findings of different studies were combined [91–103]. The most common approach involved implementing a pre-specified strategy for reviewing the evidence base for either a particular instrument or variety of instruments to identify an important difference. Alternatively, pre-existing studies for a specific research question may be used (e.g., using the pooled estimate of a meta-analysis) to determine the target difference [100]. Extending this general approach, Sutton and colleagues [101] derived a distribution for the effect of treatment from the meta-analysis, from which they then simulated the effect of a ‘‘new’’ study; the result of this study was added to the existing meta-analysis data, which were then re-analysed. Implicitly this adopts a realistic difference as the basis for the target difference.
Table
3.
Assessment
of
the
value
of
the
methods.
Criteria
Method Anchor
Distribution
Health
Economic
Opinion-Seeking
Pilot
S
tudy
Review
of
the
Evidence
Base
Standardised Effect
Size
Validity Does
the
method
seem
a
sensible
approach)?
(face
validity)
Yes
N
o
Y
es
Yes
Yes
Yes
Yes
Does
the
method
allow
the
o
verall
benefit/harm
profile
of
a
treatment
comparison
to
b
e
a
ddressed?
(content
validity)
As
it
is
based
upon
a
single
o
utcome,
the
scope
is
limited;
multiple
perspectives
can
be
accommodated
Focuses
upon
a
single
outcome
and
does
not
address
directly
either
a
realistic
or
an
important
d
ifference
Potentially
the
most
comprehensive approach,
though
it
can
be
complex,
data-hungry,
and
time-intensive;
a
value
judgement
is
needed
as
to
whose
costs
and
benefits
are
important
Yes,
though
conditional
upon
a
p
erspective
Yes
Yes
No
Has
the
method
been
shown
to
be
consistent
w
ith
an
independent
standard?
(criterion
validity)
Yes
N
o
No,
usage
so
far
has
been
in
hypothetical
retrospective examples
No
No
No
No,
with
an
exception
for
some
quality
of
life
outcomes
Has
the
method
been
shown
to
be
consistent
w
ith
expected
drivers
(e.g.,
is
the
specified
difference
greater
when
there
is
a
larger
risk
of
harm)?
(construct
validity)
Yes
Findings
have
been
conflicting
No,
usage
so
far
has
been
in
hypothetical
retrospective examples
No
Yes
Yes
No
Implementation Has
the
method
been
reported
clearly
enough
to
be
reproducible
(i.e.,
reviewers
can
easily
agree
upon
reading
what
the
method
was
a
nd
how
it
was
applied)?
Yes
Y
es
Yes,
although
the
complexity
of
some
of
the
a
pproaches
may
require
extensive
reporting
Yes
Yes
Yes
Yes
Are
there
a
ny
important
variations
in
implementation?
Yes
Y
es
Yes
Yes
Yes
Yes
Yes
Statistical
properties
Has
the
method’s
repeatability
been
assessed
(consistency
of
estimate
when
repeated—if
applicable)?
Yes
Y
es
No,
although
in
principle
for
a
given
model
structure
and
data
inputs,
the
approach
is
repeatable
No
No
Yes
Not
applicable
Is
uncertainty
of
the
estimated
difference
addressed
by
the
m
ethod
(implicitly
or
explicitly)?
Yes
Y
es
Yes,
using
the
more
complex
approaches
Yes,
when
adopting
a
synthesis
of
opinion
Yes
Yes,
where
the
result
from
a
n
appropriate statistical
analysis
is
used
Table
3.
Cont.
Criteria
Method Anchor
Distribution
Health
Economic
Opinion-Seeking
Pilot
S
tudy
Review
of
the
Evidence
Base
Standardised Effect
Size
Has
the
method
been
shown
to
be
sensitive
to
different
outcomes/populat
ions?
Yes
Y
es
No
Yes,
to
a
limited
extent
Yes
Yes
No;
universal
v
alues
are
routinely
applied
irrespective
o
f
the
outcome
and
population
Applicability Isthe
method
suited
to
a
ny
trial
design?
Yes
Y
es
Yes
Yes
Yes,
though
it
is
more
likely
to
be
used
for
Phase
3
or
definitive
trials
Yes,
though
it
is
more
likely
to
be
used
for
Phase
3
o
r
definitive
trials
Yes
Can
the
method
be
used
for
a
variety
of
outcome
measures?
Continuous/ordinal outcome
only
Continuous/ordinal outcome
only
Yes
Yes
Yes
Yes
Yes,
though
it
is
widely
u
sed
only
for
a
continuous
outcomes
Is
the
method
acceptable
to
patients,
clinicians,
and
trialists?
Yes
Uncertain
Uncertain
Yes
Yes
Yes
Uncertain,
though
widely
u
sed
Is
it
straightforward
to
use?
Yes
Y
es
No,
except
for
simpler,
more
n
aive
approaches
Yes
Yes,
though
it
requires
a
study
to
be
carried
out
Yes,
though
it
requires
a
review
to
be
carried
out
Yes
Has
the
method
been
used
in
an
RCT
setting?
Yes
Y
es
Published
examples
are
retrospective
Yes
Yes
Yes
Yes
doi:10.1371/journal.pme
additional evidence published after the search used in the meta-analysis was conducted may necessitate updating the sample size.
Standardised Effect Size Method
This method is commonly used to determine the importance of a difference in an outcome when set in comparison to other possible effect sizes upon a standardised scale [88,104–116]. Overwhelmingly, studies used the guidelines suggested by Cohen [106] for the Cohen’s d metric, i.e., 0.2, 0.5, and 0.8 for small, medium, and large effects, respectively, in the context of a continuous outcome. Other SES metrics exist for continuous (e.g., Dunlap’s d), binary (e.g., odds ratio), and survival (hazard ratio) outcomes [106,111,116]. Most of the literature relates to within-group SESs for a continuous outcome. The SD used should reflect the anticipated RCT population as far as possible.
The main benefit of using a SES method is that it can be readily calculated and compared across different outcomes, conditions, studies, settings, and people; all differences are translated into a common metric. It is also easy to calculate the SES from existing evidence if studies have reported sufficient information. The Cohen guidelines for small, medium, and large effects can be converted into equivalent values for other binary metrics (e.g., 1.44, 2.48, and 4.27, respectively, for odds ratio) [105]. As noted above, SES metrics are commonly used for binary (e.g., odds ratio or risk ratio) and survival outcomes (e.g., hazard ratio) in medical research [111], and a similar approach can be readily adopted for such outcomes. However, no equivalent guideline values are in widespread use. Informally, a doubling or halving of a ratio is sometimes seen as a marker of a large relative effect [109].
It is important to note that SES values are not uniquely defined, and different combinations of values on the original scale can produce the same SES value. For the standard Cohen’s d statistic, different combinations of mean and SD values produce the same SES estimate. For example, a mean (SD) of 5 (10) and 2 (4) both give a standardised effect of 0.5SD. As a consequence, specifying the target difference as a SES alone, though sufficient in terms of sample size calculation, can be viewed as insufficient in that it does not actually define the target difference for the outcome measure of interest. A limitation of the SES is the difficulty in determining why different effect sizes are seen in different studies: for example, whether these differences are due to differences in the outcome measure, intervention, settings, or participants in the studies, or study methodology.
Combining Methods
The vast majority of studies that combined methods used two or three of the anchor, distribution, and SES methods. Studies that used multiple methods were not always clear in describing whether and how results were triangulated, and for certain combinations the result of one method seemed to be considered of greater value than the result of another method (i.e., as if a primary and supplementary method had been selected). For example, values that were found using the anchor method were often chosen over effect size results or distribution-based estimates [117]. Alterna-tively, the most conservative value was chosen, regardless of the comparative robustness of the methods used [118]. In cases where the results of the different methods were similar, triangulation of the results was straightforward [119].
Discussion
This comprehensive systematic review summarizes approaches for specifying the target difference in a RCT sample size calculation. Of the seven identified methods, the anchor,
distribution, and SES methods were most widely used. There are several reasons for the popularity of these methods, including ease of use, usefulness in studies validating quality of life instruments, and simplicity of calculation of distribution and SES estimates alongside the anchor method. While most studies adopted (though typically implicitly) the conventional Neyman-Pearson statistical framework, some of the methods (i.e., health economic and opinion-seeking) particularly suit a Bayesian framework.
No further methods were identified by this review beyond the seven methods pre-identified from a scoping search. However, substantial variations in implementation were noted, even for relatively simple approaches such as the anchor method, and many studies used multiple methods. Most studies focused on continuous outcomes, although other outcome types were considered using opinion-seeking and evidence base review. While the methods could in principle be used for any type of RCT, they are most relevant to the design of Phase 3, or ‘‘definitive’’, trials. A number of key issues were common across the methods. First, it is critical to decide whether the focus is to determine an important and/or a realistic difference. Some methods can be used for both (e.g., opinion-seeking), and some for only one or the other (e.g., the anchor method to determine an important difference and the pilot study method to determine a realistic difference). Evaluating how the difference was determined and the context of determining the target difference is important. Some approach-es commonly used for specifying an important difference either cannot be used for specifying a target difference (such as the statistical test approach) or do not straightforwardly translate into the typical RCT context (for example the measurement error approach). The anchor, opinion-seeking, and health economic methods explicitly involve judgment, and the perspective taken in the study is a key consideration regarding their use. As a consequence, these methods explicitly allow different perspectives to be considered, and in particular enable the views of patients and the public to be part of the decision-making process.
Some methodological issues are specific to particular methods. For example, the necessity of choosing a cutoff point to define an ‘‘important’’ difference/change is specific to the anchor method. This approach is a widely recognised part of the validation process for new quality of life instruments, where the scale has no inherent meaning without reference to an outside marker (i.e., anchor).
All three approaches of the distribution method—measurement error, statistical test, and rule of thumb—have clear limitations, the foremost being that they do not match the setting of a standard RCT design (two parallel groups). The statistical test approach cannot be used to specify a target difference, given that it is essentially a rearranged sample size formula. The rule-of-thumb approach is dependent upon the interpretability of the individual scale.
The SES method was used in a substantial number of studies for a continuous outcome, but was rarely reported for non-continuous outcomes, despite informal use of such an approach probably being widespread. No parallel for a binary outcome exists, though odds ratio values approximately equivalent to Cohen’s d values can be used. The validity of Cohen’s cutoffs is uncertain (despite widespread usage), and some modifications to the original values have been proposed [120,121].
used and are potentially useful for this type of research when developing instruments. In terms of planning a trial, the opinion-seeking method can be relatively easy to implement, but the resulting usefulness of the estimated target difference may depend on the robustness of the approach used to elicit opinions.
The health economic and pilot study methods were infrequently reported as specific methods. For the health economic method, this is likely due to the complexity of the method and/or the resource-intensive procedures that are required to conduct the theoretically more robust variants that have been developed. The use of pilot studies to determine the target difference is problematic and probably only useful for the control group event proportion or SD, for a binary or continuous outcome, respectively. Internal pilot studies may be incorporated into the start of larger clinical trials, but are not useful for specifying the target difference, though they could be used to revise the sample size calculation. The review of the evidence base method can be applied to identify both an important or realistic difference; a pilot study addresses only a realistic difference. For both methods, applicability to the anticipated study and the impact of statistical uncertainty on estimates should be considered.
A review of the evidence base approach for a particular outcome measurement or study population may be combined with any of the other methods identified for establishing an important difference. However, the number of studies reporting a formal method for identifying an important difference using the existing evidence was surprisingly small. It could be that there is wide variation in the extent to which reviews of the existing evidence base have been undertaken prospectively using a specific and formal strategy.
Some methods can be readily used with others, potentially increasing the robustness of their findings. The anchor and distribution methods were often used together within the same study, frequently also with the SES approach. Multiple methods for specifying an important difference were used in some studies, though the combinations varied, as did the extent to which results were triangulated. The result of one method may validate the result found using another method, but conflicting estimates increase uncertainty over the estimate of an important difference.
Strengths and Limitations
To our knowledge, this review is the first comprehensive and systematic search of all possible methods for specifying a target difference. The search strategy was inclusive, robust, and logical; however, this led to a large number of studies that did not report a method for specifying an important and/or realistic difference. Also, it is possible some studies were missed because of the lack of standardised terminology. Finally, our search period ended in January 2011, and another method not included in the seven identified by this review may have been published since then,
although we believe this is unlikely. More likely is the use of new variations in the implementation of existing methods.
Conclusions
A variety of methods are available that researchers can use for specifying the target difference in an RCT sample size calculation. Appropriate methods and implementation vary according to the aim (e.g., specifying an important difference versus a realistic difference), context (research question and availability of data), and underlying framework adopted (Bayesian versus conventional statistical approach). No single method provides a perfect solution for all contexts. Some methods for specifying an important difference (e.g., a statistical test–based approach) are inappropriate in the RCT sample size context. Further research is required to determine the best uses of some methods, particularly the health economic, opinion-seeking, pilot study, and SES methods. Prospective comparisons of methods in the context of RCT design may also be useful. Better reporting of the basis upon which the target difference was determined is needed [122].
Supporting Information
Checklist S1 PRISMA checklist.
(DOC)
Protocol S1 Systematic review protocol.
(DOC)
Search Strategy S1 Systematic review search strategy.
(DOCX)
Acknowledgments
The members of the DELTA group, which included the membership of the steering group and other project researchers, were J. A. Cook, J. Hislop, T. E. Adewuyi, K. Harrild, D. G. Altman, C. R. Ramsay, C. Fraser, B. Buckley, P. Fayers, A. H. Briggs, J. D. Norrie, D. Fergusson, I. Ford, I. M. Harvey, and L. D. Vale. Additionally, the authors would like to thank Marion Campbell and Adrian Grant for serving on the project advisory group, which provided guidance on the project’s conduct and interpretation of findings.
Author Contributions
Conceived and designed the experiments: JAC CRR DGA AHB PF IMH BB CF JDN LDV. Performed the experiments: JH JAC LDV TG TEA KH CF. Analyzed the data: JH JAC LDV. Wrote the first draft of the manuscript: JH LDV JAC. Contributed to the writing of the manuscript: JAC DGA CRR AHB PF IMH BB LDV JDN JH TG TEA KH CF. ICMJE criteria for authorship read and met: JAC DGA CRR AHB PF IMH BB JDN JH TG TEA KH CF LDV. Agree with manuscript results and conclusions: JAC DGA CRR AHB PF IMH BB JDN JH TG TEA KH CF LDV.
References
1. Altman DG, Schulz KF, Moher D, Egger M, Davidoff F, et al. (2001) The revised CONSORT statement for reporting randomized trials: explanation and elaboration. Ann Intern Med 134: 663–694.
2. Copay AG, Subach BR, Glassman SD, Polly J, Schuler TC (2007) Understanding the minimum clinically important difference: a review of concepts and methods. Spine J 7: 541–546.
3. Lenth RV (2001) Some practical guidelines for effective sample size determination. Am Stat 55: 187–193.
4. Lenth RV (2001) ‘‘A first course in the design of experiments: a linear models approach’’ by Weber & Skillins: book review. Am Stat 55: 370.
5. Wells G, Beaton D, Shea B, Boers M, Simon L, et al. (2001) Minimal clinically important differences: review of methods. J Rheumatol 28: 406–412. 6. Aletaha D, Funovits J, Ward MM, Smolen JS, Kvien TK (2009) Perception of
improvement in patients with rheumatoid arthritis varies with disease activity levels at baseline. Arthritis Rheum 61: 313–320.
7. Barber BL, Santanello NC, Epstein RS (1996) Impact of the global on patient perceivable change in an asthma specific QOL questionnaire. Qual Life Res 5: 117–122.
8. Bastyr EJ III, Price KL, Bril V, MBBQ Study Group (2005) Development and validity testing of the neuropathy total symptom score-6: questionnaire for the study of sensory symptoms of diabetic peripheral neuropathy. Clin Ther 27: 1278–1294.
9. Beninato M, Gill-Body KM, Salles S, Stark PC, Black-Schaffer RM, et al. (2006) Determination of the minimal clinically important difference in the FIM instrument in patients with stroke. Arch Phys Med Rehabil 87: 32–39. 10. Brant R, Sutherland L, Hilsden R (1999) Examining the minimum important
difference. Stat Med 18: 2593–2603.
activity log, and personal distress scale in postmenopausal women with hypoactive sexual desire disorder. J Sex Med 6: 175–183.
12. Deyo RA, Inui TS (1984) Toward clinical applications of health status measures: sensitivity of scales to clinically important changes. Health Serv Res 19: 275–289.
13. Eberle E, Ottillinger B (1999) Clinically relevant change and clinically relevant difference in knee osteoarthritis. Osteoarthritis Cartilage 7: 502–503. 14. Fritz JM, Hebert J, Koppenhaver S, Parent E (2009) Beyond minimally
important change: defining a successful outcome of physical therapy for patients with low back pain. Spine 34: 2803–2809.
15. Glassman SD, Copay AG, Berven SH, Polly DW, Subach BR, et al. (2008) Defining substantial clinical benefit following lumbar spine arthrodesis. J Bone Joint Surg Am 90: 1839–1847.
16. Jaeschke R, Singer J, Guyatt GH (1989) Measurement of health status. Ascertaining the minimal clinically important difference. Control Clin Trials 10: 407–415.
17. Kawata AK, Revicki DA, Thakkar R, Jiang P, Krause S, et al. (2009) Flushing ASsessment Tool (FAST): psychometric properties of a new measure assessing flushing symptoms and clinical impact of niacin therapy. Clin Drug Investig 29: 215–229.
18. Khanna D, Tseng CH, Furst DE, Clements PJ, Elashoff R, et al. (2009) Minimally important differences in the Mahler’s Transition Dyspnoea Index in a large randomized controlled trial—results from the Scleroderma Lung Study. Rheumatology (Oxford) 48: 1537–1540.
19. Kragt JJ, Nielsen IM, van der Linden FA, Uitdehaag BM, Polman CH (2006) How similar are commonly combined criteria for EDSS progression in multiple sclerosis? Mult Scler 12: 782–786.
20. Kvamme MK, Kristiansen IS, Lie E, Kvien TK (2010) Identification of cutpoints for acceptable health status and important improvement in patient-reported outcomes, in rheumatoid arthritis, psoriatic arthritis, and ankylosing spondylitis. J Rheumatol 37: 26–31.
21. Mannion AF, Porchet F, Kleinstu¨ck FS, Lattig F, Jeszenszky D, et al. (2009) The quality of spine surgery from the patient’s perspective: part 2. Minimal clinically important difference for improvement and deterioration as measured with the Core Outcome Measures Index. Eur Spine J 18 (Suppl 3): 374–379. 22. Metz SM, Wyrwich KW, Babu AN, Kroenke K, Tierney WM, et al. (2006) A comparison of traditional and Rasch cut points for assessing clinically important change in health-related quality of life among patients with asthma. Qual Life Res 15: 1639–1649.
23. Pepin V, Laviolette L, Brouillard C, Sewell L, Singh SJ, et al. (2011) Significance of changes in endurance shuttle walking performance. Thorax 66: 115–120.
24. Piva SR, Gil AB, Moore CG, Fitzgerald GK (2009) Responsiveness of the activities of daily living scale of the knee outcome survey and numeric pain rating scale in patients with patellofemoral pain. J Rehabil Med 41: 129–135. 25. Pope JE, Khanna D, Norrie D, Ouimet JM (2009) The minimally important difference for the health assessment questionnaire in rheumatoid arthritis clinical practice is smaller than in randomized controlled trials. J Rheumatol 36: 254–259.
26. Potter LP, Mathias SD, Raut M, Kianifard F, Tavakkol A (2006) The OnyCOE-t questionnaire: responsiveness and clinical meaningfulness of a patient-reported outcomes questionnaire for toenail onychomycosis. Health Qual Life Outcome 4: 50.
27. Pouchot J, Kherani RB, Brant R, Lacaille D, Lehman AJ, et al. (2008) Determination of the minimal clinically important difference for seven fatigue measures in rheumatoid arthritis. J Clin Epidemiol 61: 705–713.
28. Redelmeier DA, Guyatt GH, Goldstein RS (1996) Assessing the minimal important difference in symptoms: a comparison of two techniques. J Clin Epidemiol 49: 1215–1219.
29. Ringash J, Bezjak A, O’Sullivan B, Redelmeier DA (2004) Interpreting differences in quality of life: the FACT-H&N in laryngeal cancer patients. Qual Life Res 13: 725–733.
30. Ringash J, O’Sullivan B, Bezjak A, Redelmeier DA (2007) Interpreting clinically significant changes in patient-reported outcomes. Cancer 110: 196– 202.
31. Santanello NC, Zhang J, Seidenberg B, Reiss TF, Barber BL (1999) What are minimal important changes for asthma measures in a clinical trial? Eur Respir J 14: 23–27.
32. Sekhon S, Pope J, Canadian Scleroderma Research Group, Baron M (2010) The minimally important difference in clinical practice for patient-centered outcomes including health assessment questionnaire, fatigue, pain, sleep, global visual analog scale, and SF-36 in scleroderma. J Rheumatol 37: 591–598. 33. Spiegel B, Bolus R, Harris LA, Lucak S, Naliboff B, et al. (2009) Measuring
irritable bowel syndrome patient-reported outcomes with an abdominal pain numeric rating scale. Aliment Pharmacol Ther 30: 1159–1170.
34. Suner IJ, Kokame GT, Yu E, Ward J, Dolan C, et al. (2009) Responsiveness of NEI VFQ-25 to changes in visual acuity in neovascular AMD: validation studies from two phase 3 clinical trials. Invest Ophthalmol Vis Sci 50: 3629– 3635.
35. Tafazal SI, Sell PJ (2006) Outcome scores in spinal surgery quantified: excellent, good, fair and poor in terms of patient-completed tools. Eur Spine J 15: 1653–1660.
36. Tashjian RZ, Deloach J, Green A, Porucznik CA, Powell AP (2010) Minimal clinically important differences in ASES and simple shoulder test scores after
nonoperative treatment of rotator cuff disease. J Bone Joint Surg Am 92: 296– 303.
37. ten Klooster PM, Drossaers-Bakker KW, Taal E, van de Laar MA (2006) Patient-perceived satisfactory improvement (PPSI): interpreting meaningful change in pain from the patient’s perspective. Pain 121: 151–157. 38. Abrams P, Kelleher C, Huels J, Quebe-Fehling E, Omar MA, et al. (2008)
Clinical relevance of health-related quality of life outcomes with darifenacin. BJU Int 102: 208–213.
39. Asenlof P, Denison E, Lindberg P (2006) Idiographic outcome analyses of the clinical significance of two interventions for patients with musculoskeletal pain. Behav Res Ther 44: 947–965.
40. Bowersox NW, Saunders SM, Wojcik JV (2009) An evaluation of the utility of statistical versus clinical significance in determining improvement in alcohol and other drug (AOD) treatment in correctional settings. Alcohol Treat Q 27: 113–129.
41. Bridges TS, Farrar JD (1997) The influence of worm age, duration of exposure and endpoint selection on bioassay sensitivity for Neanthes arenaceodentata (Annelida: Polychaeta). Environ Toxicol Chem 16: 1650–1658.
42. Duru G, Fantino B (2008) The clinical relevance of changes in the Montgomery-Asberg Depression Rating Scale using the minimum clinically important difference approach. Curr Med Res Opin 24: 1329–1335. 43. Fitzpatrick R, Norquist JM, Jenkinson C (2004) Distribution-based criteria for
change in health-related quality of life in Parkinson’s disease. J Clin Epidemiol 57: 40–44.
44. Gnat R, Kuszewski M, Koczar R, Dziewonska A (2010) Reliability of the passive knee flexion and extension tests in healthy subjects. J Manipulative Physiol Ther 33: 659–665.
45. Grotle M, Brox JI, llestad NK (2006) Reliability, validity and responsiveness of the fear-avoidance beliefs questionnaire: methodological aspects of the Norwegian version. J Rehabil Med 38: 346–353.
46. Hanson ML, Sanderson H, Solomon KR (2003) Variation, replication, and power analysis of Myriophyllum spp. microcosm toxicity data. Environ Toxicol Chem 22: 1318–1329.
47. Jacobson NS, Truax P (1991) Clinical significance: a statistical approach to defining meaningful change in psychotherapy research. J Consult Clin Psychol 59: 12–19.
48. Kendall PC, Marrs-Garcia A, Nath SR, Sheldrick RC (1999) Normative comparisons for the evaluation of clinical significance. J Consult Clin Psychol 67: 285–299.
49. Krebs EE, Bair MJ, Damush TM, Tu W, Wu J, et al. (2010) Comparative responsiveness of pain outcome measures among primary care patients with musculoskeletal pain. Med Care 48: 1007–1014.
50. Modi AC, Zeller MH (2008) Validation of a parent-proxy, obesity-specific quality-of-life measure: sizing them up. Obesity 16: 2624–2633.
51. Movsas B, Scott C, Watkins-Bruner D (2006) Pretreatment factors significantly influence quality of life in cancer patients: a Radiation Therapy Oncology Group (RTOG) analysis. Int J Radiat Oncol Biol Phys 65: 830–835. 52. Newnham EA, Harwood KE, Page AC (2007) Evaluating the clinical
significance of responses by psychiatric inpatients to the mental health subscales of the SF-36. J Affect Disord 98: 91–97.
53. Pekarik G, Wolff CB (1996) Relationship of satisfaction to symptom change, follow-up adjustment, and clinical significance. Prof Psychol Res Pr 27: 202– 208.
54. Sarna L, Cooley ME, Brown JK, Chernecky C, Elashoff D, et al. (2008) Symptom severity 1 to 4 months after thoracotomy for lung cancer. Am J Crit Care 17: 455–467.
55. Seggar LB, Lambert MJ, Hansen NB (2002) Assessing clinical significance: application to the Beck Depression Inventory. Behav Ther 33: 253–269. 56. van der Hoeven N (2008) Calculation of the minimum significant difference at
the NOEC using a non-parametric test. Ecotoxicol Environ Saf 70: 61–66. 57. Bacchetti P, McCulloch CE, Segal MR (2008) Simple, defensible sample sizes
based on cost efficiency. Biometrics 64: 577–585.
58. Briggs AH, Gray AM (1998) Power and sample size calculations for stochastic cost-effectiveness analysis. Med Decis Making 18: S81–S92.
59. Detsky AS (1990) Using cost-effectiveness analysis to improve the efficiency of allocating funds to clinical trials. Stat Med 9: 173–184.
60. Gittins JC, Pezeshk H (2002) A decision theoretic approach to sample size determination in clinical trials. J Biopharm Stat 12: 535–551.
61. Kikuchi T, Pezeshk H, Gittins J (2008) A Bayesian cost-benefit approach to the determination of sample size in clinical trials. Stat Med 27: 68–82. 62. O’Hagan A, Stevens JW (2001) Bayesian assessment of sample size for clinical
trials of cost-effectiveness. Med Decis Making 21: 219–230.
63. Samsa GP, Matchar DB (2001) Have randomized controlled trials of neuroprotective drugs been underpowered? An illustration of three statistical principles. Stroke 32: 669–674.
64. Torgerson DJ, Ryan M, Ratcliffe J (1995) Economics in sample size determination for clinical trials. QJM 88: 517–521.