International Journal of COPD 2018:13 2157–2162
International Journal of COPD
Dove
press
submit your manuscript | www.dovepress.com 2157
O r I g I n a l r e s e a r C h
open access to scientific and medical research
Open access Full Text article
T wave peak-to-end interval in COPD
seda Tural Onur1
samim emet2
sinem nedime sokucu1
Imran Onur2
1Yedikule Chest Diseases and Thoracic
surgery Training and research hospital, Chest Disease, Zeytinburnu, Istanbul, Turkey; 2Department of
Cardiology, Istanbul Faculty of Medicine, Istanbul University, Fatih, Istanbul, Turkey
Introduction: The interval from the peak to the end of the electrocardiographic (ECG) T wave (Tp–Te) can estimate cardiovascular mortality and ventricular tachyarrhythmias.
Objectives: In this study, we aimed to define a new ECG parameter in patients with COPD. Methods: This was a cross-sectional observational study that included COPD patients who were diagnosed previously and followed up in the outpatient clinic. All data of the patients’ demographic features, history, spirometry, and electrocardiographs were analyzed.
Results: We enrolled 134 patients with COPD and 40 healthy volunteers as controls in our study. Patients already known to be having COPD who were under follow-up for their COPD and diagnosed as having COPD according to the Global Initiative for Chronic Obstructive Lung Disease (GOLD) criteria were included. Men comprised 82.8% of the COPD group and 73.2% of controls. The mean age in the COPD and control group was 60.2±9.4 and 58.2±6.7 years, respectively. There was no significant difference between the groups for age or sex (p=0.207,
p=0.267, respectively). There were 46 (34.3%) patients in group A, 23 (17.2%) patients in group B, 26 (19.4%) patients in group C, and 46 (29.1%) patients in group D as COPD group. There was a significant increase in Tp–Te results in all precordial leads in the COPD group compared with the control group (p,0.05). Precordial V4 lead has the most extensive area under the curve (0.831; sensitivity 76.5%, specificity 89.6%).
Conclusion: We present strong evidence that Tp–Te intervals were increased in patients with COPD, which suggests that there may be an association between COPD and ventricular arrhythmias and cardiac morbidity.
Keywords: COPD, Tp–Te interval, ventricular arrhythmia, cardiac morbidity
Introduction
COPD and cardiovascular disease are distinctly related. Electrocardiographic (ECG) abnormalities such as bundle branch blocks, axis deviations, and arrhythmias are common in patients with COPD.1 Such patients also have a higher cardiovascular
morbidity and mortality rate than the general population.2 In addition, half of the deaths
of patients with COPD are attributable to cardiovascular disease.2 Previous studies
suggested that patients with COPD have a 2- to 3-fold increased risk of sudden cardiac death (SCD).3 However, underlying mechanisms of the association between COPD
and SCD are currently unclear and predictors of malignant cardiac arrhythmias that lead to SCD in COPD have not yet been defined.4 Lahousse et al5 presented the first
data showing COPD as an independent risk factor for SCD.
According to recent studies, the interval between the peak and end of the T wave (Tp–Te) on ECG may stand for the index of total (transmural, apicobasal, and global) dispersion of repolarization.6,7 Furthermore, an increased Tp–Te
inter-val could be a practical index to estimate cardiovascular mortality and ventricular tachyarrhythmias.8,9
Correspondence: seda Tural Onur Yedikule Chest Diseases and Thoracic surgery Training and research hospital, Chest Disease, Zeytinburnu, Istanbul 34760, Turkey
Tel +90 532 680 3407 Fax +90 212 414 2000 email [email protected]
Journal name: International Journal of COPD Article Designation: Original Research Year: 2018
Volume: 13
Running head verso: Tural Onur et al Running head recto: Tp–Te in COPD DOI: 132538
International Journal of Chronic Obstructive Pulmonary Disease downloaded from https://www.dovepress.com/ by 118.70.13.36 on 22-Aug-2020
For personal use only.
Dovepress Tural Onur et al
COPD is associated with some ECG changes including prolonged QT interval, as described previously.10,11 The
Tp–Te interval is a new marker for ventricular arrhythmias and repolarization heterogeneity.12–15
To date, no algorithm has been defined for the arrhythmic risk stratification of patients with COPD. Therefore, our aim was to define a new ECG parameter for ventricular arrhyth-mias and SCD in patients with COPD.
Methods
study population
We enrolled 134 patients who were admitted to our out-patient clinic. Patients already known as having COPD according to the Global Initiative for Chronic Obstructive Lung Disease (GOLD) criteria who were under follow-up for their disease were included.16 Forty healthy age- and
sex-matched subjects were enrolled as a control group. Patients were classified using COPD assessment test scores, breathlessness level using the modified Medical Research Council dyspnea scale, and exacerbations history as recom-mended by GOLD.16
Inclusion criteria included the following: patients were stable, diagnosed previously, and under follow-up for COPD.
The exclusion criteria of the present study were as fol-lows: pregnancy; sepsis; neoplasms; current hemodialysis; acute coronary syndromes; severe electrolyte imbalances; acute cerebrovascular disease; aortic dissections; decom-pensated heart failure; surgery within the past 30 days; prior pulmonary embolism or deep venous thrombosis; acute or chronic infectious diseases; acute or chronic inflamma-tory diseases such as rheumatoid arthritis, systemic lupus erythematosus, or vasculitis; and patients with prior myo-cardial infarction or heart failure with low ejection fraction (,50%).
The demographic, clinical, and laboratory characteristics of the study groups were taken from the patients’ histories and results of physical examinations, which were collected by chest disease physicians at admission.
eCg measurements
A 12-lead ECG was recorded on paper at 25 mm/s and 10 mm/mV gain at rest in the supine position. All ECGs were scanned and analyzed. All QT intervals were measured by 2 different cardiologists. Interobserver correlation for determining Tp–Te interval was assessed using the κ test, and there was a strong correlation between the observers (κ: 0.864, p,0.001). The Tp–Te interval was identified as the interval from the peak of the T wave to the end of
the T wave. Tp–Te intervals were taken from precordial leads.8 An average value of 3 readings was analyzed for
each lead.
ethical approval
The Local Ethics Committee of Istanbul University, Turkey, approved the study protocol. All procedures performed in studies involving human participants were in accordance with the ethical standards of the institutional and/or national research committee and with the 1964 Helsinki declaration and its later amendments or comparable ethical standards. Written informed consent was obtained from all individual participants included in the study.
statistical analysis
Kolmogorov–Smirnov test was used for testing normal distribution. Mann–Whitney U-test and the independent sample t-test were used for quantitative variables. χ2 test was
used for the analysis of qualitative data, and Fischer’s test was used when χ2 test conditions were not formed.
Statisti-cal analyses were made using SPSS 22.0 (IBM Corporation, Armonk, NY, USA).
Results
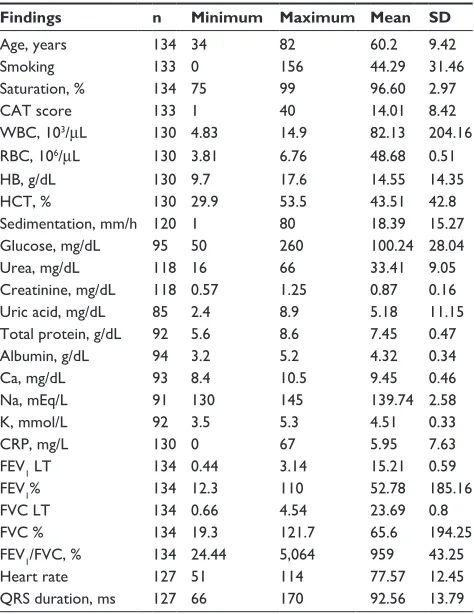
The patients’ and control groups’ baseline demographic parameters, COPD stages, and dyspnea scores are shown in Tables 1 and 2. There was no significant difference between the controls and study group for age or sex (p=0.207,
p=0.267, respectively). The cigarette smoking was estimated to be 44.29±2.7 pack-years. All of our patients had persis-tent airflow limitation, which was shown using spirometry. Patients’ forced expiratory volume in 1 second/forced vital capacity ratio was 52.78%±15.99%. Thirteen (9.7%) of our patients used biomass and coal as their main source of energy for cooking. Forty-five (33.6%) patients were still smoking cigarettes; however, 78 (58.2%) quit smoking. Twenty-one (15.7%) patients had been hospitalized because of COPD exacerbation in the previous year, and 88 (65.7%) visited outpatient clinics. Hypertension was the most frequent comorbidity among the study population.
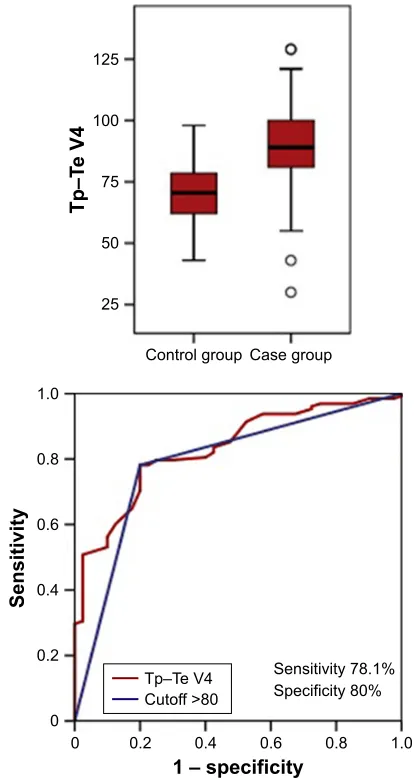
The Tp–Te measured from chest leads V1–6 of COPD and control group are compared in Table 3. There were sig-nificant differences in all leads (Table 3). Receiver operating characteristic curve analyses showed that the most sensitive and specific area under the curve was for lead V4 with a value of 0.83 (Table 4).
For Tp–Te .80, the sensitivity was 78.1% and the speci-ficity was 80%. The receiver operating characteristic curve for Tp–Te V4 is shown in Figure 1.
International Journal of Chronic Obstructive Pulmonary Disease downloaded from https://www.dovepress.com/ by 118.70.13.36 on 22-Aug-2020
Dovepress Tp–Te in COPD
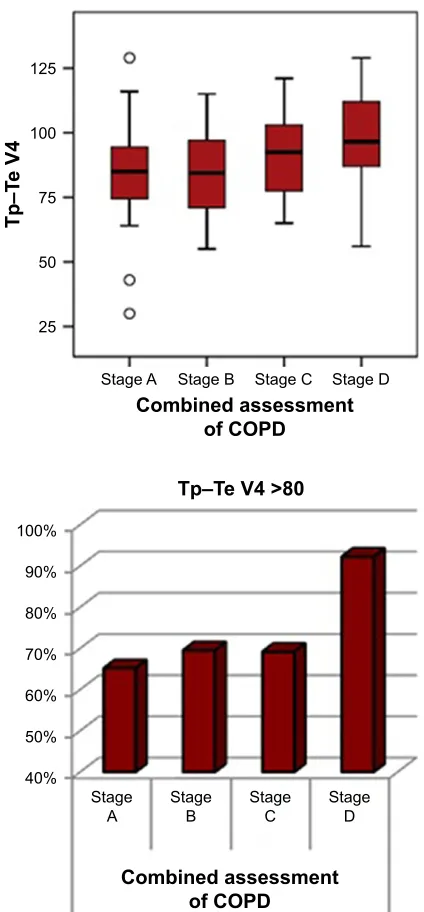
(Table 5). There were no significant differences between patients who were Stage A, B, or C (Table 5; Figure 2). Patients were grouped in the light of revised GOLD 2017, and there was no relation between Tp–Te intervals and FEV values.
Discussion
Cardiovascular morbidity and mortality in the population of patients with COPD is higher than in the overall population. For this reason, we need to develop new methods to predict patients who are at risk of SCD. The relationship between COPD and malignant ventricular arrhythmias causing SCD is still unknown. Surface ECG is an easy and cost-effective method to predict SCD. A new parameter, the Tp–Te, which shows the risk of malignant ventricular arrhythmias and SCD, has not previously been studied in patients with COPD. Our study is the first to prove a prolonged Tp–Te interval in patients with COPD.
Lahousse et al5 presented the first study showing COPD
as an independent risk factor for SCD. They showed a 2-fold increased risk of SCD in patients with COPD. The study demonstrated that patients with COPD died of SCD more frequently at night, logically due to decreased ventilation and increased hypercapnia, which may cause more nocturnal ventricular arrhythmias.5 In addition, Lahousse et al5 found
that SCD was higher in patients with frequent exacerbations of COPD than in patients with stable outcomes of COPD. In our study, significantly increased Tp–Te values observed in group D patients for lead V4 supports this situation. Hawkins et al17 proved that COPD was an independent predictor of
death in patients with acute myocardial infarction. COPD can Table 1 Baseline demographic and respiratory test findings in the control and COPD groups
Findings Control group Case group p-value
Mean ± SD/n (%) Med (Min–Max) Mean ± SD/n (%) Med (Min–Max)
age, years 58.2±6.7 58 (44–65) 60.2±9.4 61 (34–82) 0.207a
sex
Female 10 (24.39) 23 (17.16) 0.267b
Male 30 (73.2) 111 (82.8)
mMrC dyspnea score
stage 0 11 (8.2)
stage I 59 (44.0)
stage II 26 (19.4)
stage III 14 (10.4)
stage IV 24 (17.9)
Combined assessment of COPD
stage a 46 (34.3)
stage B 23 (17.2)
stage C 26 (19.4)
stage D 39 (29.1)
Note:astudent’s t-test, bχ2 test.
Abbreviations: mMRC, modified Medical Research Council; SD, standard deviation.
Table 2 Baseline demographic and biochemical findings in study population
Findings n Minimum Maximum Mean SD
age, years 134 34 82 60.2 9.42
smoking 133 0 156 44.29 31.46
saturation, % 134 75 99 96.60 2.97
CaT score 133 1 40 14.01 8.42
WBC, 103/µl 130 4.83 14.9 82.13 204.16
rBC, 106/µl 130 3.81 6.76 48.68 0.51
hB, g/dl 130 9.7 17.6 14.55 14.35
hCT, % 130 29.9 53.5 43.51 42.8
sedimentation, mm/h 120 1 80 18.39 15.27
glucose, mg/dl 95 50 260 100.24 28.04
Urea, mg/dl 118 16 66 33.41 9.05
Creatinine, mg/dl 118 0.57 1.25 0.87 0.16
Uric acid, mg/dl 85 2.4 8.9 5.18 11.15
Total protein, g/dl 92 5.6 8.6 7.45 0.47
albumin, g/dl 94 3.2 5.2 4.32 0.34
Ca, mg/dl 93 8.4 10.5 9.45 0.46
na, meq/l 91 130 145 139.74 2.58
K, mmol/l 92 3.5 5.3 4.51 0.33
CrP, mg/l 130 0 67 5.95 7.63
FeV1 lT 134 0.44 3.14 15.21 0.59
FeV1% 134 12.3 110 52.78 185.16
FVC lT 134 0.66 4.54 23.69 0.8
FVC % 134 19.3 121.7 65.6 194.25
FeV1/FVC, % 134 24.44 5,064 959 43.25
heart rate 127 51 114 77.57 12.45
Qrs duration, ms 127 66 170 92.56 13.79
Abbreviations: CaT, COPD assessment Test; CrP, C-reactive protein; FeV1, forced expiratory volume in 1 second; FVC, forced vital capacity; hB, hemoglobin; hCT, hematocrit; rBC, red blood cell; WBC, white blood cell.
All patients with COPD were divided into 4 groups according to the recommendation by GOLD. When examin-ing the COPD groups accordexamin-ing to lead V4, there was only a statistically significant increase in patients who were Stage D
International Journal of Chronic Obstructive Pulmonary Disease downloaded from https://www.dovepress.com/ by 118.70.13.36 on 22-Aug-2020
Dovepress Tural Onur et al
increase both cardiovascular and noncardiovascular events such as pulmonary disease, malignancy, and infection.
Several underlying mechanisms cause the increased risk of SCD in patients with COPD. One of these mechanism is β-adrenergic agonists, which are generally used in the treat-ment of COPD and can decrease the ventricular refractory period and increase the risk of ventricular arrhythmias.18,19
In addition, sympathetic overactivity and increased oxida-tive stress, which also exist in the COPD population, have been proven to participate in ventricular arrhythmias and SCD. Increased sympathetic activity has been linked with cardiac electrical instability, and therefore the progression to ventricular arrhythmia.
Previous studies have demonstrated the prolongation of the QTc interval in patients with hypoxemic COPD.20 QTc
interval .450 ms is an independent risk for ventricular arrhythmias.4
Smoking is also another well-known underlying arrhyth-mogenic factor in patients with COPD. It is worth noting that nicotine can activate the release of catecholaminergic chemokines, thus increasing blood pressure and heart rate, and may decrease the threshold for ventricular arrhythmias.21
Oxidative stress and carbon monoxide, as other components
Table 3 Tp–Te values compared between patients with COPD and controls
Tp–Te intervals
Control group Case group p-value
Mean ± SD Med (Min–Max) Mean ± SD Med (Min–Max)
Tp–Te V1 64.9±20.6 61 (40–123) 82.2±19.5 79 (43–154) 0.00a
Tp–Te V2 81.9±16.4 84 (52–119) 90.3±18.4 86 (49–145) 0.017a
Tp–Te V3 79.3±15.6 78 (51–109) 90.6±15.8 90 (32–141) 0.00a
Tp–Te V4 70.3±12.4 71 (43–98) 89.7±16.9 89 (30–129) 0.00a
Tp–Te V5 75.3±11.7 75 (47–102) 86.9±17.7 85 (54–185) 0.00a
Tp–Te V6 68.6±12.3 69 (40–89) 84.6±15.9 85 (42–128) 0.00a
Note:aMann–Whitney U-test.
Abbreviations: sD, standard deviation; Tp–Te, interval between the peak and end of the T wave.
Table 4 aUC values of Tp–Te compared between control and COPD groups
Tp–Te intervals AUC 95% CI p-value
Tp–Te V1 0.765 0.657–0.873 ,0.001
Tp–Te V2 0.631 0.535–0.727 0.013
Tp–Te V3 0.708 0.611–0.805 ,0.001
Tp–Te V4 0.831 0.765–0.896 ,0.001
Tp–Te V5 0.716 0.629–0.803 ,0.001
Tp–Te V6 0.786 0.712–0.860 ,0.001
rOC curve
Abbreviations: AUC, area under the curve; CI, confidence interval; ROC, receiver operating characteristic; Tp–Te, interval between the peak and end of the T wave.
Figure 1 rOC curve for Tp–Te V4.
Abbreviations: rOC, receiver operating characteristic; Tp–Te, interval between the peak and end of the T wave.
7S±7
H9
&RQWUROJURXS &DVHJURXS
±VSHFLILFLW\
6HQVLWLYLW\ 6SHFLILFLW\
6HQVLWLYLW\
7S±7H9 &XWRII!
of cigarette smoke, probably play a vital role in triggering ventricular arrhythmias.21
Previous clinical trials have demonstrated that prophy-lactic use of implantable cardioverter–defibrillator (ICD) can
International Journal of Chronic Obstructive Pulmonary Disease downloaded from https://www.dovepress.com/ by 118.70.13.36 on 22-Aug-2020
Dovepress Tp–Te in COPD
reduce SCD in patients with poor left ventricular ejection function (#35%). This survival benefit has been shown in patients with COPD who have low left ventricular ejection fraction.22 Bilchick et al23 showed that COPD was an
inde-pendent risk factor for mortality (hazard ratio: 1.70; 95% confidence interval: 1.61–1.80) in a study with primary prevention ICD implantation. However, COPD diagnosis alone is not sufficient for ICD implantation. Some additional criteria that can also be used include a cutoff Tp–Te interval, especially in lead V4 or QTc interval, for predicting COPD patients in whom ICD implantation can be performed.
The current study has some limitations. We performed standard surface 12-lead ECG; it is better to use 24-h ECG monitoring to predict Tp–Te interval change in a study group. In addition, the current study had a cross-sectional study design, and it would be better if it were a prospective study design to establish a relationship between prolonged Tp–Te interval in patients with COPD, malignant ventricular arrhythmias, and SCD. Controlled studies involving large patient groups are needed to establish whether a prolonged Tp–Te interval promotes malignant ventricular arrhythmia and SCD in patients with COPD.
Conclusion
COPD has emerged as an important risk factor for ven-tricular arrhythmias and SCD. To date, no algorithm has been defined for arrhythmic risk stratification of patients with COPD to protect patients from SCD. So, our aim was to define a new ECG parameter which is connected with ventricular arrhythmias and SCD in patients with COPD. Tp–Te interval is a new and useful parameter which can be assessed using surface ECG easily. We demonstrated strong evidence that Tp–Te intervals were increased in patients with COPD, which suggests that there may be an association among COPD, ventricular arrhythmias, and SCD. Nonethe-less, further prospective studies should be done.
Disclosure
The authors report no conflicts of interest in this work.
References
1. Rodman DM, Lowenstein SR, Rodman T. The electrocardiogram in chronic obstructive pulmonary disease. J Emerg Med. 1990;8(5): 607–615.
2. Huiart L, Ernst P, Suissa S. Cardiovascular morbidity and mortality in COPD. Chest. 2005;128(4):2640–2646.
3. Sin DD, Man SF. Chronic obstructive pulmonary disease as a risk factor for cardiovascular morbidity and mortality. Proc Am Thorac Soc. 2005; 2(1):8–11.
Table 5 Tp–Te V4 values compared between in COPD stages
COPD stages
Tp–Te V4 Tp–Te V4 .80 p-value Mean ± SD Median N %
Combined assessment of COPD 0.005a
stage a 85.0±17.6 85.0 30 65.2
stage B 86.0±16.7 84.5 16 69.6
stage C 91.8±16.6 92.5 18 69.2
stage D 96.6±14.0 96.5 36 92.3
Note:aKruskal–Wallis (Mann–Whitney U-test).
Abbreviations: sD, standard deviation; Tp–Te, interval between the peak and end of the T wave.
Figure 2 Tp–Te V4 measurements in COPD patients according to stages.
Abbreviation: Tp–Te, interval between the peak and end of the T wave.
7S±7H9!
6WDJH
$ 6WDJH% 6WDJH& 6WDJH'
&RPELQHGDVVHVVPHQW RI&23'
6WDJH$
6WDJH% 6WDJH& 6WDJH'
7S±7
H9
&RPELQHGDVVHVVPHQW RI&23'
International Journal of Chronic Obstructive Pulmonary Disease downloaded from https://www.dovepress.com/ by 118.70.13.36 on 22-Aug-2020
International Journal of COPD
Publish your work in this journal
Submit your manuscript here: http://www.dovepress.com/international-journal-of-chronic-obstructive-pulmonary-disease-journal
The International Journal of COPD is an international, peer-reviewed journal of therapeutics and pharmacology focusing on concise rapid reporting of clinical studies and reviews in COPD. Special focus is given to the pathophysiological processes underlying the disease, intervention programs, patient focused education, and self management protocols.
This journal is indexed on PubMed Central, MedLine and CAS. The manuscript management system is completely online and includes a very quick and fair peer-review system, which is all easy to use. Visit http://www.dovepress.com/testimonials.php to read real quotes from published authors.
Dovepress
Dove
press
Tural Onur et al
4. Sievi NA, Clarenbach CF, Camen G, Rossi VA, van Gestel AJ, Kohler M. High prevalence of altered cardiac repolarization in patients with COPD. BMC Pulm Med. 2014;14:55.
5. Lahousse L, Niemeijer MN, van den Berg ME, et al. Chronic obstruc-tive pulmonary disease and sudden cardiac death: the Rotterdam study. Eur Heart J. 2015;36(27):1754–1761.
6. Kors JA, Ritsema van Eck HJ, van Herpen G. The meaning of the Tp-Te interval and its diagnostic value. J Electrocardiol. 2008;41(6): 575–580.
7. Antzelevitch C, Sicouri S, Di Diego JM, et al. Does Tpeak−Tend provide an index of transmural dispersion of repolarization? Heart Rhythm. 2007;4(8):1114–1116.
8. Castro Hevia J, Antzelevitch C, Torne´s Ba´rzaga F, et al. Tpeak-Tend and Tpeak-Tend dispersion as risk factors for ventricular tachycardia/ ventricular fibrillation in patients with the Brugada syndrome. J Am Coll Cardiol. 2006;47(9):1828–1834.
9. Smetana P, Schmidt A, Zabel M, et al. Assessment of repolarization heterogeneity for prediction of mortality in cardiovascular disease: peak to the end of the T wave interval and nondipolar repolarization components. J Electrocardiol. 2011;44(3):301–308.
10. Lui CY. Acute pulmonary embolism as the cause of global T wave inversion and QT prolongation: a case report. J Electrocardiol. 1993; 26(1):91–95.
11. Punukollu G, Gowda RM, Khan IA, Wilbur SL, Vasavada BC, Sacchi TJ. QT interval prolongation with global T-wave inversion: a novel ECG finding in acute pulmonary embolism. Ann Noninvasive Electrocardiol. 2004;9(1):94–98.
12. Taggart P, Sutton PM, Opthof T, et al. Transmural repolarization in the left ventricle in humans during normoxia and ischaemia. Cardiovasc Res. 2001;50(3):454–462.
13. Opthof T, Coronel R, Janse MJ. Is there a significant transmural gradient in repolarization time in the intact heart? Repolarization gradients in the intact heart. Circ Arrhythm Electrophysiol. 2009;2(1):89–96. 14. Antzelevitch C, Sicouri S, Litovsky SH, et al. Heterogeneity within the
ventricular wall. Electrophysiology and pharmacology of epicardial, endocardial, and M cells. Circ Res. 1991;69(6):1427–1449.
15. Topilski I, Rogowski O, Rosso R, et al. The morphology of the QT interval predicts torsade de pointes during acquired bradyarrhythmias. J Am Coll Cardiol. 2007;49(3):320–328.
16. Vogelmeier CF, Criner GJ, Martinez FJ, et al. Global strategy for the diagnosis, management, and prevention of chronic obstructive pulmo-nary disease 2017 report. GOLD Executive Summary. Am J Respir Crit Care Med. 2017;195(5):557–582.
17. Hawkins NM, Huang Z, Pieper KS, et al; Valsartan in Acute Myocardial Infarction Trial Investigators. Chronic obstructive pulmonary disease is an independent predictor of death but not atherosclerotic events in patients with myocardial infarction: analysis of the Valsartan in Acute Myocardial Infarction Trial (VALIANT). Eur J Heart Fail. 2009; 11(3):292–298.
18. Qin M, Liu T, Hu H, Wang T, Yu S, Huang C. Effect of isoprenaline chronic stimulation on APD restitution and ventricular arrhythmogen-esis. J Cardiol. 2013;61(2):162–168.
19. Salpeter SR, Ormiston TM, Salpeter EE. Cardiovascular effects of
β-agonists in patients with asthma and COPD: a meta-analysis. Chest. 2004;125(6):2309–2321.
20. Stewart AG, Waterhouse JC, Howard P. The QTc interval, autonomic neuropathy and mortality in hypoxaemic COPD. Respir Med. 1995; 89(2):79–84.
21. Prasad DS, Kabir Z, Dash AK, Das BC. Smoking and cardiovascular health: a review of the epidemiology, pathogenesis, prevention and control of tobacco. Indian J Med Sci. 2009;63(11):520–533. 22. Razak E, Kamireddy S, Saba S. Implantable cardioverter-defibrillators
confer survival benefit in patients with chronic obstructive pulmonary disease. Pacing Clin Electrophysiol. 2010;33(9):1125–1130. 23. Bilchick KC, Stukenborg GJ, Kamath S, Cheng A. Prediction of
mor-tality in clinical practice for medicare patients undergoing defibrillator implantation for primary prevention of sudden cardiac death. J Am Coll Cardiol. 2012;60(17):1647–1655.
International Journal of Chronic Obstructive Pulmonary Disease downloaded from https://www.dovepress.com/ by 118.70.13.36 on 22-Aug-2020