Passivation Behavior of Ce-Containing Hyper Duplex Stainless Steels
in Sulfuric Acid Solution
Soon-Hyeok Jeon
1,2,+, Geun-Dong Song
2, Do Haeng Hur
2and Yong-Soo Park
11Department of Material Science and Engineering, Yonsei University,
134 Shinchon-dong, Seodaemun-gu, Seoul 120-749, Republic of Korea
2Nuclear Materials Safety Research Division, Korea Atomic Energy Research Institute,
989-111 Daedeok-daero, Yuseong-gu, Daejeon 305-353, Republic of Korea
The passivation behavior of Ce containing hyper duplex stainless steels in sulfuric acid solution was investigated by electrochemical testing and X-ray photoelectron spectroscopy surface analysis. The addition of Ce to the alloy increased the corrosion resistance at a passive region of 0.4 VSCE. The Ce addition also improved the stability of the passivefilm because of the formation of inclusions containing Ce with low Cr content and an enrichment of the Cr oxide and hydroxide in the passivefilm. Further, Ce addition to the alloy decreased the interface between the inclusion and the metallic matrix functioning as defects in the passivefilm. The Cr-enriched zones formed around the Ce containing inclusion improved the corrosion resistance of the metallic matrix around the inclusions, which act as corrosion propagation sites.
[doi:10.2320/matertrans.M2015145]
(Received April 8, 2015; Accepted May 20, 2015; Published July 3, 2015)
Keywords: duplex stainless steel, cerium, passivefilm, inclusion
1. Introduction
Duplex stainless steels (DSSs) have gained much popular-ity over recent years because of their high resistance to stress corrosion cracking, pitting, and crevice corrosion, high tensile strength, low temperature toughness, and relatively low cost because of the low Ni content in comparison to austenite stainless steels (ASSs).14)To meet the increasing demand for materials with long service lifetimes, which are primarily used in highly corrosive environments, highly alloyed hyper duplex stainless steels (HDSSs) have been developed.
The passivation behavior and associated corrosion resist-ance of stainless steel have been widely investigated.59)The addition of Ru has been reported to facilitate the formation of a passivefilm on DSSs by decreasing their corrosion parameters, shifting the corrosion and pitting potential to positive value.5) Cu addition is known to suppress the active dissolution of ferritic stainless steel (FSS) because of the formation of a uniform coverage of a metallic Cu enriched layer on the steel surface. However, the metallic surface layer of Cu dissolves as cupric ions in the passive region, which deteriorates the stability of the passivefilm.6)Pardoet al.7)have reported the
effect of Mo addition on ASSs in the presence of Mo6+within
the passivefilm in neutral NaCl solution, which increases their stability against breakdown caused by the attack of aggressive Cl¹ions. Kimet al.8)have demonstrated that N addition to Ar
shielding gas increases the austenite phase content and the stability of passivefilms, which can be attributed to an increase in the concentration of N-related chemical species, such as NH4+ and CrN, which result in the generation of phase enriched with metallic Cr and Cr oxides and hydroxides in the DSSs. Recently, Cu addition has been shown to degrade the passive film stability in DSSs because of increase in the formation of Cr oxide inclusions, which function as defect sites in the passive film, resulting in deterioration of the corrosion resistance in sulfuric acid solution.9)
The effects of Ce addition to stainless steels on the corrosion resistance in various corrosive environments have been widely reported.1014)The corrosion resistance of super duplex stainless steel (SDSS) was increased by addition of Ce, La, and Ba, which increased the passive range and decreased the passive current density because of the promoted formation of Cr-enriched passive films in a 0.5 M HCl-1.0 M NaCl solution.10)The presence of Ce increased the pitting corrosion
resistance in DSSs because of the formation of stable Ce oxide inclusions and the pit initiation sites decreased in NaCl solution.11)The addition of a small amount of Ce to ASS has
been reported to improve the oxidation resistance and inhibit the oxide growth.12)The addition of Ce to stainless steels has been shown to decrease their sensitization owing to a decrease in the Cr diffusion rate along the grain boundaries and an increase in Ce concentration at the grain boundaries.13) Recently, it has been found that the addition of Ce to DSSs slows the decrease of the intergranular corrosion resistance of the alloy because the deleterious secondary phase precip-itation at 1123 K was retarded.14)
The effects of Ce addition on the pitting corrosion, intergranular corrosion, and oxidation resistance of stainless steels have been widely investigated. However, the effects of Ce addition on the passivation behavior and corrosion resistance of HDSSs in sulfuric acid solution are not yet to be reported. In particular, there are no mechanisms reported on the correlation between the inclusions and the passivation behavior of Ce containing HDSSs.
The aim of the present paper is to elucidate the effects of Ce addition on the passivation behavior of HDSSs in sulfuric acid solution using potentiodynamic polarization testing, potentio-static testing, electron probe micro-analysis (EPMA), scanning electron microscopy-energy dispersive spectroscopy (SEM-EDS), and X-ray photoelectron spectroscopy (XPS) analysis.
2. Experimental Procedures
Ingots weighing 50 kg were manufactured using a high
+Corresponding author, E-mail: junsoon@yonsei.ac.kr
frequency vacuum induction furnace. After these ingots were hot rolled in the range of 1333 to 1523 K, plates of 6 mm thickness were produced. The 6 mm thick plate metal was solution-annealed at 1333 K for 30 min and water quenched. The chemical compositions of the alloys are presented in Table 1.
Potentiodynamic polarization tests were carried out to evaluate the overall corrosion behavior of the specimens in 2 M H2SO4solution at 338 K according to the ASTM G 5.15)
The cell contained a working electrode, a glass capillary probe connected to a saturated calomel reference electrode (SCE) and two graphite rod counter electrodes. The test was conducted at a potential range of¹0.65 V to+1.1 V vs. SCE and at a scanning rate of 1©10¹3V s¹1. The potentiostatic test was measured in a deaerated 2 M H2SO4 solution at
338 K with an respectively applied potential of 0.4 VSCE in
the passive region of the potentiodynamic anodic polarization curves at which a meta-stable pitting can occur.16,17) The current transients were recorded for 36000 s. Corrosion morphologies of the alloys after potentiostatic tests were observed using a SEM.
To observe the various inclusions of the alloys, the inclusions were analyzed using a SEM-EDS. Line analysis of the Cr and Ce of the inclusion in the alloys was measured using an EPMA. The chemical species in the outermost surfacefilm formed on the alloy were analyzed using an XPS after the potentiostatic test at the respectively applied with 0.4 VSCE in the passive region in deaerated 2 M H2SO4
solution at 338 K for 10 h. The energy source was an Al-K¡ (1486.6 eV) X-ray, and the acquired spectra were calibrated with a binding energy of C 1 s (284.5 eV).
3. Results and Discussion
[image:2.595.310.545.251.566.2]3.1 Effects of Ce addition on the distribution and formation behavior of inclusions
Figure 1 shows the SEM images in back-scattered electron (BSE) mode of the solution heat-treated alloys. The austenite
phase can be observed as an island phase in the background of the ferrite phase, which looks relatively dark. The black colored globular particles enclosed by dotted circles appeared to be inclusions in the BASE alloy. However, black- and white-colored globular particles were observed in the CE190 alloy. The black- and white-colored globular particles enclosed by dotted circles appeared to be inclusions in the CE190 alloy.
Figure 2 presents the SEM-BSE images of the inclusions in the alloys. The chemical compositions of the inclusions were analyzed by SEM-EDS. As shown in Fig. 2(a), the inclusions formed in the BASE alloy were composed of the main type of (Cr, Mn, Fe, Al) oxides and (Cr, Mn, Al) oxides. These oxide inclusions were black. However, Fig. 2(b)
Table 1 Chemical composition of the experimental alloys (mass%). Alloy C Cr Ni Mo W Si Mn Cu Ce N Fe BASE 0.017 26.91 6.59 2.50 3.30 0.33 0.94 1.45 ® 0.38 Bal. CE190 0.020 27.00 6.60 2.50 3.40 0.29 0.93 1.50 0.019 0.32 Bal.
γγ α
50μm 50μm
γ α
(a) (b)
Fig. 1 SEM-BSE images of the microstructure in the alloys: (a) BASE and (b) CE190.
3μm 3μm
Type 1 Type 2 Type of
inclusion
Chemical compositions (mass %)
Cr Mn Fe Al O
1 40.20 27.54 4.81 5.81 21.64 2 34.47 19.56 - 3.55 42.42
(a)
4μm 2μm
Type 1 Type 2
Type of inclusion
Chemical compositions (mass %)
Cr Mn Fe Al Si Ce O
1 12.39 - 4.51 - - 69.54 13.56
2- (spectrum 1) 18.67 14.44 4.33 2.74 5.97 33.98 19.88 2- (spectrum 2) 34.24 27.57 - 11.25 - - 26.93
(b)
[image:2.595.46.292.263.309.2]shows that the inclusions formed in the CE190 alloy were composed of the main type of (Ce, Cr, Fe) oxides and the mixed type of (Cr, Mn, Al) oxide and (Ce, Cr, Mn, Fe, Al, Si) oxide. The main type of (Ce, Cr, Fe) oxide inclusions was entirely white in the SEM-BSE image. The mixed type of (Cr, Mn, Al) oxide and (Ce, Cr, Mn, Fel, Al, Si) oxide were both black and white, which could be attributed to differences in the chemical composition of the various inclusions. Ce has a much higher affinity for oxygen than other transitions metals used for alloying in stainless steels. Based on the standard free energies of formation, Ce oxide has a higher negative free energy of formation than Mn, Cr, Si, Fe, and Ti oxides.18) Hence, Ce oxide inclusions can be formed more
readily than Mn and Cr oxides.19)
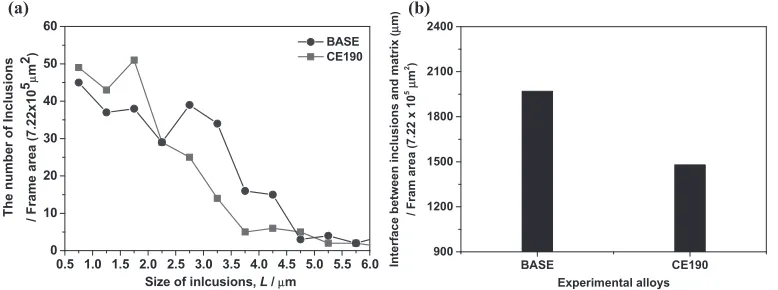
Figure 3 shows the distribution of inclusions and the interface between the inclusions and metallic matrix per frame area of the alloys. As shown in Fig. 3(a), Ce addition increased the number of fine inclusions and decreased the number of coarse inclusions. In addition, the addition of Ce decreased total number of inclusions per frame area. To calculate the interface between the inclusions and the metallic matrix for a given frame area, the inclusions were assumed to be two-dimensional circles and their circumference (2³r) was used to obtain distribution maps to classify the inclusions of each measured area by size. As shown in Fig. 3(b), the interfacial area between the inclusions and the metallic matrix
of the CE190 alloy was decreased by about 0.78 times in comparison to the BASE alloy. Hence, the addition of Ce affected the number of inclusions and the interface between the inclusions and the metallic matrix.
Figure 4 shows the EPMA line analysis of the inclusion formed in the ferrite phase of the CE190 alloy. The white (Ce, Cr, Fe) oxide inclusion was observed in the CE190 alloy (Fig. 4(a)). The line analysis of the Ce containing oxide inclusion in the CE190 alloy showed that narrow Cr-enriched zones were formed around the Ce containing inclusion with a low Cr content (Fig. 4(b)). This indicates that the Cr content around the inclusion was strongly affected by the Cr content in the inclusions.
3.2 Effects of Ce addition on the electrochemical behavior
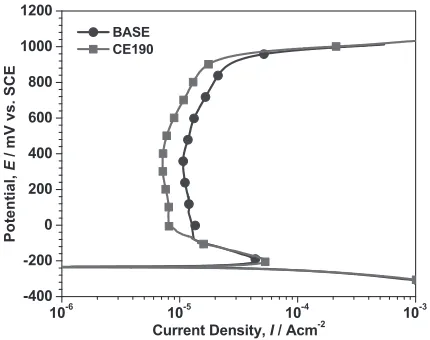
Figure 5 shows the potentiodynamic polarization tests of the alloys in deaerated 2 M H2SO4solution at 338 K, tested
according to ASTM G 5 standards. Table 2 shows the corrosion current density (Icorr), the critical current density
(Ic) and the passivation current density (Ip) obtained from the
potentiodynamic polarization curves. The Ip of the CE190
alloy is smaller than that of the BASE alloy in the passive region. On the basis of the increase in theIp, the addition of
Ce to the base alloy has a positive effect on the passivation behavior. In the active region, on the basis of theIcandIcorr,
900 1200 1500 1800 2100 2400
Interface
between i
n
clusions
and matr
ix
(
μ
m
)
/ Fram
area
(
7.22
x 1
0
5μ
m
2)
Experimental alloys
BASE CE190
0.5 1.0 1.5 2.0 2.5 3.0 3.5 4.0 4.5 5.0 5.5 6.0 0
10 20 30 40 50 60
The number of Inclusions / Frame area
(7.22x10
5μm 2)
Size of inlcusions, L / μm BASE CE190
(a) (b)
Fig. 3 The distribution and interface between the inclusions and matrix per frame area of the alloys: (a) the distribution of inclusions and (b) the interface between the inclusions and matrix.
0 500 1000 1500 2000 2500 3000 3500 4000
Cr Ce
Length of inclusion, L / μm
Co
un
ts
of C
r
(a
rt. un
it)
0 200 400 600 800 1000 1200 1400 1600
C
ount
s
of C
e (art. un
it
)
Cr-enriched zone Cr
Ce
3μm
Inclusion (Ce, Cr, Fe ) O
0 3 6 9 12 15 18
(a) (b)
[image:3.595.106.495.72.217.2] [image:3.595.96.498.265.429.2]the addition of Ce to the base alloy has a no effect on the anodic dissolution in the deaerated 2 M H2SO4 solution at
338 K.
Figure 6 presents the potentiostatic behavior of the alloys at an applied potential of 0.4 VSCEin the passive region of the
potentiodynamic polarization curves shown in Fig. 5. TheIp
of the CE190 alloy is lower than that of the BASE alloy, indicating that the addition of Ce to the base alloy increases the stability of the passive film. Furthermore, a higher number of current transients, indicating meta-stable pitting and repassivation at the interface between the inclusions and metallic matrix, were observed during the test period from 10007000 s in the potentiostatic curve of the BASE alloy in comparison to that observed in the CE190 alloy. Hence, Ce addition to the base alloy increased the corrosion resistance at the passive region of 0.4 VSCE because of the formation of
stable Ce containing inclusions and the decrease of interface between the inclusions and the matrix.
Figure 7 shows the SEM image of the corroded surface of the alloys in deaerated 2 M H2SO4solutions at 338 K after the
potentiostatic tests at an applied potential of 0.4 VSCE. All
types of inclusions, such as (Cr, Mn, Al) oxide and (Cr, Mn, Fe, Al) oxide in the BASE alloy functioned as corrosion initiation and propagation sites (Fig. 7(a)). Hence, the resistance to corrosion for the Cr oxide inclusion was lower than that of the metallic matrix in the BASE alloy. Inclusions on the surface of stainless steel can lead to the formation of weak spots in the passivefilm because of the direct exposure of the boundary between the inclusion and matrix to the aggressive environment.20)However, although the corrosion
initiation occurred at the interface between the inclusion and
the matrix in the CE190 alloy, the inclusions containing Ce, such as (Ce, Cr, Fe) and (Ce, Cr, Mn, Fe, Al, Si) oxide in the CE190 alloy, did not act as corrosion propagation sites (Fig. 7(b)). The corrosion propagated from the interface between the inclusion and the matrix to the metallic matrix in the CE190 alloy. This indicated that the corrosion resistance of the inclusion containing Ce was higher than that of the metallic matrix in the CE190 alloy.
3.3 Effects of Ce addition on the passivation behavior
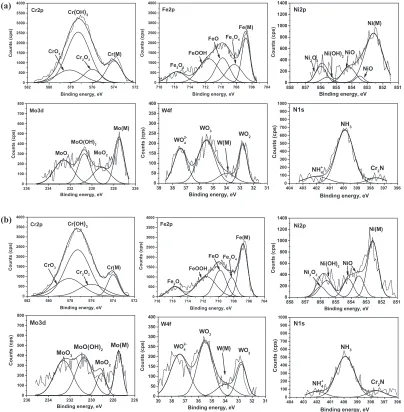
The XPS profile of the alloys after the potentiostatic test at an applied potential of 0.4 VSCE in deaerated 2 M H2SO4
solutions at 338 K are shown in Fig. 8, respectively. The metallic and oxidized states of Cr 2p, Fe 2p, Ni 2p, Mo 3d, and W 4f are presented.
The binding energies (Eb) obtained from the deconvoluted
XPS profiles of the primary compounds in the passivefilms formed on the alloys are listed in Table 3. The signals corresponding to the Cr 2p spectra are the strongest in the alloys. The peak deconvolution reveals that the presence of four constituent peaks representing metallic state (Cr (M)), chromium(III) oxide (Cr2O3), chromium trioxide (CrO3) and
chromium hydroxide (Cr(OH)3). The oxidized species, such
as Cr(OH)3Cr2O3and CrO3(main component: Cr(OH)3), are
the primary constituents of the passive films in the alloys. The Fe 2p spectra can be separated intofive constituent peaks representing the metallic state (Fe (M)), iron(II, III) oxide (Fe3O4), iron(III) oxide (Fe2O3), iron(II) oxide (FeO) and,
iron(III) hydroxide (FeOOH). The results revealed that iron(III) is the primary iron oxidized species in the passive
film. The Ni 2p peak can be separated into five constituent peaks, representing the metallic state (Ni (M)), nickel oxide (NiO), nickel trioxide (Ni2O3), and nickel hydroxide
(Ni(OH)2). Low intensity Mo 3d and W 4f peaks were
obtained after the potentiostatic tests. The deconvolution of these peaks is difficult because of the similar energy levels of Mo 3d and W 4f. Mo was present in the metallic state (Mo (M)) and as molybdenum dioxide (MoO2),
molybde-num trioxide (MoO3), and molybdenum oxy-hydroxide
(MoO[OH]2). W was present in the metallic state (W (M))
and as tungsten dioxide (WO2), tungsten trioxide (WO3), and
0 6000 12000 18000 24000 30000 36000
0 1 2 3 4 5 6 7 8 9 10 11 12
BASE CE190
Current
densit
y,
I
/
μ
A
cm
-2
Time, t / s
0 1000 2000 3000 4000 5000 6000
0 1 2 3 4 5 6 7 8
BASE CE190
C
urr
en
t de
ns
it
y,
I
/
μ
A
cm
-2
Time, t / s
Fig. 6 The potentiostatic polarization tests at an applied potential of 0.4 VSCEof the alloys in deaerated 2 M H2SO4solution at 338 K.
10-6 10-5 10-4 10-3
-400 -200 0 200 400 600 800 1000 1200
Po
te
nt
ial,
E
/ mV vs. SCE
Current Density, I / Acm-2
BASE CE190
[image:4.595.62.277.70.240.2]Fig. 5 Potentiodynamic anodic polarization tests of the alloys in deaerated 2 M H2SO4solutions at 338 K.
Table 2 Electrochemical parameters for the experimental alloys in deaerated 2 M H2SO4solutions at 338 K obtained from the potentiody-namic anodic polarization curves.
Alloy Ecorr (mVSCE)
Icorr (µA/cm2)
Ic (µA/cm2)
Ipat 0.4 VSCE (µA/cm2)
BASE ¹231 94.3 47.2 11.0
[image:4.595.313.540.70.238.2] [image:4.595.47.290.325.379.2]tungstate (WO42¹). The N 1s peak could be split into three
components, ammonium (NH4+), ammonia (NH 3), and
chromium nitride (Cr2N). NH3 was the primary constituent
of the passivefilm in the alloys. Table 4 shows the elemental ratios of Cr to Fe calculated from the XPS analysis of Fig. 8 using peak area and atomic sensitivity factors (ASFs).
35 μm 3 μm Corrosion propagation to the Cr oxide inclusion
5 μm Corrosion propagation
to the matrix
α
α γ
γ
35 μm
(a) (b)
Fig. 7 SEM image of the surface morphologies in the alloys after the potentiostatic tests in deaerated 2 M H2SO4solution at 338 K at an applied potential of 0.4 VSCE: (a) BASE and (b) CE190.
0 500 1000 1500 2000 2500 3000 3500 4000
Fe3O4
C
o
u
n
ts (cps)
Binding energy, eV
FeOOH
Fe(M)
FeO Fe2p
Fe2O3
0 200 400 600 800 1000 1200 1400 NiO
Ni(OH)2NiO
Binding energy, eV Ni(M) Ni2p
Ni2O3
Co
un
ts (cps)
718 716 714 712 710 708 706 704 858 857 856 855 854 853 852 851
582 580 578 576 574 572
0 500 1000 1500 2000 2500 3000 3500 4000 Co u n ts (cp s)
Binding energy, eV
Cr(OH)3
Cr(M)
CrO3
Cr2O3
Cr2p 0 50 100 150 200 250 300 350 400 W(M) WO3 WO2
Binding energy, eV
Co unt s ( cps ) W4f WO 2-4 0 100 200 300 400 500 600 700 800 900 1000
Binding energy, eV
C
ounts
(cps
)
NH+
4 Cr2N
NH3 N1s
39 38 37 36 35 34 33 32 31 404 403 402 401 400 399 398 397 396
236 234 232 230 228 226
0 100 200 300 400 500 600 700 800
Binding energy, eV
Co unts (c ps) MoO3 MoO(OH)2 MoO2 Mo(M) Mo3d 0 500 1000 1500 2000 2500 3000 3500 4000 Counts (cps)
Binding energy, eV
Cr(OH)3
Cr(M)
CrO3
Cr2O3
Cr2p 0 500 1000 1500 2000 2500 3000 3500 4000 C o unts (cps)
Binding energy, eV
Fe3O4
FeOOH
Fe(M)
FeO Fe2p
Fe2O3
582 580 578 576 574 572 718 716 714 712 710 708 706 704 0858 857 856 855 854 853 852 851
200 400 600 800 1000 1200 1400
Ni(OH)2NiO
Binding energy, eV
Ni(M) Ni2p
Ni2O3
Coun ts (cps ) 0 50 100 150 200 250 300 350 400 W(M) WO3 WO2
Binding energy, eV
Counts (c ps ) W4f WO 2-4 0 100 200 300 400 500 600 700 800 900 1000
Binding energy, eV
C o u n ts (cps ) NH+
4 Cr2N
NH3 N1s
39 38 37 36 35 34 33 32 31 404 403 402 401 400 399 398 397 396
236 234 232 230 228 226
0 100 200 300 400 500 600 700 800
Binding energy, eV
Cou
n
ts (cps) MoO
3 MoO(OH)2 MoO2 Mo(M) Mo3d (a) (b)
[image:5.595.104.495.72.232.2] [image:5.595.97.501.281.693.2]The passivity of ASSs and DSSs arise from the high corrosion resistance exhibited by the Cr(III) oxide-hydrox-ides present in the passivated layers.38)The role of alloyed Cr in enhancing the passivity of the stainless steel is frequently explained in terms of a percolation model of passivation.3941) It is considered that Cr forms insoluble Cr2O3, and a
continuous Cr-O-Cr-O network is then produced, which prevents the dissolution of Fe.
The one method used to identify properly passivated steel is the total Cr/Fe atomic ratio. Cano et al.42) presented the
elemental ratios of Cr to Fe is very important from the corrosion resistance viewpoint, because a higher Cr/Fe ratio value is related with greater corrosion resistance. Nohet al.43)
showed the pitting potential is closely related to the Cr/Fe ratio and the rate of metastable pitting decreases with an increasing Cr/Fe ratio in the passivefilm of stainless steels. Abreu et al.44) pointed out the stabilizing effect of the
molybdates on the surface of the film, improving the formation of a layer on DSS with a higher Cr/Fe ratio. The Ce addition to the base alloy increased the elemental ratio of Cr to Fe in the passivated alloys by 1.19 times. Hence, the addition of Ce to the base alloy improved the stability of the passivefilm. It is necessary to elucidate the mechanism of the effects of Ce addition on the passivation behavior of the alloys. Based on the results of the XPS surface analysis after the potentiostatic test, we can explain the increase in the corrosion resistance observed with the addition of Ce as follows. The Cr metal, oxides, and hydroxide i.e., Cr (M),
Cr2O3, CrO3, and Cr(OH)3 enhance the corrosion resistance
of the passive region (Fig. 8). The increase in Cr (M), oxide, and hydroxide with Ce addition is associated with the inclusions containing Ce in the CE190 alloy.
This can be explained on the basis of three factors. First, Ce addition to the alloy decreased the interfaces between the inclusion and the matrix, which act as corrosion initiation sites because of the direct exposure of the interface to the aggressive corrosion environment. Second, the addition of Ce to the alloy led to the formation of stable inclusions containing Ce, which improved the corrosion resistance. The resistance to corrosion of the inclusions, such as (Cr, Mn, Al) oxides and (Cr, Mn, Fe, Al) oxides in the HDSS-0Ce alloy was lower than that of the metallic matrix. Corrosion was initiated in the microcrevices between the matrix and the inclusions and propagated to the Cr oxide inclusions in the BASE alloy. However, stable inclusions containing Ce in the CE190 alloy did not seem to act as corrosion propagation sites. Third, Ce addition to the alloy resulted in the formation of Cr-enriched zones and suppressed the Cr-depleted zones increasing the corrosion resistance because of an increase in the corrosion resistance of the area around the inclusions, which act as corrosion propagation sites. Cr-depleted zones were formed at the edge of the manganese sulfide inclusions in stainless steels and these zones were first selectively dissolved.45)
4. Conclusions
(1) Ce addition to the base alloy improved the stability of the passive film because of the formation of stable Ce containing inclusions with low Cr content and an increase in the Cr oxide and hydroxide content in the passivefilm of the alloys.
(2) Ce addition to the alloy decreased the interface between the inclusion and the matrix, which function as defects in the passivefilm.
(3) In addition, Ce addition to the alloy led to the formation of Cr-enriched zones, which improved the corrosion resistance of the metallic matrix around the inclusions, which act as corrosion propagation sites.
Acknowledgements
This work was supported by the National Research Foundation of Korea (NRF) grant funded by the Korea government (MSIP) (2012M2A8A4025888). This work was also partially supported by the Nuclear Power Core Technology Development Program of the Korea Institute of Energy Technology Evaluation and Planning (KETEP) granted financial resource from the Ministry of Trade, Industry & Energy, Republic of Korea (2013T100100029).
REFERENCES
1) N. Ebrahimi, M. Momeni, M. H. Moayed and A. Davoodi:Corros. Sci. 53(2011) 637.
2) V. Vignal, D. Ba, H. Zhang, F. Herbst and S. Le Manchet:Corros. Sci. 68(2013) 275.
[image:6.595.47.290.92.252.2]3) M. Hoseinpoor, M. Momeni, M. H. Moayed and A. Davoodi:Corros. Sci.80(2014) 197.
Table 3 The binding energies of some chemical species for the XPS analysis.
Species
Binding energies (eV)
Species
Binding energies (eV)
Species
Binding energies (eV) Fe(M)2p3/2 706.82123) Ni(M)2p3/2 852.528) Mo(M)3d5/2 227.529) Fe3O4 2p3/2 708.324) NiO2p3/2 853.529) MoO2 3d3/2 229.129) FeO2p3/2 709.825) NiO2p3/2 854.228) MoO(OH)2 3d5/2 230.734) FeOOH2p3/2 711.625) Ni(OH)2 2p3/2 855.630) MoO3 3d5/2 232.628)
Fe2O3 2p3/2 715.726) Ni2O3 2p3/2 856.029)
W(M)4f7/2 34.025) Cr(M)2p3/2 574.023,27) Cr2N 1s 397.631) WO2 4f7/2 32.83537) Cr2O3 2p3/2 576.027) NH31s 399.932) WO3 4f7/2 35.528,29) Cr(OH)3 2p3/2 577.327) NH4+1s 402.033) WO42¹4f7/2 37.329)
CrO3 2p3/2 578.127)
Table 4 Elemental ratios of Cr to Fe calculated from the XPS survey spectrum for the alloys after the potentiostatic test at an applied potential of 0.4 VSCEin deaerated 2 M H2SO4solutions at 338 K using peak area and ASFs.
Alloy Peak area Elemental
atomic% Atomic ratio of Cr/Fe
Cr Fe
Total area
Area
/ASF (Cr;1.5)
Total area
Area
/ASF (Fe; 2)
[image:6.595.45.293.326.417.2]4) H. Y. Ha, M. H. Jang, T. H. Lee and J. Moon:Corros. Sci.89(2014) 154.
5) El-Sayed M. Sherif, J. H. Potgieter, J. D. Comins, L. Cornish, P. A. Olubambi and C. N. Machio:Corros. Sci.51(2009) 1364.
6) M. Seo, G. Hultquist, C. Leygraf and N. Sato:Corros. Sci.26(1986) 949.
7) A. Pardo, M. C. Merino, A. E. Coy, F. Viejo, R. Arrabal and E. Matykina:Corros. Sci.50(2008) 1796.
8) H. J. Kim, S. H. Jeon, S. T. Kim and Y. S. Park:Corros. Sci.91(2015) 140.
9) S. H. Jeon, H. J. Kim, K. H. Kong and Y. S. Park:Mater. Trans.56 (2015) 78.
10) Y. H. Yoo, Y. S. Choi, J. G. Kim and Y. S. Park:Corros. Sci.52(2010) 1123.
11) S. H. Jeon, S. T. Kim, M. S. Choi, J. S. Kim, K. T. Kim and Y. S. Park:
Corros. Sci.75(2013) 367.
12) M. Shao, L. Cui, Y. Zheng and L. Xing:J. Rare Earths30(2012) 164.
13) Y. Watanabe, V. Kain, T. Tonozuka, T. Shoji, T. Kondo and F. Masuyama:Scr. Mater.42(2000) 307.
14) S. H. Jeon, D. H. Hur, H. J. Kim and Y. S. Park:Corros. Sci.90(2015) 313.
15) Annual Book of ASTM Standards, ASTM G5.
16) P. C. Pistorius and G. T. Burstein:Corros. Sci.33(1992) 1885.
17) G. T. Burstein, P. C. Pistorius and S. P. Mattin:Corros. Sci.35(1993) 57.
18) J. E. Elliott and M. Gleiser:Thermochemistry for Steelmaking, vol. 1, (Addision-Wesley, USA, 1960) pp. 171190.
19) P. E. Waudby: Int. Metals Rev.2(1978) 74.
20) A. Szummer, M. Janik-Czachor and S. Hofmann:Mater. Chem. Phys. 34(1993) 181.
21) P. Marcus and J. M. Grimal:Corros. Sci.33(1992) 805.
22) W. P. Yang, D. Costa and P. Marcus:J. Electrochem. Soc.141(1994) 2669.
23) Y. Okazaki, T. Tateishi and Y. Ito:Mater. Trans.38(1997) 78.
24) D. Brion:Appl. Surf. Sci.5(1980) 133.
25) T. L. Barr:J. Phys. Chem.82(1978) 1801.
26) R. K. Tandon, R. Payling, B. E. Chenhall, P. T. Crisp, J. Ellis and R. S. Baker:Appl. Surf. Sci.20(1985) 527.
27) B. Stypula and J. Stoch:Corros. Sci.36(1994) 2159.
28) D. Briggs and M. P. Seah:Practical Surface Analysis, vol. 1, second edition, (John Willey & Sons, 1993).
29) C. D. Wagner, J. F. Moulder, L. E. Davis and W. M. Riggs:Handbook of X-ray Photoelectron Spectroscopy, (Perking-Elmer Corporation, Physical Electronics Division (end of book)).
30) A. M. Beccaria, G. Castello and G. Poggi:Brit. Corros. J.30(1995) 283.
31) M. Romand and M. Roubin: Analusis4(1976) 309.
32) H. Y. Ha, H. J. Jang, H. S. Kwon and S. J. Kim:Corros. Sci.51(2009) 48.
33) A. Sadough Vanini, J. P. Audouard and P. Marcus: Corros. Sci.36 (1994) 1825.
34) J. F. Moulder, M. F. Stickle, P. E. Sobol and K. D. Bomben:Handbook of X-ray Photoelectron Spectroscopy, (1992, Perkin-Elmer Corpora-tion).
35) R. J. Colton, A. M. Guzman and J. W. Rabalais:J. Appl. Phys.49 (1978) 409.
36) R. J. Colton and J. W. Rabalais:Inorg. Chem.15(1976) 236.
37) K. T. Ng and D. M. Hercules:J. Phys. Chem.80(1976) 2094.
38) R. M. Souto, I. C. Mirza Rosca and S. González:Corrosion57(2001) 300.
39) K. Sieradzki and R. C. Newman:J. Electrochem. Soc.133(1986) 1979.
40) S. Qian, R. C. Newman, R. A. Cottis and K. Sierazki:J. Electrochem. Soc.137(1990) 435.
41) S. Fujimoto, R. C. Newman, G. S. Smith, S. P. Kaye, H. Kheyrandish and J. S. Colligon:Corros. Sci.35(1993) 51.
42) E. Cano, L. Martínez, J. Simancas, F. J. Pérez-Trujillo, C. Gómez and J. M. Bastidas:Surf. Coat. Technol.200(2006) 5123.
43) J. S. Noh, N. J. Laycock, W. Gao and D. B. Wells:Corros. Sci.42 (2000) 2069.
44) C. M. Abreu, M. J. Cristóbal, R. Losada, X. R. Nóvoa, G. Pena and M. C. Pérez:Electrochim. Acta49(2004) 3049.