Abstract— Robust design is an important methodology that provides a product or process insensitivity to the effects of variability and improves the performance at low cost including in static and dynamic system. Most of the robust design research in the literature focused on problems with static and linear dynamic system. In this paper we propose a method for solving nonlinear double dynamic robust parameter design using genetic algorithm (GA) and Taguchi method to get an optimal or near optimal setting of controllable factors. Computer Aided Engineering (CAE) was used to obtain the data. Then, the identified nonlinear function was simplified by combining two signal factors into a double-dynamic function and transforming nonlinear to linear function. Next, a statistical approach, linear regression analysis, is employed to model the unknown functions. And then GA, heuristic continuous search approach, is used to find the appropriate setting of controllable factors on the basis of the quality loss function. The effect of noise factors which is the important philosophy of robust design is also considered. The example, design of high-precision positioning device using the combined piezo-voice-coil motor (VCM) actuator, and comparisons with previous works are provided to demonstrate the implementation and usefulness of the proposed method.
Index Terms— Quality Management, Robust Parameter Design, Genetic Algorithm, Nonlinear Double-Dynamic system
I. INTRODUCTION
Taguchi method was known in many industries as an off-line quality control methodology to improve the performance of products or processes at low cost, not only for the quality being expected to achieve the customer’s specification, but the quality’s variation [1], [2]. However, day-by-day technology is advancing rapidly and competition is getting global, products are becoming more complicated. The robust design often referred in a dynamic system with highly non linear problems and a number of factors. Some statisticians pointed to inefficiencies in Taguchi method for
Manuscript received October 24, 2009
Pisvimol Chatsirirungruang is with the Industrial Engineering and Management, Tokyo Institute of Technology, Tokyo, Japan 152-8552, (phone: 81-3-5734-2247; fax: 81-3-5734-2947; e-mail: [email protected])
those cases, so recently mathematical model and computer simulation are the other alternatives.
In order to cope with the increasing complicated design problems, several methods for robust design besides the Taguchi method have been proposed as the alternatives. Reference [3] used physical programming. References [4] -[6] proposed using principle component analysis. However, some researchers argued that there are other approaches more suitable. Such as; [7] proposed using desirability function rather than principle component analysis and multivariate loss, [8] proposed using a goal attainment approach comparing with generalized distance, desirability function, and fuzzy approach. In parallel, the new approaches are gradually developed such as VIKOR [9], weighted principal component [10], process capability ratio, new quality loss [11], genetic algorithm [12], TOPSIS [13], etc. However, they did not consider the effect of noises which is the important part of the philosophy of the robust design.
Genetic Algorithm (GA) is a heuristic search approach that uses the historical information from previously examined solutions in selecting new search points where improved performances. It was shown in many publications that GA is an efficient proposed method in dealing with robust design for both single response problem [14], [15] and multi-response problem [12], [16]-[18]. Nevertheless, those past studies have focused on the static system. The robust design in dynamic system using GA [19] still has received only limited attention. In addition, some past studies have not considered the effects of noises and the identification of the adjustment factors, the major philosophies of the robust design. Furthermore, there are some limitations in robust design using GA. The main one is that it can be applied with only the known function, or numerical experiment. A numerical equation is needed to search the bestresult, while comparing with Taguchi’s orthogonal array method (OA) it could be done by the real experiment.
The computer simulation, Computer Aided Engineering (CAE), can be used as an alternative to assist product design especially in case of the limited amount of real data (field data) from the actual physical system or complicated design problems. Reference [14] supported that a viable alternative to costly prototype testing is the study of a mathematical model (analytic model or defined numerical computation) which describes the best setting of controllable factors and which permits variability minimization. The computer experiment allows the virtually cost free including a large number of noise and controllable factors, which is a
Application of Computer Aided Engineering
with Genetic Algorithm and Taguchi method in
Nonlinear Double-Dynamic Robust Parameter
Design
particularly attractive feature when considering the cost incurred due to the unjustified neglect of troublesome variables. And in some cases it is too expensive, dangerous to conduct the real experiment or difficult to control noises. Furthermore, there are problems to interrupt the manufacturing process to test or take more time to do all real experiments in order to get the sufficient data.
Both Taguchi method and computer simulation have their own advantages and disadvantages. Therefore, it motivates the idea of combining both advantages to promote more efficient approach. In this paper, we propose a method for solving nonlinear double dynamic robust parameter design using genetic algorithm (GA) and Taguchi method to get an optimal or near optimal setting of controllable factors. Computer Aided Engineering (CAE)was used to collect the data and after simplifying function, linear regression analysis was used to acquire the unknown relationship between signal and response. Then GA was employed to find the best setting of the controllable factors while considering noises. Finally, with the basis of the quality loss function the optimal setting of the controllable factors can be determined to simultaneously reduce the quality variation and optimize the response close to the target in dynamic system in one step. The high-precision positioning device using the combined piezo-voice-coil motor (VCM) actuator indicates that the proposed approach yields a satisfactory result.
II. BASIC THEORIES A. Framework of parameter design [20], [21]
Robust design is an engineering methodology that provides a product or process insensitivity to the effects of variability. This methodology is applied during the research and development stage to ensure that products can be produced with high quality at low cost.
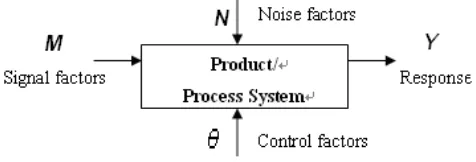
[image:2.595.48.286.605.686.2]Fig. 1 shows the parameter diagram of a dynamic product or process system. First we identify the signal (input) factors and the response (output) factors. Next we consider the parameters that are beyond the control of the designer. Those factors are called noise factors. It should be realized that the most important strategy is taking noise factors into account during the design stage. At last, parameters that can be specified by the designer, controllable factors are set to provide the best performance and the least sensitivity to noises.
Fig. 1: Parameter diagram of a dynamic product or process system
The ideal relationship between signal and response should be a linear for all operating conditions. We suppose the target function is
( ) E Y =βM
,
where
β
is the target slope representing the system’s sensitivity, M is regarded as the signal factor and Y is considered to be the response factor. However, the noise factors cause the relationship to deviate from the ideal. The job of the designer is to select appropriate controllable factors so that the deviation from the ideal is minimized at low cost. Such a design is called dynamic robust design which provides minimum sensitivity.In case there are many signal factors, we should combine them to a multi-dynamic ideal function. Moreover, in case relationship between signal and response is not linear, as the concept of simplification we should transform it into linear function for the purpose of calculating the SN ratio and modeling function.
Dynamic SN ratios:
Suppose yij represent the jth observed response at the ith signal level (Mi). Now consider the least squares fit to the model
( ij) i E Y =βM
ˆ
β
represents the least squares estimate ofβ
, and s2 represents the estimated mean square error, MSE, by∑ ∑
−
−
=
−i j
y
ijM
in
s
2 1 2)
ˆ
(
)
1
(
β
.
The signal-to-noise ratio for dynamic system by Taguchi has been defined as
2 2
ˆ
log(
/
)
SN
=
β
s
.
Minimizing MSE is an effective method to maximize SN ratio, because it reduces the variance induced by external noises. However, increasing the value of
β
ˆ can lead to the undesirable result enhancing the system sensitivity. A largerˆ
β
can give a wider range of the response Y, which may be outside the specification limits of the target [22].Average loss function:
Loss functions play a fundamental role in every quality engineering method to posses some interesting properties and lead to theoretical results that cannot be handled with other loss functions
.
( )
I( , )
R
θ
=
E L y t
,
where
θ
is a setting of controllable factors, E is the expectation, I is a number of signal levels, L is a loss function, y is a response quality characteristic, and t is the target value which is different depending on the signal factor (M).2
1
( , ) ( )
J
j j
L y t y t
=
=
∑
− ,B. Genetic algorithm method
Genetic algorithm (GA) is a term used for a search technique that incorporates the concepts of natural selection in its iterative steps. GA uses historical information from previously examined solutions to select new search points which improved performances are expected. GA differs from conventional optimization algorithm in that it examines a population of points at each iteration rather than one point and uses the objective function rather than the derivative or gradient directly in the search.
The unique features of GA are that GA does not need many mathematical requirements for optimization problems. It can handle any kind of objective functions and constraints, linear or nonlinear, defined on discrete, continuous, or mixed search spaces. Moreover, it is effective at performing global search, while some traditional approaches perform local search. GA also provides great flexibility to hybridize with domain dependent heuristics to make an efficient implementation for a specific problem. Therefore, a problem that is highly nonlinear and heavily constrained can benefit from GA.
General structure of GA starts with an initial set of random solutions called population. Each individual in the population is called chromosome, representing a solution to the problem. The chromosomes evolve through successive iterations, called generations. During each generation, the chromosomes are evaluated, using some measures of fitness (objective value). To create the next generation, new chromosome, called offspring, is formed by either merging two chromosomes from current generation using crossover or modifying a chromosome using mutation. A new generation is formed by selecting some of the parents and offspring, according to the fitness values, and also rejecting others to keep the population size constant. After several generations, the algorithm converges to the best chromosome [23].
III. PROPOSED APPROACH
Step1. Set the controllable factors’ boundaries, noise factors’ level and signal factors
GA with continuous random search for the best setting of controllable factors is used replacing of the inner orthogonal array which considers limited in two or three levels of controllable factors. Therefore, it is necessary to set the boundaries of controllable factors A, B,… for GA search. -Boundaries of A: Al , Au
B: Bl,,Bu …
where l is the lower boundary and u is the upper boundary of factor.
Then, because noise factor is an important principle of Taguchi method, we still use the array to take noises into account. Therefore, it is necessary to set the levels of noise
factors A’, B’, …
-Levels of noises A: A’1 , A’2, A’3 B: B’1 , B’2, B’3 …
where 1, 2, 3 are the levels of noise factors. Lastly, the signal factor is assigned.
Step2. Construct the regression model of the signal factor and response
1) Get the data from the real experiments (field data) and Computer Aided Engineering (CAE) tools
2) Combine two signal factors into a double-dynamic function
3) Simplify the identified nonlinear function to linear function and transform the data into a linear function 4) Employ the linear regression analysis to construct the
regression model
Step3: Select the suitable performance measure and set the objective
Taguchi method with traditional OA use SN ratio as the performance measure, but [24] argued that maximizing SN ratio does not always minimize the expected loss. Therefore, robust parameter design by GA will use average loss function which directly answers to the goal of robust design as the performance measure.
Hence, the objective of robust parameter design in this proposed method is to minimize average loss caused by deviations of the output from the target, R(θ).
Step4: Set the parameters of GA
Step5: Perform automatic continuous search process by GA to find the optimum setting of controllable factors
While Taguchi method has to maximize SN ratio first and then adjust the mean to the target, parameter design by this proposed method can obtain the best setting of controllable factors within one step by minimizing average loss function
.
IV. ILLUSTRATE EXAMPLE
Precision positioning device using combined piezo- voice-coil motor (VCM) actuator [25]
Table 1: The transformed linear results from CAE experiment [25]
Fig. 2: Robust design diagram for precision positioning device [25]
These two signal factors are referred to as the functional input signal (FSF) and the process control signal (PSF): • Functional Signal Factor (FSF): An input factor that has a nonlinear relationship with the response, fundamentally causing the energy transformation and consequently driving the functional output of the design or process. The FSF is identified as M in 10, 20, 30, 40 V
• Process Signal Factor (PSF): An adjusting factor that has the property of modifying the nonlinear relationship of the FSF with the response. The PSF is identified as M∗ in1.0, 1.5, 2.0 V.
Yung-Tien proposed the ideal nonlinear function in this case as:
dr = axb= a(MM∗ )b , (1)
where a and b are coefficients of the nonlinear fitted curves. As the concept of simplification, the nonlinear function must be transformed into a linear function. The ideal relationship between the two input signal factors and the response is a straight line defined as:
y = (dr)1/b= a1/bMM∗ = βMM∗ , (2)
where βis the slope of the best fitting straight line to the plot of y versus the product of the two input signal factors (MM∗ ).
The transformed linear results from CAE experiment are arranged in Table 1. [25]
Application of the proposed method:
Step1. Set the controllable factors’ boundaries, noise factor’ levels and signal factors
The controllable factors’ boundaries were set as following:
- Waveform type of PZT actuator, A=
{
1, 2, 3}
where 1 is pulse, 2 is quarter-sine , and 3 is sawtooth- Waveform width of PZT actuator, B: 1≤ ≤B 10 in unit of ms
- Preload of the target object, C: 10≤ ≤C 30 in unit of N
For noise factor, it was set in three levels: N1, N2, N3 For signal factors, M = 10, 20, 30, 40 V, M* =1.0, 1.5, 2.0 V
Step2. Construct the linear regression model of the signal factor and response
[image:4.595.46.287.359.468.2]Table 2: Regression analysis of Beta for modeling the unknown function
R egression S tatistics
M ultiple R 99%
R S quare 99%
A djusted R Square 99% Standard Error 0.0028
O bservations 27
A N O V A
df SS M S F S ignific ance F
R egression 7 0.0139 0.0020 247.43 0.00%
R esidual 19 0.0002 8E-06
Total 26 0.0141
C oefficients Standard Error t S tat P -value
Intercept -0.0930 6E-03 -15.93 0.00%
B 0.0085 5E-04 17.36 0.00%
C 0.0193 6E-04 33.56 0.00%
A ^2 0.0098 5E-04 18.66 0.00%
C ^2 -0.0003 1E-05 -28.42 0.00%
B C -0.0004 3E-05 -16.57 0.00%
A C -0.0023 1E-04 -20.32 0.00%
N 0.0054 7E-04 8.07 0.00%
After checking the model’s adequacy, the regression model with respect to the significant factors is obtained as follows:
dr 1/b= (
-0.0930+0.0085B+0.0193C+0.0098A2-0.0003C2 -0.0004BC-0.0023AC+0.0054N)MM*, R2 = 99%
Step3. Select the suitable performance measure and set the objective
The objective is to minimize average loss caused by deviations of the output from the target, R(θ). The targets of dr1/b
by each signal factors were shown in table 3. Step4: Set the parameters of GA
The best setting of GA parameters has been studied from many previous researches such as [12], [26]. And in order to validate it, GA parameter test is conducted to compare the results of the different settings of GA parameters that recommended by the previous studies. From the obtained result, we decided to use the following parameter setting
:
-Population Size: 50 chromosomes -Mutation rate: 0.1
-Crossover rate: 0.5
-Stopping constraint: Result changes less than0.01% in 5000 trials
Step5: Perform automatic continuous search process by GA beneath the assigned different noise conditions to find the optimum setting of controllable factors
Result and analysis
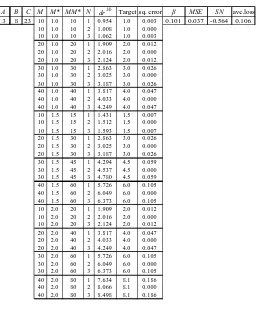
After GA searching beneath noise for the best setting of controllable factors with minimum average loss, the result is shown in Table 3. The best setting is A=3, B=8, C=23 with average loss 0.106 (Number of trial generations = 26,353 trial generations by using a personal computer pentium4).
Table 3: The result of average loss by the proposed method
A B C M M* MM* N dr1/b
Target sq. error β MSE SN ave.loss 3 8 23 10 1.0 10 1 0.954 1.0 0.003 0.101 0.037 -0.564 0.106
10 1.0 10 2 1.008 1.0 0.000 10 1.0 10 3 1.062 1.0 0.003 20 1.0 20 1 1.909 2.0 0.012 20 1.0 20 2 2.016 2.0 0.000 20 1.0 20 3 2.124 2.0 0.012 30 1.0 30 1 2.863 3.0 0.026 30 1.0 30 2 3.025 3.0 0.000 30 1.0 30 3 3.187 3.0 0.026 40 1.0 40 1 3.817 4.0 0.047 40 1.0 40 2 4.033 4.0 0.000 40 1.0 40 3 4.249 4.0 0.047 10 1.5 15 1 1.431 1.5 0.007 10 1.5 15 2 1.512 1.5 0.000 10 1.5 15 3 1.593 1.5 0.007 20 1.5 30 1 2.863 3.0 0.026 20 1.5 30 2 3.025 3.0 0.000 20 1.5 30 3 3.187 3.0 0.026 30 1.5 45 1 4.294 4.5 0.059 30 1.5 45 2 4.537 4.5 0.000 30 1.5 45 3 4.780 4.5 0.059 40 1.5 60 1 5.726 6.0 0.105 40 1.5 60 2 6.049 6.0 0.000 40 1.5 60 3 6.373 6.0 0.105 10 2.0 20 1 1.909 2.0 0.012 10 2.0 20 2 2.016 2.0 0.000 10 2.0 20 3 2.124 2.0 0.012 20 2.0 40 1 3.817 4.0 0.047 20 2.0 40 2 4.033 4.0 0.000 20 2.0 40 3 4.249 4.0 0.047 30 2.0 60 1 5.726 6.0 0.105 30 2.0 60 2 6.049 6.0 0.000 30 2.0 60 3 6.373 6.0 0.105 40 2.0 80 1 7.634 8.1 0.186 40 2.0 80 2 8.066 8.1 0.000 40 2.0 80 3 8.498 8.1 0.186
V. CONCLUSIONS
In this study, the approach incorporating Computer Aided Engineering (CAE), Taguchi method, and GA perspective in a robust parameter design with unknown nonlinear double dynamic system is proposed, not specific only the known problems with numerical equation. It can find the appropriate setting of controllable factors within one step by minimizing average loss function, while Taguchi method has to maximize SN ratio first and then adjust the mean to the target. In addition, enhancing search process automatically in continuous numerals by GA causes its result better among the methods providing limited in two or three levels of controllable factors, because it offers the greater potential to identify the good parameter design [27].
R
EFERENCES[1] Phadke M.S. (1989). Quality engineering using robust design. NJ, USA: Prentice Hall.
[2] Taguchi G., Subir Ch., Yuin Wu. (2005).Taguchi’s Quality Engineering Handbook. NJ, USA: John Wiley&Sons, Inc. [3] Messac A., A. Ismail-Yahaya. (2002) ‘Multiobjective robust
design using physical programming’, Structural and multidisciplinary optimization, Vol.23, pp.357-371.
[4] Chao-Ton Su, Lee-Ing Tong. (1997) ‘Multi-response robust design by principal component analysis’, Total quality management, Vol.8, pp.409-416.
[5] Jiju Antony. (2000). ‘Multi-response optimization in industrial experiments using Taguchi`s quality loss function and principal component analysis’, Quality and reliability engineering international, Vol.16, pp.3–8.
optimization in friction properties of PBT composites using Taguchi method and principle component analysis’, Journal of Materials Processing Technology, Vol.170, pp.602–610. [7] Auer C., Erdbrugge M., Gobel R. (2004). “Comparison of
multivariate methods for robust parameter design in sheet metal spinning“, Applied stochastic models in business and industry, 20, 201-218
[8] Kai Xu, Dennis K.J.Lin, Loon-Ching Tang, Min Xue. (2004). ‘Multiresponse systems optimization using a goal attainment approach’, IIE transactions, Vol.36, pp.433-445.
[9] Lee-Ing Tong, Chi-Chan Chen, Chung-Ho Wang. (2007). ‘Optimization of multi-response processes using the VIKOR method’, International Journal Advance Manufacturing Technology, Vol.31, pp. 1049–1057.
[10] Hung-Chang Liao. (2006). ‘Multi-response optimization using weighted principal component’, International Journal Advance Manufacturing Technology, Vol.27, pp.720–725. Chatsirirungruang, P. and Miyakawa, M. (2008). “Application of Genetic Algorithm to Numerical Experiment in Robust Parameter Design for Signal Response System”, J. Jpn. Soc. Qual. Control, Vol.38-2, 82-91
[11] Young-Hyun Ko, Kwang-Jae Kim, and Chi-Hyuck Jun. (2005). ‘A new loss function-based method for multi-response optimization’, Journal of Quality Technology, Vol.37, pp.50-59.
[12] Ortiz JR., Simpson J., Pignatiello J., Heredia-Langner A. (2004). ‘A Genetic algorithm approach to multiple-response optimization’, Journal of Quality Technology , Vol.36, pp.432-450.
[13] Hung-Chang Liao. (2003). ‘Using PCR-TOPSIS to optimise Taguchi’s multi-response problem’, International Journal Advance Manufacturing Technology, Vol.22, pp.649-655. [14] Parkinson D.B. (2000) ‘Robust design employing a genetic
algorithm’, Quality and Reliability Engineering International, Vol.16, pp.201-208.
[15] Chatsirirungruang, P. and Miyakawa, M. (2008). “Application of Genetic Algorithm to Numerical Experiment in Static Robust Parameter Design”, :Journal of Japan Industrial Management Association, 59, 4, 312-319
[16] T.S. Li, C.T. Su, T.L. Chiang. (2003). ‘Applying robust multi-response quality engineering for parameter selection using a novel neural–genetic algorithm’, Computers in Industry, Vol.50, pp.113–122.
[17] Mian L., Shapour A., Vikrant A. (2005). ‘A multi-objective genetic algorithm for robust design optimization’, Proceeding GECCO`05, ACM Washington, DC, USA.
[18] Forouraghi B. (2000). ‘A Genetic Algorithm for Multiobjective Robust Design’, Applied Intelligence , Vol.12, pp.151–161.
[19] Chatsirirungruang, P. and Miyakawa, M. (2008). “Application of Genetic Algorithm to Numerical Experiment in Robust Parameter Design for Signal Response System”, J. Jpn. Soc. Qual. Control, Vol.38-2, 82-91
[20] Taguchi G. (1992). Taguchi Methods Research and development. USA: ASI Press.
[21] Taguchi G., Chowdhury S., Taguchi S. (2000). Robust Engineering. NY: McGraw-Hill.
[22] Miller A., Wu C. F. J. (1996). Parameter design for signal response systems: a different look at Taguchi's dynamic parameter design. Statistical Science, 11, 122-136
[23] Gen M., Cheng R. (1997). Genetic algorithm & Engineering Design. New York, USA: Wiley interscience.
[24] Ramon V., Anne C., Raghu N. (1987) ‘Performance measures independent of adjustment: An explanation and extension of Taguchi`s signal to noise ratios’, Technometrics, Vol.29, pp.253-265.
[25] Yung-Tien Liu, Rong-Fong Fung, and Chun-Chao Wang. (2007). “Application of the Nonlinear, Double-Dynamic Taguchi Method to the Precision Positioning Device Using Combined Piezo-VCM Actuator”, ieee transactions on
ultrasonics, ferroelectrics, and frequency control, Vol. 54, no. 2 [26] Randy L. (2000) Optimum Population Size and Mutation Rate for a Simple Real Genetic Algorithm that Optimizes Array Factors. IEEE. 1034-1037
![Fig. 2: Robust design diagram for precision positioning device [25]](https://thumb-us.123doks.com/thumbv2/123dok_us/1307877.660766/4.595.88.509.68.324/fig-robust-design-diagram-for-precision-positioning-device.webp)