Effect of Screen Contrast Ratio and
Luminance Level on Visual Lobe Shape
Cathy H. Y. Chiu and Alan H. S. Chan
Abstract—The effects of screen contrast ratio, luminance level, and their interaction on visual lobe shape were examined in this study. The results showed that luminance level showed noticeable effects only on lobe perimeter. Though slightly larger area was noted upon increasing luminance level, none of the other shape parameters were significantly affected. The luminance level and its interaction with contrast ratio level did not affect any shape parameters. As a narrow range of luminance level and contrast ratio was used in this study, it might not be sufficient to generalize the results on visual lobe characteristics and further study with larger range of testing conditions is needed.
Index Terms—Contrast Ratio, Luminance Level, Lobe Shape Index, Visual Lobe Measurement.
III. INTRODUCTION
Visual search is an important part of many human activities. Despite advances in technology, vision is a topic of interest in industrial inspection where target items to be detected are embedded in a background of non-targets. When human fixate a point, visual sensitivity along the line of sight and sensitivity decreases approximately linearly into the periphery, and in the far periphery it falls off more rapidly [1]. The visual lobe is a useful concept to define the limit of peripheral sensitivity for particular target and background characteristics, and it represents the probability of target acquisition as a function of eccentricity from fixation.
As a huge number of reading are required to map the field-shape fully [2], which is extremely time-consuming, many studies were carried out by assuming that the lobe is homogeneous and symmetrical enough to be approximated by relatively few measurements on a limited number of meridians [3]. However, very irregular visual lobes were revealed with regions of noticeable insensitivity within the lobe boundary when visual lobes were mapped more fully on sixteen meridians, and subjects’ lobes were very different between each other [4-5]. Through thorough examinations of lobe size and shape [3-4] [6-8], results demonstrated that the lobe boundary was rather irregular and not likely be circle or ellipse.
Manuscript received December 1, 2007. This work was fully supported by a grant from the Research Grants Council of the Hong Kong Special Administrative Region, China [Project No. CityU 110407.
Manuscript received November 16, 2007. Cathy H. Y. Chiu is now with the Department of Manufacturing Engineering and Engineering Management, City University of Hong Kong (e-mail: [email protected]).
Alan H. S. Chan is now with the Department of Manufacturing Engineering and Engineering Management, City University of Hong Kong (e-mail: [email protected]).
These findings threw doubt on the validity of mathematical search models based on regular and homogeneous visual lobes for accurate performance prediction [9-10]. It seems that using visual lobe size alone does not guarantee satisfactory prediction of search performance. Later on, lobe shape was proven to be critical for a more precise prediction of search time [11]. Recently, many visual lobe studies were conducted on visual lobe area and shape [11-13]. The results showed that visual lobes were generally irregular with a low level of roundness, moderately rough boundaries and slightly asymmetric along vertical and horizontal axes. A direct comparison of lobe characteristics between Chinese and American subjects was made [12]. The results indicated that visual lobe for the Chinese students were slightly regular and had a medium level of roundness while those of the American students were much more circular and regular in shape. Chiu and Chan investigated the effects of visual display polarity and stimulus exposure duration on visual lobe shape [14]. Regardless of display polarity and exposure duration combinations, the results again demonstrated that visual lobe shape was slightly irregular and asymmetric, of medium roundness, and with a moderately rough boundary.
To a certain extent, visual lobe is a function of target, or stimulus being considered [15-17]. For example, stimulus size and color [18-19], contrast [6], target movement [20], stimulus exposure duration [21], and luminance of the background and target [6] were noted to have substantial effect on visual field size.
Many previous works focused on investigating the effects of luminance level and contrast ratio on visual performance [22-27] as well as visual acuity [28-29]. The recommendation for luminance standard in measuring acuity is 85 cd/m2 [30]. With higher levels of light intensity, the cones are activated, resulting in higher acuity and sensitivity, which levels off at about 3000 cd/m2. Sturr, Kline, and Taub found that visual acuity increased significantly when the luminance level was increased from 0.2cd/m2 to 245.5cd/m2 for both the youth and elderly [31].
showed that visual acuity increased as contrast ratio increased up to 8:1 and then decreased once the contrast ratio was greater than 8:1 [27]. Ojanpää and Näsänen found that mean fixation durations increased strongly and reading rates decreased significantly upon decreasing luminance contrast [37]. They suggested that the decrease in the reading performance might be due to the poor visual acuity resulted from using low luminance contrast.
Both luminance level and contrast ratio significantly affect visual performance. However different luminance background and stimulus combinations can result in equivalent contrast ratio. Many researchers thus concern about the effects of screen luminance and contrast ratio interaction on visual performance rather than considering them separately [26], [38]. Zhu and Wu found that there were significant interaction effects between contrast ratio and screen luminance on operator’s VDT performance [26]. Results of their study showed that by increasing the screen luminance, visual performance would be improved only on low contrast ratio, but declined on higher screen luminance. For TFT-LCD work, it was found that subjects had better performance with higher screen luminance combination on low contrast ratio [35]. On the other hand, better performance was noted with lower screen luminance combination on high contrast ratio. It was also suggested that considering screen luminance combination together with contrast ratio may be more appropriate than considering them separately [38].
Obviously, both lobe area and shape are significant factors affecting visual performance. Moreover, factors of luminance level, contrast ratio and their interaction significantly affect visual performance and visual acuity. However, no studies were conducted to investigate the effect of these two factors and their interactions on visual lobe shape characteristics. Thus, the present study was conducted to investigate the effects of these two factors and their interactions on visual lobe area and shape characteristics.
IV. DESIGN
A.Subjects
Seven male and one female undergraduates of City University of Hong Kong participated in this experiment. The mean age of the subjects was 22.5 years (range = 20 to 24). None of the subjects had prior experience in this kind of visual lobe mapping task. Each subject had a near acuity of at least 8 (20/25 Snellen notation).
B.Apparatus and Software
A Bausch and Lomb Orthorator (Model 2000P) was used for acuity measurement to screen the subjects to participate in the experiment. A Minolta luminance meter (LS-110) was used to ensure the luminance of background and target objects were consistent throughout the tests. A personal computer with AMD Athon 1200MHz microprocessor and 17-inch CRT monitor (1024 x 768 pixels) was used in this experiment. The subjects used a mechanical mouse to control stimulus presentation and to input their responses when estimating target positions. An adjustable chair was provided for comfort and to ensure that the line of regard was roughly perpendicular to and at the center of the screen. The application program VIsual Lobe Measurement System (VILOMS) was used for presentation of stimuli and for
response capture [13].
C.Stimuli
The stimuli were generated by the VILOMS and presented at a viewing distance of 500 mm from subjects. The resolution of the screen was 1280 x 1024 pixels. In this experiment, ‘X’ and ‘O’ were chosen as the background and target character, respectively. There were three levels of luminance, viz., 16, 32, and 45 cd/m2; and two levels of contrast ratio, i.e., 1:3 and 1:4. Consequently, six blocks of conditions were tested. Each subject was tested for all the six blocks randomly. Visual lobes of subjects were mapped on 24 imaginary and regularly spaced meridians originating from the center. In each presentation, the target appeared at only one of the 70 possible target locations along the 8 meridians while 419 background characters filled up all the background locations, forming a uniform two-dimensional test field of 27o (width) x 20o (height). The farthest target was located at an eccentricity of 16° on the diagonal meridians. The target, background and masking characters were of the same size, each of which subtended 20 min arc both horizontally and vertically with the centers separated by 96 min arc horizontally, 103 min arc vertically, and 68 min arc diagonally.
D.Procedure
within two character-spaces of the actual target location. The threshold value of the visual lobe in a meridian corresponded with the stimulus level eliciting 50% correct detection.
III. RESULTS
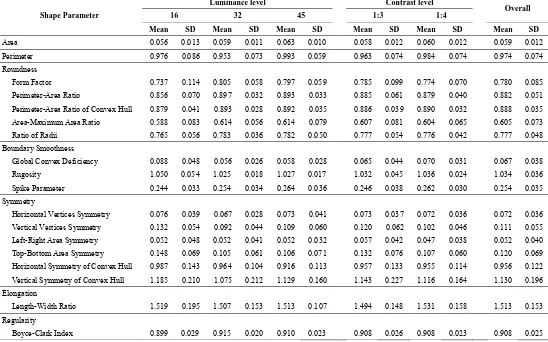
Sixteen shape indexes employed for depicting visual lobe shape attributes were grouped into five categories, namely, roundness, boundary smoothness, symmetry, elongation, and regularity. A more detailed description of these shape indexes can be found in Chan, et al. [13]. The mean values of
visual lobe area, perimeter, and the sixteen shape indexes for different experimental conditions are summarized in Table 1. As the target used in the current study was relatively easy, visual lobe contours for the subjects showed high level of roundness, slightly asymmetric along horizontal and vertical axes, and relatively smooth boundaries. The Boyce-Clark Index showed only slight irregularity for the lobe shapes.
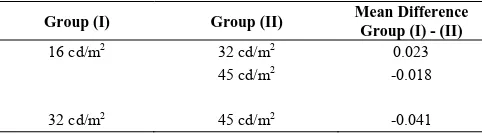
Repeated measures analysis of variance (repeated measures ANOVA) was performed to determine if there were any significant differences for luminance level, contrast ratio, and the interaction of luminance level and contrast ratio on lobe area, perimeter and the sixteen shape indexes. The results for the factors of luminance, contrast ratio and their interaction on lobe area, perimeter and the sixteen shape indexes are shown in Table 2.
For all the lobe shape parameters, the effects of contrast ratio and luminance level x contrast level interaction were non-significant (p’s > .05). The factor of luminance level was
significant only for perimeter (p < .05), but not for all the
other shape parameters (p’s > .05). Table 3 shows the mean
differences of perimeter between the three luminance levels. The largest mean value appeared for the 45 cd/m2 luminance level, the second was for 16 cd/m2 luminance level, and the least was for the 32 cd/m2 luminance level.
IV. DISCUSSION
In general, visual performance increases with increasing screen luminance combination. The study carried out by Sturr et al. showed that visual acuity dropped notably when
the luminance level was reduced from a high level to a low level (from 245.5 cd/m2 to 0.2 cd/m2) for both the youth and elderly [31]. As compared to the experimental condition conducted by Sturr et al. [31], Lin used a much narrow range
of screen luminance combination (i.e. background luminance level = 50 cd/m2 and 20 cd/m2) [36]. They found that the screen luminance combination did not significantly affect visual acuity. Similar to Lin’s study, the current study found that the effects of luminance level on visual lobe area and shape, except perimeter, were generally
not significant. This is probably due to the fact of using a relatively narrow luminance level range which might not be sufficient to generate notable result on visual lobe characteristics. Although the effect of luminance level did not reach a statistically significant level for most of the shape parameters, a slightly larger lobe area was still noted for 45 cd/m2 luminance level than that of 32 cd/m2 and 16 cd/m2 levels, which were consistent with several findings [26], [36] that high screen luminance level showed slightly better visual acuity than the low screen luminance combinations. The
results also accounted for the better visual performance resulted with increasing screen luminance combination. Sanders and McCormick suggested that the most suitable luminance ratio between immediate surroundings and the screen was 1:3 [32]. In the current study, high levels of lobe roundness, boundary smoothness, symmetry, and regularity were noted for lobe mapped under 1:3 contrast ratio condition. The results were concurrent with Sanders and McCormick’s recommendation as a good visual lobe shape was noted for lobe of 1:3 contrast ratio. Lobe shape characteristics of 1:4 contrast ratio was generally similar to that of 1:3 contrast ratio. The results account for the non-significant improvement on visual recognition from contrast ratio increased from 1:3 to 1:4 found by Chen and Lin [34].
V.CONCLUSION
[image:3.595.312.553.425.492.2]Due to the use of narrow ranges of luminance level and contrast ratio, these factors and their interaction showed no significant effect on most shape indexes, though it is still believed that luminance and contrast ratio are important factors affecting visual lobe shape. Therefore, the effects of these two factors and their interaction on visual lobe shape merit further investigation using wider ranges of luminance level and contrast ratio.
Table 3 Results of pairwise comparisons on perimeter with Least-Significant Difference method between different luminance levels
Group (I) Group (II) Mean Difference
Group (I) - (II)
16 cd/m2 32 cd/m2 0.023
45 cd/m2 -0.018
Table 1 Descriptive statistics of shape parameters for different conditions (Three luminance levels, two contrast levels, and overall)
Luminance level Contrast level
16 32 45 1:3 1:4 Overall
Shape Parameter
Mean SD Mean SD Mean SD Mean SD Mean SD Mean SD
Area 0.056 0.013 0.059 0.011 0.063 0.010 0.058 0.012 0.060 0.012 0.059 0.012
Perimeter 0.976 0.086 0.953 0.073 0.993 0.059 0.963 0.074 0.984 0.074 0.974 0.074
Roundness
Form Factor 0.737 0.114 0.805 0.058 0.797 0.059 0.785 0.099 0.774 0.070 0.780 0.085
Perimeter-Area Ratio 0.856 0.070 0.897 0.032 0.893 0.033 0.885 0.061 0.879 0.040 0.882 0.051
Perimeter-Area Ratio of Convex Hull 0.879 0.041 0.893 0.028 0.892 0.035 0.886 0.039 0.890 0.032 0.888 0.035
Area-Maximum Area Ratio 0.588 0.083 0.614 0.056 0.614 0.079 0.607 0.081 0.604 0.065 0.605 0.073
Ratio of Radii 0.765 0.056 0.783 0.036 0.782 0.050 0.777 0.054 0.776 0.042 0.777 0.048
Boundary Smoothness
Global Convex Deficiency 0.088 0.048 0.056 0.026 0.058 0.028 0.065 0.044 0.070 0.031 0.067 0.038
Rugosity 1.050 0.054 1.025 0.018 1.027 0.017 1.032 0.045 1.036 0.024 1.034 0.036
Spike Parameter 0.244 0.033 0.254 0.034 0.264 0.036 0.246 0.038 0.262 0.030 0.254 0.035
Symmetry
Horizontal Vertices Symmetry 0.076 0.039 0.067 0.028 0.073 0.041 0.073 0.037 0.072 0.036 0.072 0.036
Vertical Vertices Symmetry 0.132 0.054 0.092 0.044 0.109 0.060 0.120 0.062 0.102 0.046 0.111 0.055
Left-Right Area Symmetry 0.052 0.048 0.052 0.041 0.052 0.032 0.057 0.042 0.047 0.038 0.052 0.040
Top-Bottom Area Symmetry 0.148 0.069 0.105 0.061 0.106 0.071 0.132 0.076 0.107 0.060 0.120 0.069
Horizontal Symmetry of Convex Hull 0.987 0.143 0.964 0.104 0.916 0.113 0.957 0.133 0.955 0.114 0.956 0.122
Vertical Symmetry of Convex Hull 1.185 0.210 1.075 0.212 1.129 0.160 1.143 0.227 1.116 0.164 1.130 0.196
Elongation
Length-Width Ratio 1.519 0.195 1.507 0.153 1.513 0.107 1.494 0.148 1.531 0.158 1.513 0.153
Regularity
Boyce-Clark Index 0.899 0.029 0.915 0.020 0.910 0.023 0.908 0.026 0.908 0.023 0.908 0.025
Table 2 Repeated measures ANOVA on shape parameters for the luminance, contrast, and their interaction
Luminance Contrast Luminance * Contrast
Shape Parameter Sum of
Square (10-3)
df Mean
Square F
Sum of Square (10-3)
df Mean
Square F
Sum of
Square df
Mean
Square F
Area 0.375 2 0.000 2.937 0.041 1 0.000 2.416 0.000 2 0.000 0.220
Perimeter 13.240 2 0.007 4.259* 5.175 1 0.005 1.503 0.005 2 0.002 0.729
Roundness
Form Factor 44.579 2 0.022 2.583 1.678 1 0.002 0.525 0.003 2 0.001 0.381
Perimeter-Area Ratio 16.208 2 0.008 2.548 0.373 1 0.000 0.312 0.001 2 0.001 0.428
Perimeter-Area Ratio of Convex Hull 1.825 2 0.001 1.998 0.241 1 0.000 1.068 0.001 2 0.000 0.383
Area-Maximum Area Ratio 7.245 2 0.004 1.507 0.082 1 0.000 0.051 0.000 2 0.000 0.016
Ratio of Radii 3.286 2 0.002 1.622 0.012 1 0.000 0.018 0.000 2 0.000 0.005
Boundary Smoothness
Global Convex Deficiency 9.966 2 0.005 2.593 0.380 1 0.000 0.719 0.001 2 0.000 0.501
Rugosity 6.457 2 0.003 1.651 0.226 1 0.000 0.279 0.001 2 0.000 0.496
Spike Parameter 3.199 2 0.002 0.917 3.104 1 0.003 2.502 0.000 2 0.000 0.225
Symmetry
Horizontal Vertices Symmetry 0.758 2 0.000 0.247 0.012 1 0.000 0.038 0.001 2 0.000 0.381
Vertical Vertices Symmetry 13.444 2 0.007 3.228 3.729 1 0.004 2.501 0.000 2 0.000 0.191
Left-Right Area Symmetry 0.001 2 0.000 0.000 0.999 1 0.001 1.686 0.004 2 0.002 2.765
Top-Bottom Area Symmetry 19.115 2 0.010 3.717 7.164 1 0.007 2.893 0.001 2 0.000 0.108
Horizontal Symmetry of Convex Hull 42.104 2 0.021 2.396 0.034 1 0.000 0.002 0.007 2 0.003 0.330
Vertical Symmetry of Convex Hull 96.248 2 0.048 1.352 8.863 1 0.009 0.303 0.058 2 0.029 1.250
Elongation
Length-Width Ratio 1.276 2 0.001 0.044 16.400 1 0.016 2.146 0.011 2 0.006 0.356
Regularity
Boyce-Clark Index 2.118 2 0.001 3.442 0.003 1 0.000 0.014 0.000 2 0.000 0.014
[image:4.595.25.573.437.753.2]REFERENCES
[1] J. R. Bloomfield, “Studies on visual search,” in Reliability and quality
control. J. G. Fix and C. G. Drury Eds. London: Taylor & Francis, 1975,
pp. 31-43.
[2] J. D. Chaikin, H. H. Corbin, and J. Volkmann, “Mapping Field of
Short- Time Visual Search,” Science, vol. 138, 1962, pp.1327-1328.
[3] A. J. Courtney and H. S. Chan, “Visual lobe area for single targets on a
competing homogeneous background,” Human Factors, vol. 27, 1985,
pp. 643-652.
[4] A. J. Courtney and H. S. Chan, “Eight-axis visual field mapping for
targets embedded in a homogeneous competing background,”
Perceptual and Motor Skills, vol. 60, 1985, pp. 655–663.
[5] A. J. Courtney and H. S. Chan, “Mapping the binocular visual field for
a target embedded in a regular background,” Perceptual and Motor
Skills, vol. 61, 1985, pp.1067–1073.
[6] F. L. Engel, “Visual conspicuity, directed attention and retinal focus,”
Vision Research, vol. 11, 1971, pp. 563–576.
[7] M. Ikeda and T. Takeuchi, “Influence of foveal load on the functional
visual field,” Perception and Psychophysics, vol. 18, 1975, pp.
255–260.
[8] A. J. Courtney and H. S. Chan, “Visual lobe area mapping for targets on
a competing homogeneous background,” Journal of Human Ergology,
vol. 22, 1993, pp. 115–130.
[9] A. J. Courtney and L. Guan, “Visual search performance with complete
and incomplete visual lobe areas,” Ergonomics, vol. 39, 1996, pp.
749–756.
[10] S. K. Hong and C. G. Drury, “Sensitivity and validity of visual search
models for multiple targets,” Theoretical Issues in Ergonomics Science,
vol. 3, 2002, pp. 85–100.
[11] A. H. S. Chan and D. K. T. So, “Measurement and quantification of
visual lobe shape characteristics,” Ergonomics, vol. 36, 2006, pp.
541-552.
[12] Y. W. Tang and H. S. Chan, “A comparison of visual lobe shape
indexes for Chinese and American students.,” Proceedings of the 7th
International Conference on Work with Computer Systems 2004, Jun.
29 - Jul. 2 2004, CD Room Version.
[13] A. H. S. Chan, R. F. Yu and A. J. Courtney, “Quantifying visual field
shape for improving accuracy of search performance prediction,”
Perceptual and Motor Skills, vol. 100, 2005, pp. 195-206.
[14] C. H. Y. Chiu and A. H. S. Chan, “Display polarity, stimulus exposure
duration of visual lobe shape,” Perceptual and Motor Skills, vol. 104,
2007, pp. 467-480.
[15] M. B. Brown, “Mathematical approaches to modeling visual search,” in
Search and the Human Observer. J. N. Clare and M. A. Sinclair Eds.
London: Taylor & Francis, 1979, pp. 126-131.
[16] D. Kee, E. S. Jung and M. K. Chung, “Isoresponse time regions for the
evaluation of visual search performance in ergonomics interface
models,” Ergonomics, vol. 35, 1992, pp.243-252.
[17] A. F. Sanders, “Some aspects of the selective process in the functional
visual field,” Ergonomics, vol. 13, 1970, pp. 101-117.
[18] I. Abramov and J. Gordon, “Color vision in the peripheral retina. I.
Photopic spectral sensitivity,” Journal of the Optical Society of
America, vol. 67, 1977, pp. 195-202.
[19] J. Gordon and I. Abramov, “Color vision in the peripheral retina. II.
Hue and saturation,” Journal of the Optical Society of America, vol. 67, 1977, pp. 202-207.
[20] J. L. Barbur, “Visual periphery,” in Search and the Human Observer. J.
N. Clare and M. A. Sinclair Eds. London: Taylor & Francis, 1979, pp. 100-113.
[21] A. F. Sanders and R. Brűck, “The effect of presentation time on the size
of the visual lobe,” Bulletin of the Psychonomic Society, vol. 29, 1991, pp. 206–208.
[22] C. B. Mills and L. J. Weldon, “Reading text from computer screens,”
ACM Computing Surveys, vol. 19, 1987, pp. 329–358.
[23] K. K. Shieh and M. T. Chen, “Effects of screen color combination,
work-break schedule, and workplace on VDT viewing distance,”
International Journal of Industrial Ergonomics, vol. 20, 1997, pp.
11-18.
[24] K. K. Shieh and C. C. Lin, “Effects of screen type, ambient illumination,
and color combination on VDT visual performance and subjective
preference,” International Journal of Industrial Ergonomics, vol. 26,
2000, pp. 527-536.
[25] C. C. Lin, “Effects of contrast ratio and text color on visual
performance with TFT-LCD,” International Journal of Industrial
Ergonomics, vol. 31, 2003, pp. 65–72.
[26] Z. Zhu and J. Wu, “On the standardization of VDT's proper and optimal
contrast range,” Ergonomics, vol. 33, 1990, pp. 925-932.
[27] A. H. Wang and M. T. Chen, “Effects of polarity and luminance
contrast on visual performance and VDT display quality,”
International Journal of Industrial Ergonomics, vol. 25, 2000, pp.
415–421.
[28] A. J. Adams, L. S. Wong, L. Wong, and B. Gould, “Visual acuity
changes with age: Some new perspectives.,” American Journal of
Optometry and Physiological Optics, vol. 65, 1988, pp. 403-406.
[29] C. Owsley, M. E. Sloane, H. W. Skalka, and C. A. Jackson, “A
comparison of the Regan Low- Contrast Letter Charts and contrast sensitivity testing in older patients,” Clinical Vision Science, vol. 5, 1990, pp. 325-334.
[30] L. A. Olzak and J. P. Thomas, “Seeing spatial patterns,” in Handbook
of Perception and Human Performance. K. R. Boff, L. Kaufman, and J.
P. Thomas Eds. New York: Wiley, 1986
[31] J. F. Sturr, G. E. Kline, and H. A. Taub, “Performance of young and
older drivers on a static acuity test under photopic and mesopic
luminance conditions,” Human Factors, vol. 32, 1990, pp.1-8.
[32] M. S. Sanders and E. J. McCormick, “Human Factors in Engineering
and Design,” New York: McGraw-Hill, 1993.
[33] R. H. Peckham and W. J. Arner, “Visual acuity, contrast, and flicker, as
measures of retinal sensitivity,” Journal of the Optical Society of
America, vol. 42, 1952, pp. 621-625.
[34] M. T. Chen and C. C. Lin, “Comparison of TFT-LCD and CRT on
visual recognition and subjective preference,” International Journal of
Industrial Ergonomics, vol. 34, 2004, pp. 167-174.
[35] C. C. Lin, “Effects of screen luminance combination and text color on
visual performance with TFT-LCD,” International Journal of
Industrial Ergonomics, vol. 35, 2005, pp. 229-235.
[36] C. C. Lin, “Effects of color combination of visual acuity and display
quality with TFT-LCD,” Journal of the Chinese Institute of Industrial
Engineers, vol. 23, 2006, pp. 91-99.
[37] H. Ojanpää and R. Näsänen, “Effects of luminance and colour contrast
on the search of information on display devices,” Displays, vol. 24,
2003, pp. 167-178.
[38] C. C. Lin and K. C. Huang, “Effects of ambient illumination and screen
luminance combination on character identification performance of
desktop TFT-LCD monitors,” International Journal of Industrial