Behaviour of three dimensional concrete structures under concurrent orthogonal seismic excitations
332
0
0
Full text
(2) © All copyrights are reserved to the author..
(3) In God I believe and in God I trust. To my beloved mother and in the loving memory of my father. To my dearest wife Shahinaz and adorable sons Kareem and Hadi..
(4)
(5) © All copyrights are reserved to the author..
(6)
(7) ABSTRACT This thesis is a study into the response and seismic safety of three-dimensional multi-storey concrete structures under concurrent orthogonal seismic excitations. It employs the nonlinear timehistory method as its analysis tools. Time-history analyses rely heavily on their utilised earthquake records. Accordingly, this study examines the different approaches of selecting earthquake suites and develops a methodology of selecting representative earthquake scenarios. This methodology is credibly implemented in selecting a far- and a near field suites representative of the New Zealand seismic hazard. The study investigates the response of 6-, 9- and 12-storey concrete structures of different n-X-bays × m-Y-bays. Bidirectional responses of these considered structures are examined and consequently the current combination rules are scrutinised. Consequently this study strongly recommends the use of the 40-percent combination rule in lieu of the widely used 30-percent rule; and the use of time-history analysis in lieu of quasi/equivalent static and response modal analysis methods to avoid their strong dependence on combination rules. An intensive study is conducted employing the incremental dynamic analysis (IDA) technique to investigate structural demands of interstorey drifts, lateral storey drifts and storey accelerations. The study utilises the developed far-field suite and identifies the 50th and 90th percentile demands. Hence it provides easy-to-use expressions to facilitate rapid calculation of the structural demands and the effects of biaxial interactions. An implementation into the Demand and Capacity Factor Design (DCFD) format is presented that infers confidence in the performance levels of the considered structures.. The study also draws attention to the. importance of considering storey accelerations as their storey values reach as high as 10 × PGA. A sensitivity study is conducted by repeating the IDA investigation while using the developed near-field suite. Subsequently a comparison between the near- and the far-field results is conducted. The results were markedly similar albeit of less magnitudes until the (seismic hazard) intensity measure IM = Sa(T1) = 0.4g when the near-field results show sudden flat large increase in demands suggesting a brittle collapse. This is attributed to the higher content of the higher mode frequencies contained in near-field ground motions. Finally, the study examines the (vectorial) radial horizontal shear demands in columns and beam-column joints of the previous far- and near-field studies. The combined radial shear demands in corner, edge and internal columns and joints are evaluated that roughly show a square-root proportional relationship with IM that exhibit somewhat brittle failure at IM ≥ 0.35g. Shears demands in the (4-way) internal columns and the (2-way) corner joints show highest magnitude in their respective class. The results suggest transverse joint shear reinforcement of 1.5, 1.0 and 0.5 of the longitudinal reinforcement of the neighbouring beam respectively for corner, edge and internal joints. An implementation of a proposed practical (and simpler) DCFD format shows satisfactory confidence in columns performance in shear up to IM = 0.35g, conversely to joints unsatisfactory performance in shear at the onset of inelastic behaviour (IM > 0.05g). Preliminaries - 2007-08-03 (Final).doc. -i-. 4/08/2007 - 12:36:12 a.m..
(8) Preliminaries - 2007-08-03 (Final).doc. - ii -. 4/08/2007 - 12:36:12 a.m..
(9) ACKNOWLEDGEMENTS I express my deepest gratitude and appreciation to Professor John Mander for his indispensable help, enthusiasm, generosity, constant support, and ultimately his patience with me. I am certainly honoured to have the opportunity of being a student of Professor Mander, a unique experience of being guided by a master. Indeed I shall never forget the great meetings and enlightening discussions with Professor Mander and their resulting legendary notes. In fact all my words will fail to express appropriately my sincere admiration to Professor Mander. I would like to express my sincere appreciation and gratitude to Professor Athol Carr whom effectively provided important insights and guided this study till its completion. I shall always appreciate and remember the strong support of Professor Carr especially during my early starting time in New Zealand. He generously helped me establish myself and always was eagerly open to my questions and discussions. I would like to convey my deep gratitude to Associate Professor Peter Moss whom guided my research in its early stages and provided indispensable suggestions and reviews. I express my sincere gratitude and appreciation to Professor David Elms. Professor Elms taught me a lot about risk analysis and the probabilistic nature of structural behaviour and safety. Indeed without the genuine support and help of Professor Elms, I would not have been able to complete this research. I would like to express my utmost admiration and deepest gratitude to Professor David Gunby for his indispensable help, generosity, constant support, and his patience with me. I present my deepest appreciation and gratitude to Dr John Berrill whom taught me a lot about the nature of our beast, earthquakes. I indeed appreciate his continuous support, remarks and highly informative discussions. I would like to express my utmost respect and gratitude to Professor Andrew Buchanan whom supported and encouraged me to pursue my research to fruition. In fact Professor Buchanan was instrumental in helping me during the times of mid-thesis crisis and indeed at all times. Preliminaries - 2007-08-03 (Final).doc. - iii -. 4/08/2007 - 12:36:12 a.m..
(10) I strongly express my deepest gratitude and utmost admiration to my dear mother Nabila Moawad for her dedication and encouragement over the years endeavouring my success and excellence. She never doubted my abilities and always has strongly believed that I shall succeed in my pursued avenues. Mum I love you endlessly. I express my utmost appreciation and deepest gratitude to my dear wife Shahinaz Bakir whom supported and encouraged me along the development of this thesis, and forbore with me its dire times. Shahi please accept my sincere congratulations: It is your turn! Enjoy! I strongly express my deepest admiration and appreciation to Mrs Sonja Blackburn for helping me during those darkest times. I shall always appreciate Mrs Blackburn understanding, suggestions and support that reignited my passion to pursue and complete this study. Also, I would like to express my genuine gratitude and appreciation to Dr Lynne Briggs and Dr Alexander Macleod for their indispensable help and support that recovered me to pursue and complete this study. Finally, I would like to express my deep gratitude to the Department of Civil Engineering – University of Canterbury for their partial financial assistance of this study.. Preliminaries - 2007-08-03 (Final).doc. - iv -. 4/08/2007 - 12:36:12 a.m..
(11) TABLE OF CONTENTS ABSTRACT. .................................................................................................................................... I. ACKNOWLEDGEMENTS ...............................................................................................................III TABLE OF CONTENTS .................................................................................................................... V Chapter 1. 1.1 1.2 1.3 1.4 1.5. INTRODUCTION .................................................................................................... 1-1. General Overview and Motivation .................................................................................. 1-1 Expected Outcomes and Scope........................................................................................ 1-3 What then is Particularly New in This Thesis? ............................................................... 1-3 Thesis Organisational Outline ......................................................................................... 1-5 References........................................................................................................................ 1-6. Chapter 2.. SELECTION OF THE EMPLOYED SUITES OF EARTHQUAKES.................... 2-1. Summary .................................................................................................................................. 2-1 2.1 Introduction...................................................................................................................... 2-2 2.2 Initial Suite of Earthquakes ............................................................................................. 2-2 2.3 Improved Suite Selection: Far- and Near-Field Suites .................................................... 2-4 2.3.1 Far-field Earthquake Suite........................................................................................ 2-6 2.3.2 Near-field Earthquake Suite ..................................................................................... 2-9 2.3.3 Proposed Methodology for Selecting Representative Earthquake Suites .............. 2-12 2.4 Conclusions and Recommendations .............................................................................. 2-14 2.5 References...................................................................................................................... 2-14 Chapter 3.. THREE-DIMENSIONAL BEHAVIOUR OF STRUCTURES UNDER CONCURRENT ORTHOGONAL SEISMIC EXCITATIONS ............................. 3-1. Summary 3-1 3.1 Introduction and Scope .................................................................................................... 3-2 3.2 Findings from Previous Research and Practice ............................................................... 3-3 3.2.1 Properties of Seismic Excitations ............................................................................. 3-3 3.2.2 Orientation of Earthquake Resultants....................................................................... 3-5 3.2.3 Critical Angle of Earthquake Incidence ................................................................... 3-6 3.2.4 Orthogonal Effects.................................................................................................... 3-6 3.2.5 Independence of Earthquake Components ............................................................... 3-7 3.2.6 Multicomponent Seismic Excitations and Combination Rules ................................ 3-7 3.3 Initial Elastic Study Employing SAP2000 .................................................................... 3-11 3.3.1 Overview ................................................................................................................ 3-11 3.3.2 Employed Suite of Earthquakes ............................................................................. 3-11 3.3.3 Initial Set of Studied Prototype Structures ............................................................. 3-12 3.3.4 Methodology Employed in applying Earthquake Components.............................. 3-13 3.3.5 Evaluation of κ and γ-percent values ...................................................................... 3-13 3.3.6 Results of the Elastic Time-History Analyses........................................................ 3-14 Preliminaries - 2007-08-03 (Final).doc. -v-. 4/08/2007 - 12:36:12 a.m..
(12) 3.3.7 Effect of Number of Stories ....................................................................................3-16 3.3.8 Time-History Analysis Using The Suite Reoriented to Principal Directions .........3-16 3.4 Further Study Employing Ruaumoko 3D.......................................................................3-17 3.4.1 Overview .................................................................................................................3-17 3.4.2 Second Set of Prototype Structures .........................................................................3-18 3.4.3 Results of the Time-History Analyses.....................................................................3-19 3.5 Discussion of Findings and the γ-percent Ratios............................................................3-20 3.6 Conclusions and Recommendations...............................................................................3-21 3.6.1 Recommendations ...................................................................................................3-21 3.6.2 Further Research......................................................................................................3-22 3.7 References ......................................................................................................................3-22 Chapter 4.. AN IMPLEMENTATION OF INCREMENTAL DYNAMIC ANALYSIS TO ASSESS THE PERFORMANCE, CAPACITY AND DAMAGE LIMITS OF THREE-DIMENSIONAL STRUCTURES ..............................................................4-1. Summary ...................................................................................................................................4-1 4.1 Introduction and Scope.....................................................................................................4-2 4.2 Background.......................................................................................................................4-4 4.3 Methodology Employed in the IDA Study.......................................................................4-5 4.3.1 Overview ...................................................................................................................4-5 4.3.2 Employed Set of Prototype Structures ......................................................................4-5 4.3.3 Identifying elected IM(s) and EDP(s) .......................................................................4-7 4.4 IDA Results and Discussion.............................................................................................4-8 4.4.1 Structural Maximum Demands .................................................................................4-9 4.4.1.1 Radial Interstorey Drifts............................................................................................4-9 4.4.1.2 Structural Maximum Response of Lateral Storey Drifts.........................................4-13 4.4.1.3 Structural Maximum Response of Storey Accelerations ........................................4-15 4.4.1.4 Completed Set of Indicative Values of Structural Performance and Demands ......4-18 4.4.1.5 Structural Dynamic Magnification factors of Storey Accelerations .......................4-19 4.4.2 Storeys’ Maximum Response Profiles ....................................................................4-19 4.5 Implementation into DCFD Format ...............................................................................4-22 4.5.1 Evaluation of Demand Factor γ ...............................................................................4-23 4.5.2 Evaluation of Factored Demands γD.......................................................................4-25 4.5.3 Evaluation of Capacity Reduction Factor φ ............................................................4-26 4.5.4 Deemed Capacity Values C.....................................................................................4-27 4.5.5 Factored-Demand-to-Capacity Ratio λ and Confidence Level CL% ......................4-28 4.5.6 Fragility Curves for different Performance Levels .................................................4-29 4.6 Conclusions ....................................................................................................................4-30 4.7 References ......................................................................................................................4-32 Chapter 5. Summary. SENSITIVITY STUDY INTO THE NEAR-FIELD EFFECTS ON PREVIOUS FAR-FIELD FINDINGS...........................................................................................5-1 ...................................................................................................................................5-1. Preliminaries - 2007-08-03 (Final).doc. - vi -. 4/08/2007 - 12:36:12 a.m..
(13) vii 5.1 5.2 5.3. Introduction and Scope .................................................................................................... 5-2 Background...................................................................................................................... 5-2 Methodology Employed in the IDA Study...................................................................... 5-3 5.3.1 Overview .................................................................................................................. 5-3 5.3.2 Employed Set of Prototype Structures...................................................................... 5-3 5.3.3 Employed Earthquake Scenario................................................................................ 5-4 5.3.4 Framework of the IDA Study ................................................................................... 5-5 5.4 IDA Results and Discussion ............................................................................................ 5-6 5.4.1 Overview .................................................................................................................. 5-6 5.4.2 Structural Maximum Demands................................................................................. 5-7 5.4.2.1 Radial Interstorey Drifts .................................................................................... 5-8 5.4.2.2 Structural Maximum Response of Lateral Storey Displacements................... 5-10 5.4.2.3 Structural Maximum Response of Storey Accelerations................................. 5-12 5.4.2.4 Completed Set of Indicative Values of Structural Performance and Demands5-14 5.4.2.5 Structural Dynamic Magnification factors of Storey Accelerations ............... 5-16 5.4.3 Storeys’ Maximum Response Profiles ................................................................... 5-17 5.5 Implementation into DCFD Format and Fragility Curves............................................. 5-20 5.6 Conclusions and Recommendations .............................................................................. 5-21 5.7 References...................................................................................................................... 5-23 Chapter 6.. A STUDY INTO HORIZONTAL SHEAR DEMANDS AND CAPACITY FOR COLUMNS AND BEAM-COLUMN JOINTS WHEN SUBJECTED TO BIDIRECTIONAL SEISMIC EXCITATION ......................................................... 6-1. Summary .................................................................................................................................. 6-1 6.1 Introduction and Scope .................................................................................................... 6-2 6.2 Background...................................................................................................................... 6-3 6.2.1 Background on Horizontal Shears in Concrete Columns ......................................... 6-3 6.2.2 Background on Horizontal Joint Shears ................................................................... 6-4 6.3 Methodology Employed in the IDA Study...................................................................... 6-6 6.3.1 Horizontal Shear Demands and Capacities for Columns ......................................... 6-6 6.3.2 Horizontal Shear Demands and Capacities for Joints .............................................. 6-7 6.4 IDA Results and Discussion ............................................................................................ 6-7 6.4.1 Overview .................................................................................................................. 6-7 6.4.2 Horizontal Shear Demands and Capacities for Beam-Column Joints .................... 6-11 6.5 Practical DCFD Format and Fragility Curves ............................................................... 6-12 6.5.1 Illustrative example on Interstorey Drifts............................................................... 6-15 6.5.2 Practical DCFD Implementation into Shears in Columns and Joints..................... 6-16 6.6 Conclusions and Recommendations .............................................................................. 6-18 6.7 References...................................................................................................................... 6-19 Chapter 7. 7.1. CONCLUSIONS, RECOMMENDATIONS AND FURTHER RESEARCH......... 7-1. Summary of Conclusions................................................................................................. 7-1 7.1.1 Chapter 2. Selection of The Employed Suites of Earthquakes................................. 7-1. Preliminaries - 2007-08-03 (Final).doc. - vii -. 4/08/2007 - 12:36:12 a.m..
(14) 7.1.2. Chapter 3. Three-Dimensional Behaviour of Structures Under Concurrent Orthogonal Seismic Excitations ................................................................................7-1 7.1.3 Chapter 4. An Implementation of Incremental Dynamic Analysis to Assess the Performance, Capacity and Damage Limits of Three-Dimensional Structures ........7-1 7.1.4 Chapter 5. Sensitivity Study into the Near-Field Effects on the Previous Far-Field Findings .....................................................................................................................7-2 7.1.5 Chapter 6. A Study into Horizontal Shear Demands and Capacity for Columns and Beam-Column Joints when Subjected to Bidirectional Seismic Excitations .....7-2 7.2 Recommendations ............................................................................................................7-3 7.3 Limitations and future Research.......................................................................................7-5 Appendix A1. FEMA LEVELS OF PERFORMANCE AND STOREYS’ MAXIMUM RESPONSE UNDER THE FAR-FIELD SUITE EXCITATION .........................A1-1 A1.1 FEMA 273, 274 and 356 Levels of Structural Performance .........................................A1-1 A1.1.1 Immediate Occupancy Structural Performance Level (S-1) ..................................A1-1 A1.1.2 Damage Control Structural Performance Range (S-2)...........................................A1-1 A1.1.3 Life Safety Structural Performance Level (S-3).....................................................A1-2 A1.1.4 Limited Safety Structural Performance Range (S-4) .............................................A1-2 A1.1.5 Collapse Prevention Structural Performance Level (S-5) ......................................A1-2 A1.2 Storeys’ Maximum Response under Far-Field Suite Excitation ...................................A1-3 A1.3 References ...................................................................................................................A1-34 Appendix A2. STOREYS’ MAXIMUM RESPONSE UNDER THE NEAR-FIELD SUITE EXCITATION........................................................................................................A2-1 Appendix A3. METHOD EMPLOYED IN COMPUTING HORIZONTAL JOINT SHEARS...A3-1 A3.1 A3.2 A3.3. Shears in Beam-Column Joint .......................................................................................A3-1 Shear Capacity of Beam-Column Joints, VjhC ...............................................................A3-1 Shear Demands of Beam-Column Joints, Vjh ................................................................A3-1. Preliminaries - 2007-08-03 (Final).doc. - viii -. 4/08/2007 - 12:36:12 a.m..
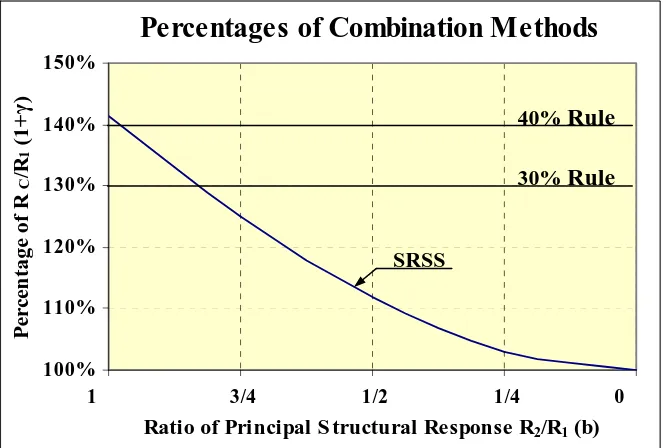
(15) Chapter 1.. 1.1. INTRODUCTION. GENERAL OVERVIEW AND MOTIVATION Our cities are continuing to expand at an ever increasing rate with a new larger, and more. complex, buildings. However, current engineering practice is that these structures are still largely designed using earlier two-dimensional design assumptions. To allow for the threedimensional nature of their structure they use various combination rules to combine the twodimensional results to form the results for the three-dimensional structure. The recent increasing availability of software that can readily analyse three-dimensional structures has helped but many of the design strategies are still based on two-dimensional concepts.. The loadings. standards or codes still tend to assume one direction of loading at a time and then use a combination rule to obtain the three-dimensional response. Even though the newer packages are easier to use there is still the unanswered question: Do the combined two-dimensional responses adequately model the three-dimensional problem? Design codes suggest the use of quasi/equivalent static and response modal analysis methods that both rely heavily on current combination rules. Combination methods include the “Square Root of Sum of Squares” (SRSS), Rosenblueth (1951), “Complete Quadratic Combination” (CQC), Wilson et al (1981), CQC3, Menun and Der Kiureghian (1998), 30- and 40-percent rules plus others. Implementation of these combination rules has many potential shortcomings. To avoid these difficulties one can resort to nonlinear time-history analyses. These analyses have had significant improvement over the past decade with better modelling, faster computers and the benefit of experimental work giving more reliable modelling of the material behaviour. However, time-history analyses rely heavily on the selection of the earthquake record and the earthquake scenarios that are used in the analyses raising the question: How can one appropriately select a representative earthquake scenario?. Chapter 1 - Intro 2007-08-03 (Final).doc. 1-1. 3/08/2007 - 11:52:04 p.m..
(16) Endeavouring to understand and predict the behaviour of multi-storey concrete buildings has captured the interest of researchers, albeit it can be overwhelming when considered in a three-dimensional sense. Seismic awareness raises a myriad of questions are raised about the performance of our structures under earthquake excitation, how they are expected to behave during an earthquake event and how may their performance be enhanced.. Probabilistic. implementation of Performance-Based Earthquake Engineering (PBEE) has been the subject of much ongoing research in the past years [Kennedy et al (1980), Bazzurro and Cornell (1994), Wen (1995) and Beck (1999)].. Probabilistic PBEE has been first implemented in design. guidelines of nuclear power plants [e.g., Kennedy and Short (1994) and DOE (1994)]. The performance objectives in the context of probabilistic PBEE can be defined as the probability of exceeding a performance level, see FEMA 356 (2000). SAC-FEMA 350 (2000) provides guidelines for design and assessment of steel momentresisting buildings.. FEMA 356 (2000) provides guidelines for rehabilitation of existing. buildings, including concrete structures, to achieve agreeable level of performance. However, a clear set of recommendations for design of buildings to achieve a designated performance level is lacking. Quantifying the structural performance under seismic excitations depends on various factors including structural damage, non-structural content damage, human casualties and life cycle costs. Nonlinear time-history analysis can be implemented to assess the structural damage and to facilitate estimation of non-structural damage and life cycle costs. Performance-based Earthquake Engineering (PBEE) requires that engineers agree with building owners on the incorporated level of performance in the considered building.. Financial institutions and. insurance companies often also require identification of such built-in level of performance in order to respectively fund and cover the building. Such requirements demand attention and must be met at the early stages of conception even before conducting extensive nonlinear time-history analyses. This leads to the question: How can engineers simply, but yet comprehensively, assess. Chapter 1 - Intro 2007-08-03 (Final).doc. 1-2. 3/08/2007 - 11:52:04 p.m..
(17) and explain the built-in level of performance of the building to non-engineer entities? And what is the level of confidence that a given performance objective can be met? Earthquakes are divided by their epicentral distance into near-, medium- and far-field events/suites, where the medium- and far-field events are the prevailing ones.. The 1994. Northridge earthquake is largely considered to be a near-field event that resulted in the most costly damage in United States history. Such damage was in part attributed to higher mode effects but, as yet, no explanation has been provided for how and why they particularly cause such marked damage. This yields a further question: How different are the behaviour and consequent damage of near-field events from the prevalent medium- and far-field events?. 1.2. EXPECTED OUTCOMES AND SCOPE This thesis endeavours answering these above-mentioned questions, that could be posed by. engineering practitioners, by means of nonlinear dynamic analysis and employing the probabilistic PBEE. The scope of this study is limited to multi-storey bare moment-resisting concrete structures with no eccentricities that are designed to meet requirements of the current loading and material codes with particular emphasis on the seismic code provisions. This study examines the validity of the prevailing seismic design assumptions and provides its findings and results in design formats, guidelines and recommendations that can be implemented into seismic design regulations.. 1.3. WHAT THEN IS PARTICULARLY NEW IN THIS THESIS? This section spells out the new (unique) contributions of this thesis, which can be. summarised as follows: •. This study investigates different approaches of selecting earthquakes suites and draws attention to associated characteristics and potential problems relevant to each selection approach. Consequently, it presents a stepwise recipe for selecting earthquake scenarios that are representative of a site-specific seismic hazard.. Chapter 1 - Intro 2007-08-03 (Final).doc. 1-3. 3/08/2007 - 11:52:04 p.m..
(18) •. The thesis draws attention to the marked similarity between seismic hazards of Western United States (Southern California in particular) and New Zealand. Consequently New Zealand researchers and practitioners can utilise earthquakes from this geographic region, thus overcome the unavailability of a sufficiently large number of strong ground motion records in New Zealand.. •. This study investigates the origins and format of the current combinational rules and scrutinises their appropriateness by conducting an intensive nonlinear time-history study of an extensive set of multi-storey structures with different plan configurations and number of storeys. Hence, a more appropriate combination rule is verified and presented.. •. The study addresses the long overlooked structural response parameters of lateral storey drifts and accelerations. This is conducted for representative far- and near-field seismic hazards. Simple expressions for estimating storey drifts and accelerations are provided. Consequently, it reports on expected damage due to storey accelerations in particular and how to minimise it.. •. This study examines the bidirectional structural response under representative far- and nearfield excitations. Accordingly it presents correction factors for the expected bidirectional structural response due to biaxial amplifying/demplifying interaction for bisymmetric structures (bidirectional fundamental period ratio Tx/Ty = 1) and for structure with Tx/Ty ≤ 1.5.. •. The study investigates the type and mode of failure under representative bidirectional farand near-field seismic excitations.. Radial (vectorial sum of X- and Y-components). horizontal shears in columns and beam-column joints are investigated. Consequently the study suggests enhanced seismic detailing for columns in their near-joint zones against undue shear failure. Further it proposes a further strengthening to the beam-column joints by means of transverse shear reinforcement that is related (by amplification multiplier) to the joint-beam main reinforcement to counteract joint shear hinging and undue failure. •. The study presents a more practical DCFD formulation that facilitates the implementation of the probabilistic PBEE by the engineering practitioners.. Chapter 1 - Intro 2007-08-03 (Final).doc. 1-4. 3/08/2007 - 11:52:04 p.m..
(19) 1.4. THESIS ORGANISATIONAL OUTLINE This thesis is presented in the order of its development and organised into seven chapters. discussing and studying the following: Chapter 1 is the current chapter. It introduces the problem of quantifying the behaviour and response of three-dimensional structures under concurrent orthogonal seismic excitations. Hence it presents the underling motivations, scope and objectives of this thesis. Chapter 2 examines the selection of earthquake suites that starts with a practitioner-style selected suite of earthquakes and presents its properties. Selection of earthquake scenarios is further developed to account for site-specific seismic hazard and achievable minimum (randomness) variability. This proposed methodology of selection is implemented in the selection of medium- to far-field and near-field suites that presents more credible properties when compared with the earlier suite. Finally, this proposed methodology for selecting representative earthquake scenarios is presented.. Chapter 2 is the. essential foundation of this study as it provides for the selection of the representative suites of earthquakes used in this thesis and consequently its findings. Chapter 3 presents the constitutive behaviour of three-dimensional structures under concurrent seismic excitation. Subsequently it reviews the foundations and assumptions utilised in developing the current combination rules. Consequently the study embarks on identifying the appropriate combination rule by employing intensive nonlinear timehistory analyses for an extensive set of 6-, 9- and 12-storey structures. Chapter 4 extensively studies and assesses the performance, capacity and damage limits of 12-storey three-dimensional structures excited by the developed far-field suite by employing the incremental dynamic analysis (IDA) technique.. Results of this. chapter are later implemented into the emerging Demand and Capacity Factor Design (DCFD) format in order to assess and illustrate the associated confidence level in the considered structures meeting designated performance levels. Finally Chapter 1 - Intro 2007-08-03 (Final).doc. 1-5. 3/08/2007 - 11:52:04 p.m..
(20) the chapter presents and discusses a fragility formulation of the structural demands versus their capacities. Chapter 5 strictly repeats the implemented procedures of Chapter 4 while using the developed near-field suite. This chapter investigates the sensitivity of the results and findings of Chapter 4 to near-field effects. Consequently, Chapter 5 presents its findings in a comparative fashion that identifies and explains similarities and differences in response of the considered structures under excitations of the near- and far-field suites. Chapter 6 investigates radial horizontal shears in the columns and beam-column joints of the considered prototype structures endeavouring to identify the type and mode of their reported failure. Chapter 6 employs both the near- and field suites. Demand-tocapacity ratios for radial horizontal shears in columns and beam-column joints are computed and studied, and consequently recommendations are provided.. An. implementation into a more practical DCFD formulation is conducted and presented that simplifies the application of the DCFD format to engineering practitioners. Chapter 7 summarises the thesis and presents the main conclusions of the current research. Finally, recommendations and suggestions for further studies are given.. 1.5. REFERENCES. Bazzurro, P.; Cornell, C. A., (1994). “Seismic hazard analysis of nonlinear structures. I: Methodology”, Journal of Structural Engineering, ASCE, Vol. 120, No. 11, pp. 3320-3344. Beck, J. L., Chan, E., Irfanoglu, A. and Papadimitriou, C. (1999). “Multi-criteria optimal structural design under uncertainty”, Earthquake Engineering & Structural Dynamics, Vol. 28, No. 7, pp. 741-761. DOE (1994). “Natural phenomena hazards design and evaluation criteria for Department of Energy Facilities”, DOE-STD-1020-94, U. S. Department of Energy, Washington, D. C. Kennedy, R. P., Cornell, C. A., Campbell, R. D., Kaplan, S. and Perla, H. F. (1980), “Probabilistic. Chapter 1 - Intro 2007-08-03 (Final).doc. 1-6. 3/08/2007 - 11:52:04 p.m..
(21) seismic safety study of an existing nuclear power plant”, Nuclear Engineering and Design, Vol 59, pp. 315-338 Kennedy, R. P., and Short, S. A. (1994). “Basis for seismic provisions of DOE-STD-1020”, UCRL-CR-111478 and BNL-52418, Lawrence Livermore National Laboratory and Brookhaven National Laboratory. Menun, C., and Der Kiureghian, A. (1998). “A replacement for the 30%, 40% and SRSS rules for multicomponent seismic analysis”, Earthquake Spectra, Volume 14, No. 1, pp.153-163. Rosenblueth, E. (1951). A Basis for Aseismic Design, Ph.D. thesis, University of Illinois, Urbana, Illinois, USA. Wen, Y. K., (1995). “Building reliability and code calibration”, Earthquake Spectra, Vol. 11, No. 2, pp. 269-296. Wilson, E., Der Kiureghian, A. and Bayo, E. (1981). “A replacement for the SRSS method in seismic analysis”, Earthquake Engineering and Structural Dynamics, Vol. 9, pp. 187-194.. Chapter 1 - Intro 2007-08-03 (Final).doc. 1-7. 3/08/2007 - 11:52:04 p.m..
(22) (This page is intentionally left blank). Chapter 1 - Intro 2007-08-03 (Final).doc. 1-8. 3/08/2007 - 11:52:04 p.m..
(23) Chapter 2.. SELECTION OF THE EMPLOYED SUITES OF EARTHQUAKES. SUMMARY Successful time-history analysis is highly dependant, among other factors, on the selection and use of a proper representative suite of earthquakes. Selected suites must well cover the response of studied structures and adhere to the expected ground motions that may occur. Initially, a suite is chosen based on well-known events including typical maximum considered earthquakes that are renowned for their propensity to induce damage. Earthquake records of this initial suite are selected from existing databases that lack some information about epicentral distances (R) and soil classification beneath the recording station. The initial suite shows high level of record-to-record variability that consequently elevates randomness in the time-history analysis outcomes.. Subsequently, the suite selection criteria evolve into selecting high. magnitude earthquakes by means of epicentral distances (R), peak ground accelerations (PGA), being recorded on firm soils among other parameters. A far-field suite is selected and expanded around the suite of Vamvatsikos and Cornell (2004) and the same criteria are implemented in the selection of a near-field suite. Both selected suites show improvement via lower levels of record-torecord randomness, thus increasing confidence in the nonlinear time-history analysis results upon implementation for MDOF systems. A proposed procedure is presented that outlines step-wisely the employed methodology of suite selection that is portable and can be extended to acquire broadly a representative one-, two- or three-dimensional earthquake suites and scenarios.. Chapter 2 - EQ Suites 2007-08-03 (Final).doc. 2-1. 3/08/2007 - 10:57:24 p.m..
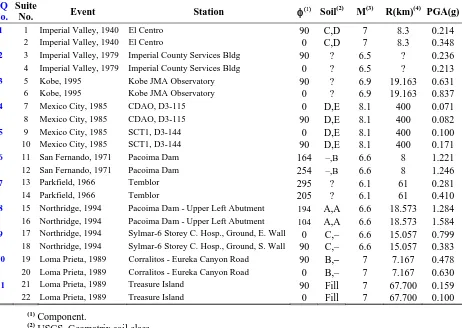
(24) 2.1 INTRODUCTION The selection criteria of earthquakes used in this study initially observe their high magnitudes and renowned induced damage. They are later replaced by more elaborate and stringent criteria such as epicentral radial distances (R), least randomness and being recorded on firm soils plus others. The first chosen suite encompasses extreme seismic events as well as some traditionally employed earthquakes. This initial suite exhibits a high level of randomness and soilspecific amplification that lead to some uncertainty on the findings. A subsequent breakdown into medium-to-far- and near-field earthquake events is followed, seeking maximum ground accelerations with minimal record-to-record randomness.. This randomness is minimised by. studying the spectral accelerations of the horizontal records of potential earthquakes. Finally, elaborate criteria are implemented that emphasise epicentral (radial) distances, peak ground accelerations, moment magnitude of events, maximum spectral acceleration at the fundamental period of a structure, structure soil properties and least randomness. These criteria are calibrated by a comparative study with the Vamvatsikos and Cornell suite (2004) of 20 ground motions used in their studies. This chapter will discuss the evolution of the earthquake suites utilised in this study and give general criteria for developing similar suites. In future, these criteria can be used in different geographical regions as more earthquake records become available.. 2.2 INITIAL SUITE OF EARTHQUAKES The time-history analysis used 11 pairs of horizontal orthogonal accelerograms of selected earthquakes that displayed extreme character in their moment magnitude and resulting damage, and included some of the traditionally used earthquakes as listed in Table 2-1. This style of selection resembles typically how practitioners might pick their records for non-linear time-history analyses.. No vertical components were considered because they are commonly. disregarded in general practice. The selection of this set of earthquakes was based upon their high peak ground accelerations and adverse characteristics of their acceleration response spectra. Chapter 2 - EQ Suites 2007-08-03 (Final).doc. 2-2. 3/08/2007 - 10:57:24 p.m..
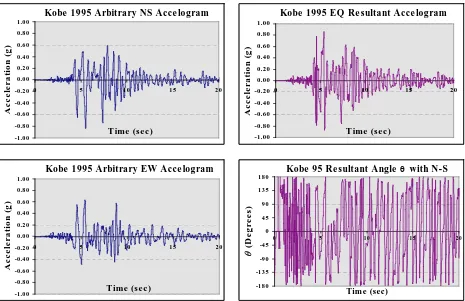
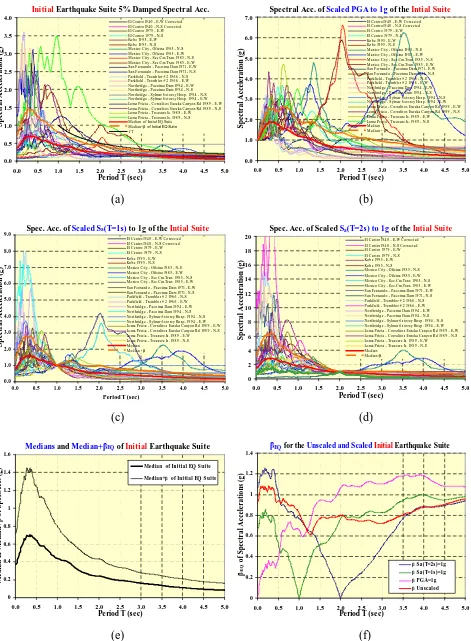
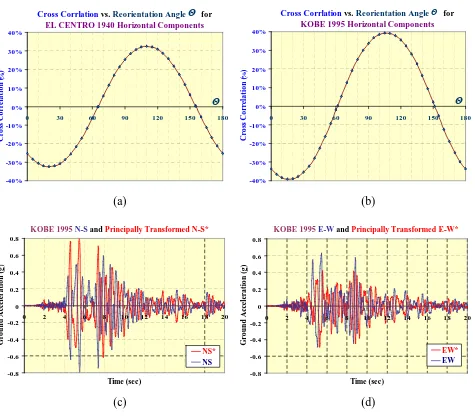
(25) Figure 2-1 presents the 5% damped acceleration spectra of this suite that well cover the fundamental X and Y periods of the studied structures and show different patterns. When inspecting Figure 2-1, some earthquake spectral accelerations exceeded the 1/T upper bound that is specific to medium- to long-period structural response. Note that 1/T is anchored at the elected value of 1g for 1-second period and signifies constant spectral velocity region that has spectral acceleration proportional to 1/T, Kircher (1997). This indicates that such exceeding records are either near-field events or soil-specifically magnified. These records were Loma Prieta (1989) Treasure Island, Mexico City (1985) SCT and Oficina, San Fernando (1971) Pacoima Dam and Kobe (1995). The implemented accelerograms were initially those recorded in the arbitrary orthogonal directions set for accelerometers of the recording station. Subsequently, the accelerograms had been transformed and re-orientated to their principal directions according to Penzien and Watabe (1975), where minimal cross-correlations were sought.. Different responses were recorded.. However, they showed insignificant change in character than that for the analyses using the arbitrary horizontal components of the selected earthquakes. They generally exhibited a larger scatter than when using arbitrary original records.. Consequently and henceforth, original. earthquake records were used rather than re-orientated ones. Implementation of incremental dynamic analysis (IDA) requires the linear scaling of magnitudes of earthquake records that consequently scales their spectral accelerations. Figures 2-2, 2-3 and 2-4 show spectral accelerations of the scaled initial suite by setting spectral accelerations of zero- (PGA), one- and two-second periods to 1g respectively. They all show elevated dispersion between the presented spectral accelerations, particularly in the PGA scaling to 1g. PGA scaling to 1g helps in identifying the inherent character of accelerograms readying them for comparative study at a uniform PGA level of 1g. For example, Figure 2-2 well illustrates the anticipated amplified response of two-second period structures by accelerograms of Mexico City (1985) SCT. Furthermore, scaling of Sa(T1) and Sa(½T1) provides insights about. Chapter 2 - EQ Suites 2007-08-03 (Final).doc. 2-3. 3/08/2007 - 10:57:24 p.m..
(26) the anticipated response and helps in searching for any peculiarities. Note that Sa(T1) represent the fundamental structural response and Sa(½T1) would collectively represent other modes of high participation factors in the overall response of the considered structure. Other values, such as one-third or one-fifth T1 that relate respectively to second and third translational natural periods, were investigated albeit no significant change in the screening process with respect to Sa(½T1) was noticed. Hence Sa(½T1) was elected to be used in this study. In essence, the initial suite exhibits high level of randomness, as displayed in Figure 2-5 where the lognormal standard deviation of the suite (βEQ) acts as a measure of randomness for seismic input demands across different periods. These βEQ values were calculated from the suite spectral accelerations per period across all suite records. Furthermore, Figure 2-6 shows how this randomness markedly affects the median+βEQ (84th percentile) values when compared with the median (50th percentile) values that would adversely affect the results. Although useful for gaining insight into what type of naturally occurring earthquakes that may cause damage, this suite was later discarded due to its high overall record-to-record randomness. Moreover, some of the records lack sufficient information and others were recorded on very soft soils. Consequently, this early practitioner-style selected suite was replaced by another two suites, one represents a medium- to far-field seismic scenario and the other represents a near-field scenario.. 2.3 IMPROVED SUITE SELECTION: FAR- AND NEAR-FIELD SUITES Numerous previous studies have looked into the minimum number of earthquake records that provides a credible representation of an earthquake scenario, where recent research provided a reasonable achievable number of 20 records. According to FEMA 356 (2002) - section 3.3.2.2.4; seven or more consistent pairs of horizontal ground motion records are to be used for time history analysis.. Han and Wen (1997) used 1234 accelerograms, mostly synthetic.. Synthetic. accelerograms are not widely accepted among structural engineering practitioners. Earthquake databases are a preferred source of ground motions.. Chapter 2 - EQ Suites 2007-08-03 (Final).doc. 2-4. Those can provide a large number of. 3/08/2007 - 10:57:24 p.m..
(27) earthquake records; however, they feature large variability and inconsistency in their characteristics. Consequently, practitioners are bewildered by how to appropriately choose and form a suite of representative ground motions. It is hypothesised in this thesis that in order to achieve credible and sound results, randomness in the seismic demand should be minimised by reducing record-to-record randomness in the seismic input demands. Therefore, one requires selecting a suite of consistent earthquake accelerograms that pose the least achievable randomness and can be gathered from the reasonably limited earthquake record databases. Shome and Cornell (1999) and Vamvatsikos and Cornell (2001 and 2004) used and reported that for mid-rise buildings, 10 to 20 records are usually enough to provide sufficient accuracy in the estimation of seismic demands, on the application of a relatively efficient intensity measure (IM), such as Sa(T1,5%). The sufficiency of 20 records was based on a previous study of Abrahamson and Silva (1997). New Zealand seismic hazard (risk) somewhat resembles that of South California. Due to the paucity of strong motions in New Zealand, the use of South Californian earthquakes has been adopted in this study.. Seismic hazard of a building would be generated by plotting the. probability of exceedance (PE) of an earthquake event versus an intensity measure (IM), in particular 5% damped spectral acceleration of the fundamental period Sa(T1). They are generally provided by seismologists. Figure 2-7, based on Stirling et al (2002) and USGS (2002), shows the seismic hazard curves for Christchurch and Wellington along with Santa Barbara in Southern California. These curves provide the mean annual frequency of exceeding 5% damped spectral acceleration value for fundamental periods of 0 (PGA) and 2 seconds. Approximating such curves in a region of interest by a power-law relationship is beneficial in identifying regionspecific seismic hazard characteristics. DOE (1994) and Luco and Cornell (1998A) suggested the following power-law relationship: H Sa ( sa ) = P[S a ≥ x ] = k 0 x − k. (2.1). where k0 and k are coefficients of log-log linear regression that define the shape of the hazard curve. Note that k0 is dependent on the seismicity of individual sites and k is the logarithmic Chapter 2 - EQ Suites 2007-08-03 (Final).doc. 2-5. 3/08/2007 - 10:57:24 p.m..
(28) slope of the hazard curve. Table 2-2 lists the values of k0 and k for Wellington and Christchurch within the study’s area of interest between DBE and MCE values, see Figure 2-7. It provides median values of k0 = 0.0001 and k = -2.78, which essentially resemble typical values of South California, USGS (2002) and FEMA 350 (2000) – Table A-2. FEMA 350 suggests a value of k = 3 for the Pacific coast of the United States. Such defining value markedly resembles that of New Zealand, Stirling et al 2002. Therefore, the author settled on using South Californian earthquakes that henceforth are referred to as Californian for brevity. 2.3.1. FAR-FIELD EARTHQUAKE SUITE The far-field suite was selected in light of the medium- to far-field suite of Vamvatsikos. and Cornell (May 2004) –referred to henceforth as the V&C suite– which was chosen by implementing selection criteria based upon moment magnitude, distance and soil classification. The V&C suite is based on ground motion records developed by Somerville et al (1997). The V&C suite consists of 20 earthquake records of relatively large moment magnitudes of 6.5–6.9 and moderate distances ranges from 15.1–31.7 km, peak ground acceleration (PGA) ranges between 0.638–0.042 g, all recorded on firm/non-soft soils and bearing no marks of directivity. USGS soil classification for the suite ranges from B to C (Soil B has an Average Shear Wave Velocity to a depth of 30m (VS-30) ranging between 360–750 m/s, while VS-30 of Soil C ranges between 180–360 m/s). The Geomatrix soil classification of the suite was typically D (Soil D is deep broad soil and the measuring instrument is on/in a soil profile at least 20m thick overlying rock or in a broad valley). Shome and Cornell (1999) reported for mid-rise buildings that 10 to 20 records suffice to provide appropriate accuracy in estimating seismic demands upon using a relatively efficient intensity measure such as the 5% damped first-mode spectral acceleration, Sa(T1,5%). Consequently and upon utilising the upper limit, 20 Californian earthquakes were sought that possess two horizontal components. Upon studying and sorting the V&C suite, only 12 earthquakes having two horizontal components were present and Californian, as listed in Table 2-3. The Imperial Valley. Chapter 2 - EQ Suites 2007-08-03 (Final).doc. 2-6. 3/08/2007 - 10:57:24 p.m..
(29) 1979 – Cucapah was dropped as only one horizontal component and the vertical one were recorded. The statistical properties of the suite are listed in Table 2-4. Selection of an extra eight far-field earthquakes was conducted utilising the PEER Strong Motion Database (2000) and observing PGA of records are not less than 0.2g, moment magnitudes are greater than 6.5, closest distances to fault rupture (R) range between 15–32 km and soil classification is C or firmer according to USGS and D or firmer according to Geomatrix. The selected eight earthquakes, as listed in Table 2-5, were in keeping with the USGS soil types of the V&C suite of B–C. On the other hand, they were on stiffer soils, B–D, according to Geomatrix soil classification compared with typically soil D for the original suite. In order to minimise randomness and adhering to the general characteristics of the V&C suite, potential earthquakes were investigated using their spectral accelerations by means of scaling and comparing with those of the original V&C suite. The suite was populated with their nonincluded horizontal components, thus it will be identified as the populated V&C suite for brevity. Spectral accelerations (with 5% damping) of the populated V&C suite were computed and plotted among their maximum and minimum bounds, plus their median (50th percentile) and median+βEQ (84th percentile) values, as shown in Figure 2-8. Note that all spectral acceleration values were less than the plotted 1/T curve, indicating no near or site-specific events were included. Afterwards, the 5% damped spectral accelerations were firstly scaled by setting PGA to 1g and later plotted amidst their maximum and minimum bounds, plus their median and median+βEQ, as shown in Figure 2-10. Moreover, further scaling of the 5% damped spectral acceleration were performed where Sa(T=1s) and Sa(T=2s) both scaled to 1g, as displayed in Figures 2-12 and 214. Sa(T=2s) was included in light of the fact that the two translational natural periods of the structure are 2.002s. Following the same previously stated procedure, the 5% damped spectral accelerations of the potential added 8 earthquake records were computed and plotted amidst the maximum and minimum bounds of the original V&C suite, as displayed in Figure 2-9. Again, all spectral acceleration values were less than the 1/T curve, indicating no near or site-specific. Chapter 2 - EQ Suites 2007-08-03 (Final).doc. 2-7. 3/08/2007 - 10:57:24 p.m..
(30) events were included. Furthermore, the 5% damped spectral accelerations were scaled by setting PGA, Sa(T=1s) and Sa(T=2s) to 1g and being plotted amidst the maximum and minimum bounds of the original V&C suite, as displayed in Figures 2-11, 2-13 and 2-15. The extra earthquakes were selected by being bounded respectively between the maximum and minimum bounds of the original V&C suite and having their PGAs ≥ 0.2g and Sa(T1, 5%) ≥ 0.1g. This selection process yielded seven earthquakes, as listed in Table 2-5, that were increased to eight by adding the renowned Imperial Valley 1940 - El Centro, as a credible benchmark earthquake. The statistical properties of the extra eight earthquakes are listed in Table 2-6, which resembles those of the original suite albeit of higher moment magnitude and PGA as intentionally targeted. The above outlined selection criteria proved to be successful as the lognormal standard deviations of the 5% damped spectral accelerations (β) of the added eight earthquakes returned much lower values when compared with those of the original populated V&C suite, as depicted in Figures 2-16 and 2-17. Therefore, these added eight earthquakes have lower randomness than the original suite, which ensures credible results with justifiable high confidence. On inspecting Figure 2-18, the median and median+βEQ values of the spectral accelerations of the added eight are higher than those of the populated original V&C Suite, as initially intended, by as much as 65%. However, on combining the two suites, the median and median+βEQ drop to a maximum of 124% of that of the original suite and 113% at the two translational natural periods (T=2.0s) of the structure, as shown in Figure 2-19. The statistical properties of the combined far-field suite are listed in Table 2-7. On comparing Tables 2-4 and 2-7, the median values of moment magnitudes (M) increased from 6.8 to 6.9, the closest distances to fault rupture (R) decreased from 24.4 to 22.7 km, while the median value of the PGA increased from 0.204 to 0.242 g respectively. The values of βEQ for the produced far-field suite were predominantly less than those of the original V&C suite. Figure 2-20 illustrates the reduction in randomness in seismic input demands, where between PGA and T = 0.5s the far-field and V&C suites interchanged reporting. Chapter 2 - EQ Suites 2007-08-03 (Final).doc. 2-8. 3/08/2007 - 10:57:24 p.m..
(31) minimum values. For T ≥ 0.5s, values of βEQ of the far-field and V&C suites were 0.679 < 0.728, 0.765 < 0.845, 0.653 < 0.685, 0.638 < 0.704 (≈ 10% drop) and 0.709 < 0.848 at T = 0.6, 1.0, 1.5, 2.0 (IM of considered structures) and 3.0 seconds respectively. In conclusion, this reported reduced randomness of the far-field suite would assure that the suite represents a credible earthquake scenario and consequently provide credible results albeit at the targeted high acceleration magnitudes of the suite’s records. 2.3.2. NEAR-FIELD EARTHQUAKE SUITE When aiming for a broad representation of the structural seismic response and its. corresponding demands, a near-field suite is also required in case the location of the considered structure is close to a major fault line. This suite should also adhere to the selection criteria of the V&C suite and per the implemented procedure of the far-field suite. Again, adopting the Shome and Cornell (1999) principle that 20 records should suffice in estimating seismic demands, 20 earthquakes were sought such that their R ≤ 8km to ascertain near-field effects, PGA’s ≥ 0.4g and Sa(T1, 5%) ≥ 0.3g to ensure robust seismic response. Due to the limited availability of near-field earthquake records in general and California in particular who meet the previously-outlined criteria, several non-Californian events were included.. It is noteworthy to mention that. Northridge 1994 motions were absent from the original V&C suite, as most records are generally regarded as near-field. Thus, it was included liberally in this near-field suite, in contrast with the far-field suite where records only with R ≥ 22.8 km were included. Upon implementing the outlined procedure employed to the selection of the far-field suite and the R, PGA and Sa(T1, 5%) newly set limits, 14 Californian earthquakes were selected plus eight non-Californian ones. All accelerograms were recorded on firm soils with USGS soil classification ranges between B–C, A–D for Geomatrix and 1 for CWB (Central Weather Bureau, Taiwan). A list of these 20 selected earthquakes is shown in Table 2-8.. Chapter 2 - EQ Suites 2007-08-03 (Final).doc. 2-9. 3/08/2007 - 10:57:24 p.m..
(32) Generally, the non-Californian earthquakes are broadly of higher moment magnitude and peak ground accelerations (PGA) than the Californian ones, as listed in Tables 2-9 and 2-10, which provide their statistical data. Table 2-11 shows the statistical data the combined suite. From Tables 2-11, one can envisage that the median (50th percentile) value of the peak ground acceleration of the combined near-field suite is more than two and a half time (265%) that of the original V&C suite.. Consequently, the comparison of the unscaled spectral. accelerations should be trivial. Indeed the median values of both the Californian and nonCalifornian suites are always greater than the maximum bound of the original V&C suite, as displayed in Figures 2-21 and 2-22. Note also that median values were close or exceeded the 1/T curve in both figures, as expected for near-field events.. Therefore, the confirmation of. earthquake selection was confined to the comparison between the scaled 5% damped spectral accelerations, where PGA, Sa(T=1s, 5%) and Sa(T=2s, 5%) were scaled to 1g, and plotted amidst the scaled maximum and minimum bounds of the original V&C suite. These plots for the Californian earthquakes are provided in Figures 2-23, 2-25 and 2-27. While, the plots of the non-Californian earthquakes are displayed in Figures 2-24, 2-26 and 2-28. On inspecting Figures 2-23 and 2-24, a small number of earthquake records of both the Californian and non-Californian 5% damped spectral accelerations, with PGA scaled to 1g, exceeded the maximum bound of the scaled original V&C suite. However, one can dismiss such exceedance on reviewing their high median values in comparison with that of the original suite. Figures 2-25 to 2-28 confirm the selection of earthquake records as per Table 2-8, where their 5% scaled spectral accelerations were largely bound between both the scaled maximum and minimum bounds of the original V&C suite. On inspecting Figure 2-25, three earthquake records of the Californian 5% damped spectral accelerations, with Sa(T=1s) scaled to 1g, insignificantly exceeded the maximum bound of the scaled original V&C suite. On the other hand and from Figure 2-26, only one earthquake record of the non-Californian 5% damped spectral accelerations, with Sa(T=1s) scaled to 1g, markedly exceeded the scaled maximum. Chapter 2 - EQ Suites 2007-08-03 (Final).doc. 2-10. 3/08/2007 - 10:57:24 p.m..
(33) bound. On further investigation of Figures 2-27 and 2-28, both Californian and non-Californian 5% damped spectral accelerations, with Sa(T=2s) scaled to 1g, were fully confined by the scaled maximum and minimum bounds of the original V&C suite. Further studying of the dispersion of both the Californian and non-Californian 5% damped spectral accelerations, as shown in Figures 2-29 and 2-30; indicate low values that confirm the selection, as they indicate low randomness (βEQ). From Figure 2-29, shows the Californian βEQ values to be less than 0.5 for periods of two-second or less, except for Sa(T=2s) scaled to 1g where values peak to 0.6 g. Figure 2-30 exhibits βEQ values largely under 0.5 for two-second periods and less, again except for Sa(T=2s) scaled to 1g where βEQ > 0.7 for T ≤ 1.0s. When recalling Figure 2-16, largely βEQ > 0.5 for T ≤ 2.0s, which highlight quite high randomness of the original V&C suite in contrast with those lower values of the selected nearfield earthquake suite. Furthermore, Figure 2-31 of the combined near-field suite exhibits βEQ values that are less fluctuating and of reduced randomness. The βEQ values for the combined suite have an overall average value βEQ ≈ 0.4 for T ≤ 2.0s, with βEQ < 0.5, except for Sa(T=2s) scaled to 1g where βEQ < 0.7 for T ≤ 0.5s. Moreover, Figure 2-31 shows an overall smaller randomness and lower variability than that depicted in Figure 2-16 of the original suite. Median (50th percentile) and median+βEQ (84th percentile) values of the combined nearfield suite plus the original V&C suite are plotted in Figure 2-32, which shows the marked difference in magnitude and reduced randomness.. Figure 2-32 exhibits clearly the lower. randomness of the combined near-field suite, when inspecting the two curves of median+βEQ. The values of βEQ for the produced near-field suite were always less than those of the original V&C suite.. Figure 2-33 illustrates the reduction in randomness in seismic input. demands for values of T. For 0 ≥ T ≥ 3.0s, values of βEQ of the near-field and V&C suites were 0.388 < 0.742, 0.439 < 0.695, 0.449 < 0.845, 0.392 < 0.685, 0.408 < 0.704 (˜ 42% drop) and 0.486 < 0.848 at PGA, T = 0.6, 1.0, 1.5, 2.0 (IM of considered structures) and 3.0 seconds respectively. In conclusion, this reported reduced randomness of the near-field suite would. Chapter 2 - EQ Suites 2007-08-03 (Final).doc. 2-11. 3/08/2007 - 10:57:24 p.m..
(34) assure that the suite captures a viable range of credible near-field earthquake scenarios and consequently provide credible results albeit the targeted high acceleration magnitudes of the suite’s records. 2.3.3. PROPOSED METHODOLOGY FOR SELECTING REPRESENTATIVE EARTHQUAKE SUITES Based on the previous selection of the far- and near-fields, the procedure can be. summarised into steps that would be followed endeavouring a credible selection of representative earthquake suites and scenarios. The steps are as follows: 1. Identify the level of PGA and Sa(T1) for the considered structure at the elected percentage of damping, e.g. 5-percent. 2. From local faulting and seismology, and also informed by the governing loading code, [NZS1170.5 (2004)] and seismic hazard maps identify whether near-, medium- and/or far-field seismic events would be the representative scenario for the site of the considered structure. 3. Obtain or calculate k0 and k seismic hazard coefficients of the site of the considered structure in order to identify representative earthquakes from geographic area that matches the considered seismic hazard. 4. Set the initial search parameters of the elected strong motion database, e.g. PEER (2000), by moment magnitude (M) > 6.5 and closest distance to the rapture surface (R) to be: R ≤ 8km, 8km ≤ R ≤ 40km and R ≥ 40km for near-, medium- and far-field events respectively. Also enforce damped PGA ≥ 0.2g and ≥ 0.4 for far- and near-field events respectively.. Further, select representative soil classification albeit for credible. earthquake scenario it is preferable to choose at least C for USGS, D for Geomatrix or 1 for CWB classifications. Consequently, site-specific soil amplifications can be avoided. 5. Download the above-mentioned criteria-matched earthquakes including all their component accelerograms and spectral accelerations, if available, else compute them. 6. Select only earthquakes from identified geographic areas of matching seismic hazard. Chapter 2 - EQ Suites 2007-08-03 (Final).doc. 2-12. 3/08/2007 - 10:57:24 p.m..
(35) 7. Build an information table listing the properties of all components for each initially selected earthquake. These data include accelerogram information including recording station, component type and direction, M, R, damped PGA and Sa(T1) values. 8. Select earthquakes, including their components, that at least one of their horizontal components has high value of Sa(T1). Consequently, limit the number of selected earthquakes to a little more than 20, say about 25, that achieve the highest available values of Sa(T1). 9. For far-field suites, plot spectral accelerations of the horizontal components between the maximum and minimum spectral acceleration bounding values obtained from the above-developed far-field suite. Subsequently, cull earthquakes that exceed 1/T or have a component significantly exceeding the maximum bound in order to remove earthquakes that breach the guidelines. 10. For near-field events, plotting spectral accelerations of the horizontal components between the maximum and minimum spectral acceleration bounding values of the above-developed near-field may be helpful. It would show whether the newly selected near-field suite is relatively of lower or higher magnitude in comparison with the above-developed one. 11. Scale and plot the spectral accelerations of the remaining horizontal components by setting the value of PGA = 1g. Subsequently inspect the plot and eliminate any earthquake with peculiar large peak values around a specific period value, as highlighted previously in the case of Mexico City (1985) records, see Figure 2-2. 12. Moreover, scale and plot the remaining spectral accelerations by setting the values of Sa(½T1) and Sa(T1) to 1g. Afterwards, inspect the plots for any peculiarities or marked exceedance of the maximum bounding values in order to remove breaching earthquakes. Note that scaling with the spectral acceleration values of one-third or one-fifth T1 could also be used.. Chapter 2 - EQ Suites 2007-08-03 (Final).doc. 2-13. 3/08/2007 - 10:57:24 p.m..
(36) 13. If the total number of earthquakes drops below 20, repeat the above detailed procedure with slightly reduced thresholds of M, R and PGA. Repeat this procedure until 20 earthquakes are acquired. For near-field events, it is expected to later relax the rule of selecting earthquakes only from geographic areas with matching seismic hazard due to the scarcity of these records. Note that for two-dimensional analysis, the same proposed procedure applies where both horizontal accelerogram can be used along with the vertical one if considered. Consequently, this methodology can be applied to both two- or three-dimensional studies of structures.. 2.4 CONCLUSIONS AND RECOMMENDATIONS The employed methodology in selecting both the far- and near-field proved credibility by their reported reduced randomness (βEQ). Chapters four, five and six later show that marked reduced randomness in the structural response and behaviour that assures the credibility of their findings. The proposed stepwise procedure is portable and can be easily followed in selecting representative one-, two- or three-dimensional earthquake suites and scenarios. Finally, it is worthwhile to mention that South Californian strong motion records can be implemented in New Zealand, and vice versa, due to the confirmed large resemblance in their seismic hazard characteristics. It is highly recommended to follow the proposed procedure in selecting and/or verifying the selection appropriateness of representative earthquake suites and scenarios. Earthquakes recorded on soft soils should be strictly avoided to avoid site-specific amplification as depicted in the case of the earthquake records of Mexico City (1985), see Figure 2-2.. 2.5 REFERENCES Abrahamson, N. A., and Silva, W. J. (1997). “Empirical response spectra attenuation relations for shallow crustal earthquakes”, Seismological Research Letters (SRL), Vol. 68, pp94-127. Federal Emergency Management Agency (FEMA) (2002). “Seismic rehabilitation pre-standard.” Report No. FEMA-356, Washington DC. Chapter 2 - EQ Suites 2007-08-03 (Final).doc. 2-14. 3/08/2007 - 10:57:24 p.m..
(37) DOE (1994). “Natural phenomena hazards design and evaluation criteria for Department of Energy Facilities”, DOE-STD-1020-94, U. S. Dept. of Energy, Washington DC. Federal Emergency Management Agency (FEMA) (2000).. “FEMA 350 – Recommended. Seismic Design Criteria for New Steel Moment-Frame Buildings.” Report No. FEMA350, Washington DC. Han, S.W., and Wen, Y.K. (1997). “Method of Reliability-Based Seismic Design. I: Equivalent Nonlinear Systems. II: Calibration of Code Parameters”, Journal of Structural Engineering, ASCE, Vol. 123. No. 3, pp. 256-270. Kircher, C. A., Nassar, A. A., Kustu, O. and Holmes, W. T. (1997). "Development of Building Damage Functions for Earthquake Loss Estimation", Earthquake Spectra, Vol. 13, No. 4, pp. 663-682, Earthquake Engineering Research Institute, Oakland, California. Luco, N., and, Cornell, C. A., (1998A). “Seismic drift demands for two SMRF structures with brittle connections”, Structural Engineering World Wide 1998, Elsevier Science Ltd., Oxford, England, Paper T158-3. NZS1170.5 and Supp 1 (2004). “Structural design actions – Earthquake actions – New Zealand”, Standards New Zealand, 2 parts, Wellington, New Zealand. PEER Strong Motion Database (2000). Complied by Dr. Walt Silva of Pacific Engineering, Pacific Earthquake Engineering Research Center (PEER), University of California at Berkeley. http://peer.berkeley.edu/smcat/. Penzien, J. and Watabe, M. (1975). “Characteristics of 3-dimensional earthquake ground motions”, Earthquake Engineering and Structural Dynamics, Vol. 3, pp. 365-373. Shome, N., and Cornell, C. A. (1999). “Probabilistic seismic demand analysis of nonlinear structures”, Report No. RMS-35, RMS Program, Stanford University, Stanford, CA. http://www.stanford.edu/group/rms/Thesis/NileshShome.pdf. (Last time accessed: 08 January 2007). Somerville, P., Smith, N., Puntamurthula, S., and Sun, J. (1997). “Development of ground. Chapter 2 - EQ Suites 2007-08-03 (Final).doc. 2-15. 3/08/2007 - 10:57:24 p.m..
(38) motion time histories for phase 2 of the FEMA/SAC steel project.” SAC Background Document SAC/BD-97/04, SAC Joint Venture, Richmond, California. Stirling, M. W., McVerry, G. H. and Berryman, K. R. (2002). “A New Seismic Hazard Model for New Zealand”, Bulletin of the Seismological Society of America, Vol. 92. No. 5, June 2002, pp. 1878-1903. USGS (2002). “USGS national seismic hazard maps”, United States Geological Survey http://geohazards.cr.usgs.gov/eq/. Vamvatsikos, D., and Cornell C. A. (2002). “Incremental Dynamic Analysis”, Earthquake Engineering and Structural Dynamics, Vol. 31, pp. 491–514. Vamvatsikos, D., and Cornell, C. A. (2004).. “Applied incremental dynamic analysis”,. Earthquake Spectra, Earthquake Engineering Research Institute (EERI), Vol. 20, No. 2, pp. 523–553, Earthquake Engineering Research Institute, Oakland, California.. Chapter 2 - EQ Suites 2007-08-03 (Final).doc. 2-16. 3/08/2007 - 10:57:24 p.m..
(39) Table 2-1. EQ Suite No. No. 1 2 3 4 5 6 7 8 9 10 11. 1 2 3 4 5 6 7 8 9 10 11 12 13 14 15 16 17 18 19 20 21 22. Event Imperial Valley, 1940 Imperial Valley, 1940 Imperial Valley, 1979 Imperial Valley, 1979 Kobe, 1995 Kobe, 1995 Mexico City, 1985 Mexico City, 1985 Mexico City, 1985 Mexico City, 1985 San Fernando, 1971 San Fernando, 1971 Parkfield, 1966 Parkfield, 1966 Northridge, 1994 Northridge, 1994 Northridge, 1994 Northridge, 1994 Loma Prieta, 1989 Loma Prieta, 1989 Loma Prieta, 1989 Loma Prieta, 1989. The Initial Earthquake Suite.. Station El Centro El Centro Imperial County Services Bldg Imperial County Services Bldg Kobe JMA Observatory Kobe JMA Observatory CDAO, D3-115 CDAO, D3-115 SCT1, D3-144 SCT1, D3-144 Pacoima Dam Pacoima Dam Temblor Temblor Pacoima Dam - Upper Left Abutment Pacoima Dam - Upper Left Abutment Sylmar-6 Storey C. Hosp., Ground, E. Wall Sylmar-6 Storey C. Hosp., Ground, S. Wall Corralitos - Eureka Canyon Road Corralitos - Eureka Canyon Road Treasure Island Treasure Island. φ(1) Soil(2). M(3). 90 0 90 0 90 0 0 90 0 90 164 254 295 205. 7 7 6.5 6.5 6.9 6.9 8.1 8.1 8.1 8.1 6.6 6.6 6.1 6.1 6.6 6.6 6.6 6.6 7 7 7 7. 194 104. 0 90 90 0 90 0. C,D C,D ? ? ? ? D,E D,E D,E D,E –,B –,B. ? ? A,A A,A C,– C,– B,– B,– Fill Fill. R(km)(4) PGA(g) 8.3 8.3 ? ? 19.163 19.163 400 400 400 400 8 8 61 61 18.573 18.573 15.057 15.057 7.167 7.167 67.700 67.700. 0.214 0.348 0.236 0.213 0.631 0.837 0.071 0.082 0.100 0.171 1.221 1.246 0.281 0.410 1.284 1.584 0.799 0.383 0.478 0.630 0.159 0.100. (1). Component. USGS, Geomatrix soil class. (3) Moment magnitude. (4) Closest distance to fault rupture. (2). Chapter 2 - EQ Suites 2007-08-03 (Final).doc. 2-17. 3/08/2007 - 10:57:24 p.m..
(40) Table 2-2.. Linear regression coefficients (k0 and k) of Seismic hazard on intensity measure (Sa) for Christchurch and Wellington, based on Stirling et al (2002). Linear regression coefficients (k0 and k) of New Zealand Seismic Hazard Wellington PGA T=2s. k0 Median k0 k Median k. Chapter 2 - EQ Suites 2007-08-03 (Final).doc. 3 x 10⁻⁴. Christchurch PGA T=2s. 5 x 10⁻⁵. 5 x 10⁻⁵. 8 x 10⁻⁷. 0.0001 -2.74. -2.43. -2.81. -3.58. -2.78. 2-18. 3/08/2007 - 10:57:24 p.m..
Figure
+7
Outline
N EAR FIELD E ARTHQUAKE S UITE
P ROPOSED M ETHODOLOGY FOR S ELECTING R EPRESENTATIVE E ARTHQUAKE S UITES
M ULTICOMPONENT S EISMIC E XCITATIONS AND C OMBINATION R ULES
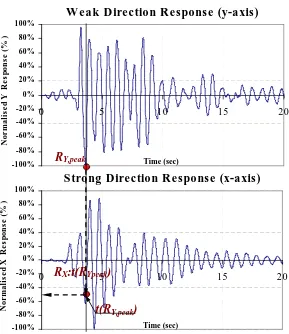
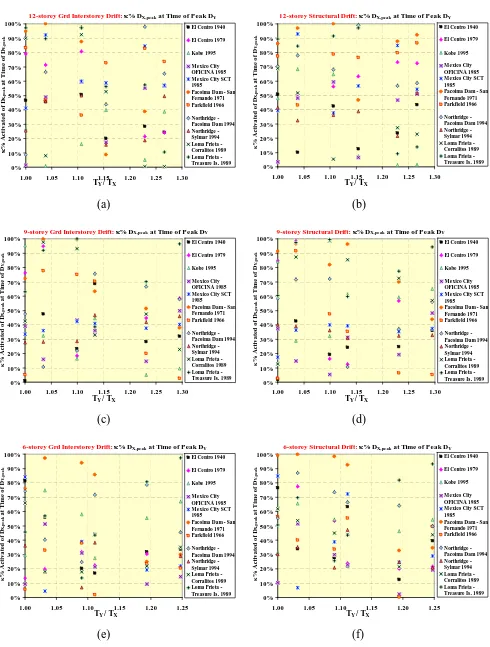
Radial Interstorey Drifts
S TOREYS ’ M AXIMUM R ESPONSE P ROFILES
Structural Maximum Response of Storey Accelerations
Structural Dynamic Magnification factors of Storey Accelerations
Related documents
Based on the findings of this qualitative study and of existing research syntheses [6-8], we developed a web survey to collect cross-sectional data about the specific supports
Vol 9, Issue 6, 2016 Online 2455 3891 Print 0974 2441 INVESTIGATION OF HELICOBACTER PYLORI VIRULENCE GENOTYPE IN GASTRIC BIOPSIES BY POLYMERASE CHAIN REACTION RABAB OMRAN1*, HAIDER ALI M
don’t know – it’s getting better and better in Poland. Take me, I like Poland as it is right now. I can’t tell you for sure, but in the old days everybody was going away to
Similar to Marchand balun, a connecting segment is also needed by the TRD-CL based planar balun in practice, which deteriorates the input match and output balance.. However, in
The result of this study has shown that PRCA are important predictor of communication apprehension in nursing and medical university students and subgroup of
The main aim of this algorithm would be to use a complex unique number, multiplied with a dynamic value that would not repeat itself, to result in a prime number that is checked by
The intermediate component of our stack is a verified implemen- tation of Yao’s secure function evaluation (SFE) protocol [57] based on garbled circuits and oblivious
