Rose, K.; Visser, R.; Guild, B. 1 / 7 Austro2007/FORMEC´07: Meeting the Needs of Tomorrows´ Forests – New Developments in Forest
Engineering, October 7 – 11, 2007, Vienna and Heiligenkreuz – Austria
ANALYSES OF SHIFT PATTERN EFFECT ON PRODUCTIVITY AT THE
KAINGAROA CENTRAL PROCESSING PLANT
Kim Rose
Honors Student, Canterbury University, New Zealand
Rien Visser
Associate Professor, Virginia Tech, Blacksburg, USA
Brent Guild
Sales and Processing Manager, Timberlands, New Zealand
Keywords: Value Recovery, Shift Work, Centralized Processing Plant, Productivity, Forestry
Abstract
A mechanized central processing yard for merchandizing tree length material into logs provides the opportunity for higher levels of mechanization as well as the potential to increase value recovery. Located in the middle of a large contiguous plantation forest area in the central North Island of New Zealand, the Kaingaroa Processing Plant (KPP) processes over 1 million tonnes of Radiata Pine per year into 70 to 80 different log sorts. The plant is run 24 hours per day, 6 days per week.
The stems enter the plant and are scanned for size and shape. Four crews work in 12 hours shifts to control grading and value recovery from the stems. To manage and optimize the process, a comprehensive data collection procedure captures all important data. This database was analyzed to determine the effect of time of day, as well as day of shift on both productivity and value recovery. This paper provides an overview of the KPP operation, discusses shift work implications and presents results from the shift analyses. Example results include a slight but significant increase in productivity in the night time shift compared to daytime, as well a slight but significant decline in value recovery with time into shift.
1. Introduction
There are approximately 1.8 million hectares of production forestry in New Zealand, with approximately 90% being Radiata pine and a further 6% Douglas fir (NZFOA 2006). The Central North Island is the hub of plantation forestry in New Zealand, with about 555,000 hectares of concentrated plantation forests. This includes the 189,000 hectare Kaingaroa forest which is often considered to be the ‘crown jewel’ of plantation forestry, being largely contiguous, on robust pumice soils and good all year round temperature and rainfall resulting in good growth rates (>30 tons/ha/yr.).
Rose, K.; Visser, R.; Guild, B. 2 / 7 Figure 1: Photo showing the ‘output’ end of the KPP with a large number of log sorts.
The concept of using centralized processing yards is to maximize the value recovery efficiency by concentrating the bucking process in one location, as opposed to attempting to at each harvesting site. It allows for greater integration of computerized technology, and a concentration of grading expertise. Bucking the stem into logs is where the greatest value can be lost (Murphy 2003; Haynes and Visser 2004). For the operator, the major advantage of such a processing yard is that they are not subjected to the varying environmental conditions of a harvest landing that can dramatically affect both production and quality (Berglund and Sondell 1985).
From an economic point of view, the benefits of operating a centralized processing yard must overcome the additional costs associated with double handling (cartage of stems into the plant plus the additional cartage of finished product to customer) as well as the capital investment cost associated with the yard (Sunderman 2003). One focus is therefore on achieving a high level of operational efficiency; at the KPP the plant environment is also particularly harsh on equipment and therefore downtime can become a major issue. However, the main emphasis is on the quality of value recovery at the KPP.
Value recovery is the process whereby stems are cut into logs according to predetermined specifications with the objective of obtaining the highest possible value (Conradie 2004; Geert and Twaddle 1984). The plant uses scanning and optimization technology to determine the optimum bucking strategy for each individual stem, with the optimizers taking into account both the most valuable way to cut the stem and the customer orders that require filling. The grading operator has a large role to play as they are assessing and entering stem defects information, while attempting to maintain high levels of production. Although the plant is highly mechanized, the operators ultimately determine production output and quality.
2. Shift Work at KPP
Currently the plant operates 24 hours a day, 6 days a week. There are four crews of five operators who work four days on / four days off constructed of two days shifts followed by two nights. Each shift is 12 hours and dissected into three distinct periods by two scheduled 30 minute stoppages or ‘smoko’. Each crew has five operators who rotate across the tasks associated with the debarker, grading booth, cut-off saws, and chipper booths. This helps to reduce monotony, fatigue, and potentially benefit the health of the operators by reducing the risk of occupational overuse syndrome (Gellerstedt 1997). Potentially, the operators could be assigned to a specific booth to become a machine specialist. For this work routine, the operators at the KPP are generalists not specialists.
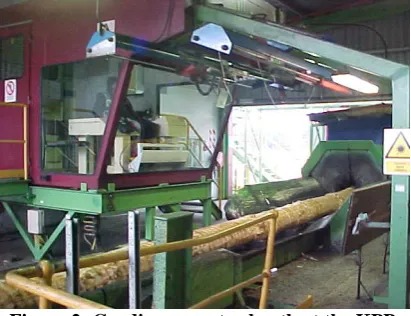
Rose, K.; Visser, R.; Guild, B. 3 / 7 detect these types of elements is crucial to controlling quality. In the case of the KPP, this is the job of the grading operator (Figure 2). Extended shift schedules, such as that implemented at the KPP, have been linked with operator mental fatigue, the consequence of such is a loss in concentration and a decline in value recovery (Kirk 1998; Nicholls et al 2004; Celone 2007).
Figure 2: Grading operator booth at the KPP.
Operator experience is an important factor to consider as each of the operating booths requires a different level of experience. Generally, the grading booth is the constraining part (‘bottle-neck’) on the plant as the grading for defects can be the slowest part of the operation. The most experience operator is therefore often in the grading booth. However, the debarker is at the head of the production line and hence it is important to ensure that the debarker operator provides a constant resource onto the production line at an acceptable pace that does not constrain the production line. Each crew also has a team leader who is responsible for overseeing the crew operations and training operators. There is a natural tension between allocating individuals to specialist roles within the plant versus a ‘bench strengthening’ approach which ensures a stronger team over the longer term.
Shift design and scheduling can potentially affect performance. Studies, such as that by Kirk (1998), have shown that extended shift schedules can lead to operator fatigue and a decrease in production. As a consequence of increasing mental fatigue and discomfort, the operators may compensate by doing one of the two following things (Kirk, 1998):
- If job is production based, then less effort will be spent on quality aspects in order to maintain production levels.
- If quality is the major consideration, increased mental fatigue means the operator must focus harder to achieve the same task. Therefore to perform the same task, more time is required and production is decreased.
These two consequences highlight the need to ensure proper shift design. Often the selection of shift architecture or ‘work schedules’ is subjective due to the lack of information on the complex interactions between productivity, shift length, and worker physical and mental abilities (Golsse 1991; Gellerstedt 1997). Kirk (1998) states that continual use of poorly designed extended shifts have been clearly linked to an increased level on mental fatigue, physical discomfort, and injury. This results in poor operator performance and lower value recovery.
Rose, K.; Visser, R.; Guild, B. 4 / 7 productivity and or low or varying levels of value recovery can help redesign shift work architecture and improve the overall operation of the plant.
3. Objective
The goal of the study is to determine if the shift work impacts operations. Specifically we are looking for possible changes in either productivity or value recovery within shift, between shifts as well as for consecutive days.
4. Methodology
At the KPP, each stem that passes through has a stem detailed file associated with it, including a time stamp. Software captures every decision made by each operator about each log cut from each stem. This data, coupled with the data from the operator booths can be assessed to look at trends in quality and production at both a crew, and individual operator level.
This analysis used data from a six-month period (10th Jan to 30th Jun, 2006) of time, a total of 171 days. This time-frame was chosen because it was free from major alterations to the plant operation and free of any major changes in harvesting strategy. It is felt that using this period would allow for the greatest visibility of the effect of shift pattern on value and productivity.
Using the time stamp, the data was dumped into 30 minute segments to allow for analysis (24 half hour data points per 12 hour shift, including smoko). Over the full period, there are approximately 5250 half an hour segments for analysis, which equates to 55 4-day shifts, and 218 individual 12-hour shifts.
Averages for the following parameters were calculated for each half hourly segment - Average Piece Size (m3)
- Productivity (m3/hr)
- % Pruned (as a % of total recovered value)
Using these parameters, the impact of shift pattern can be assessed by looking for trends in the following
- Between days in shift - Day Vs. Night Shift - Time into shift
The parameters were also assessed for bias with other variables such as piece size to determine whether there are any underlying variables confounding the results. The software package used for the analyses was Jump (SAS1), and all results reported are significant at the p<0.05 level unless otherwise stated.
1
Rose, K.; Visser, R.; Guild, B. 5 / 7 5. Results and Discussion
Note: For commercial sensitivity actual value recovery and %Pruned cannot be reported. For %Pruned we use 100 as being the average and just report the statistical relationship.
General breakdown of data
There were 5253 half hour data sets. Of these, 271 periods (5.2% of the total), characterized by low or no productivity during rest-break (‘smoko’) time periods, were removed from the ‘productive’ data set (1082 stems and 2086 m3). Average productivity in this smoko time was 15 m3/hr, average piece size 1.98 m3. Although a large number of logs sorts are produced, they can be broadly categorized into three groups: High value pruned, (2) Sawlogs and (3) Industrial wood (OSB, pulp and paper).
The following analyses focuses on the remaining 4981 ‘productive’ data points. On average 88.3 stems were processed per hour (471 logs created), with an average piece size of 1.99 m3 to yield a productivity of 175.4 m3/hr. Of the 436,800 m3 processed in this 171 day period. On average, the graders identified 13% more pruned wood than during the slower smoko periods.
For this 171 day period, there was a slow creep in Productivity over time.
Prod(m3/hr) = 172.2 + 0.037 x #Day
Also, a slow creep in %Pruned recovered was found.
%Pruned = 83.5 + 0.129 x #Day
(Note: Being a linear trend, we are reporting a 15% below average recovery of pruned initially,
with a 15% above average recovery at the end of the 6 month study period).
However, most of this can be explained by the increase in Average Piece Size coming through the KPP over time:
AvePieceSize(m3) = 1.97 + 0.000304 x #Day
And as expected, as the average stem size increases, we get a clear increase in %Pruned recovered.
%Pruned = 0.77 + 49.71 x AvePieceSize(m3) (r2 = 0.23)
(Note: once again, the average %Pruned is a nominal value = 100)
As productivity went up, so did the % Pruned recovered.
%Pruned = 55.57 + 0.253 x Prod(m3/hr)
However this relationship may be casual and not causal, as we can expect both an increase in productivity as well as % Pruned with increasing piece size.
The larger the stem, there is a clear increase in #Logs per Stem.
Logs/Stem = 3.55 + 0.90 AvePieceSize(m3) (r2 = 0.35)
Day Trends
Rose, K.; Visser, R.; Guild, B. 6 / 7 piece size was 2.03 m3, while Friday and Saturday were 1.95 and 1.93 m3 respectively. This indicates some level of clean-up occurs towards the end of the week.
Day / Night
On average, Nighttime was more productive than Daytime (177.7 versus 173.6 m3/hr). There was no difference in % Pruned recovery between Night and Day, and no difference in average piece size to explain this.
Time into shift
A slight productivity increase was identified for time into shift (TIS = 0 to 12 hours)
Prod(m3/hr) = 173.8 + 0.276 x TIS(hrs)
However (!), we did find a decrease in %Pruned recovered into shift, but no decrease in average piece size to explain this.
%Pruned = 102.4 – 0.286 x TIS(hrs)
This does indicate that there is an effect of fatigue that impacts value recovery.
6. Conclusions
A large data set containing productivity, quality and shift level was analyzed for the Kaingaroa Processing Plant, near Rotorua, New Zealand. Although interesting trends were established, most were confounded by varying average piece size. Average piece size directly affects productivity and % value recovery. However a few interesting facts did emerge. The nighttime shift is more productive than the daytime, and there was a small but significant decrease in % value recovery with time into shift.
References
Berglund, H. and J. Sondell. 1985. Computerised bucking - one way to increase value of the wood in mechanised logging systems. Skogsarbeten Report NR6 1985. 51pp.
Celone, P. 2007. Double shifting in the Southeast: trials and tribulations of implementation – 2 years later. Southern Region Council on Forest Engineering Meeting, Hot Spring, Arkansas. April 2007.
Conradie I.P; W.D Greene; G.E. Murphy. 2004 Value recovery with harvesters in southeastern U.S. pine stands . Forest Products Journal. 54 (12):80-85
Gellerstedt, 1997. Job-rotation rosters for mechanised operations. Logging Institute Research Organisation. Vol 22 (10).
Geerts, J.M P. and A.A. Twaddle. 1984. A method to assess log value loss caused by cross-cutting practices on the skidsite. New Zealand Journal of Forestry 29(2): 173-184.
Golsee, J.M. 1991. Effects of shift length on hourly productivity: A preliminary review. Canadian Forest Industries.
Haynes, H.J.G. and R.J.M. Visser. 2004. An applied Hardwood Value Recovery Study in the Appalachian Harwood Region of Virginia and West Virginia. Int.J.For.Eng. 14(1):25-31 Kirk, P. 1998, The Impact of Shift Length on Processor Operator Fatigue, Rotorua, N.Z. : Liro
Forestry Solutions Report 23(18).
Rose, K.; Visser, R.; Guild, B. 7 / 7 Murphy, Glen. 2003. Procedures for Scanning Radiata Pine Stem Dimensions and Quality on
Mechanised Processors. Int. J. For. Eng. Vol. 14 No. 2 July 2003
Nicholls, A., L. Bren, and N. Humphreys. 2004. Harvester productivity and operator fatigue: working extended hours. International Journal of Forest Engineering 15(2): 57-65.
NZFOA 2006. New Zealand Forestry Facts and Figures 2005/2006. New Zealand Forest Owners Association, 95 The Terrace, Wellington, New Zealand. 28p.
Stone, I. 1987. The extended workday; Health and Safety Issues. Canadian Centre for Occupational Health and Safety.