Validation of a single camera, spatio-temporal gait analysis
system
DUNN, Marcus <http://orcid.org/0000-0003-3368-8131>, HAAKE, Steve
<http://orcid.org/0000-0002-4449-6680>, WHEAT, Jonathan
<http://orcid.org/0000-0002-1107-6452> and GOODWILL, Simon
<http://orcid.org/0000-0003-0638-911X>
Available from Sheffield Hallam University Research Archive (SHURA) at:
http://shura.shu.ac.uk/8201/
This document is the author deposited version. You are advised to consult the
publisher's version if you wish to cite from it.
Published version
DUNN, Marcus, HAAKE, Steve, WHEAT, Jonathan and GOODWILL, Simon (2014).
Validation of a single camera, spatio-temporal gait analysis system. Procedia
Engineering, 72, 243-248.
Copyright and re-use policy
See
http://shura.shu.ac.uk/information.html
Procedia Engineering 72 ( 2014 ) 243 – 248
1877-7058 © 2014 Elsevier Ltd. This is an open access article under the CC BY-NC-ND license (http://creativecommons.org/licenses/by-nc-nd/3.0/).
Selection and peer-review under responsibility of the Centre for Sports Engineering Research, Sheffield Hallam University doi: 10.1016/j.proeng.2014.06.043
ScienceDirect
The 2014 conference of the International Sports Engineering Association
Validation of a single camera, spatio-temporal gait analysis system
Marcus Dunn*, Steve Haake, Jon Wheat and Simon Goodwill
Centre for Sports Engineering Research (CSER), Sheffield Hallam University, Collegiate Crescent Campus, Sheffield, S10 2BP, UK.
Abstract
The measurement of foot-surface contact position would aid the understanding of player movement and step strategy in sports such as tennis. However during competition, it is impracticable to instrument players. A markerless, view-independent, foot-surface contact identification (FSCi) system was developed and validated. The FSCi system analysed standard colour video sequences of walking and running (barefoot and shod) from four unique camera perspectives; output data were compared to three-dimensional motion analysis. Results demonstrated that data for 99.6% of foot contacts (all camera perspectives) were identified. The calculation of gait variables, i.e. step length etc., was performed automatically for 91.3% of foot contact data; 8.7% of data required manual intervention for analysis. Resultant direction root-mean square error (RMSE) for foot contact position was 52.1 and 52.2 mm for barefoot and shod walking respectively. Resultant direction RMSE for foot contact position during running was 91.4 and 103.4 mm for barefoot and shod conditions respectively. The FSCi system measured basic gait parameters of walking and running without interfering with the activity being observed. The system represents a flexible approach which could be used for in situ gait analysis. The FSCi system could be used for gait analysis in competitive tennis however performance of the system when applied to larger filming areas, e.g. tennis courts, must be evaluated.
© 2014 The Authors. Published by Elsevier Ltd.
Selection and peer-review under responsibility of the Centre for Sports Engineering Research, Sheffield Hallam University.
Keywords: Foot contact; measurement; markerless; view-independent; tennis
* Corresponding author. Tel.: +44-114-225-2255; fax: +44-114-225-4356.
E-mail address: [email protected]
© 2014 Elsevier Ltd. This is an open access article under the CC BY-NC-ND license (http://creativecommons.org/licenses/by-nc-nd/3.0/).
244 Marcus Dunn et al. / Procedia Engineering 72 ( 2014 ) 243 – 248
1.INTRODUCTION
Current knowledge of tennis player-surface interaction is limited (Miller, 2006). Identifying player movements - i.e. gait strategy - during competitive tennis is an important step in understanding player-surface interactions. However, it is currently impracticable to instrument tennis players during competition. Therefore a non-invasive, video-based method for identifying foot contacts during competitive tennis would be advantageous.
Previous work quantifying tennis player movement and gait strategy during competitive tennis has been performed. Dunn et al. (2011) recorded high-definition video footage of competitive tennis rallies at the 2011 Roland Garros Qualifying Tournament in Paris. Forty tennis rallies, the equivalent of 18000 video frames, were manually digitised using simplified movement definitions. Dunn et al. (2011) highlighted gender differences for forehand manoeuvre step frequency; however findings were limited due to a low sample size and movement definitions. An automatic, video-based method for identifying foot contacts was required.
Bouchrika and Nixon (2006) presented a method for identifying heel-strikes from video. The authors reported identification accuracy of 0.52% of participant height; however analyses were limited to straight line walking and temporal information was removed. Jung and Nixon (2013) presented a single camera method for identifying heel-strikes for straight and random direction walking. Jung and Nixon (2013) reported that their method identified 95.6% of heel-strikes within ± 100 mm of ground truth data. However, Jung and Nixon's (2013) method was dependent on walking gait as head trajectory was used to identify heel-strike video frames. Methods presented by Bouchrika and Nixon (2006) and Jung and Nixon (2013) were therefore unlikely to be applicable to tennis due to variation in gait mode and player-camera orientation. Furthermore, step parameters, e.g. step length and step time, were not quantified. Research identifying foot contacts with a single camera is limited. To the author's knowledge, no single camera method has identified foot contacts in walking and running to quantify step parameters without using markers.
The FSCi system was designed to automatically identify foot contacts without markers from single camera image sequences. Furthermore, the FSCi system can analyse walking and running image sequences obtained from different camera perspectives: images are analysed in 0.87 ± 0.05 s per image. The aim of this study was to validate the FSCi system using three-dimensional motion analysis.
2.METHOD
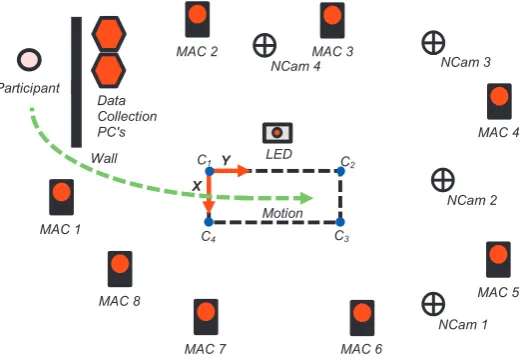
Six male participants (age = 27.9 ± 2.9 years; stature = 1.85 ± 0.05 m; mass = 77.6 ± 8.2 kg) were recruited. Participants were appropriately briefed to aid the completion of the proposed tasks and written informed consent was obtained. Approval for all procedures was obtained from the Research Ethics Committee of the Faculty of Health and Wellbeing, Sheffield Hallam University. Participants were asked to walk and run at a self-selected pace through a motion capture volume within a carpeted laboratory (Figure 1). Participants were asked to perform three repetitions of these tasks in barefoot and shod (own trainers).
Seven spherical, retro-reflective markers (12.5 mm diameter) were affixed to palpable anatomical landmarks: one marker was placed on the sacrum and three markers were placed on the heel, 2nd and 5th meta-tarsal heads of
Figure 1. Schematic of the experimental setup: dashed black rectangle represents the motion capture volume and defines the common coordinate system.
The motion capture system was triggered to record with an external 5V pulse (push button trigger). The same pulse was amplified (12V) to illuminate an LED light box (Figure 1). Four networked cameras (AXIS M1104, AxisTMCommunications, Sweden) streamed RGB colour images (1280 × 720 pixels) to a dedicated data collection computer at 25 Hz. Sagittal, frontal and two oblique frontal perspective images of all trials were recorded, i.e. NCam 1 - 4 (Figure 1). Following the positioning of network cameras, camera field-of-view and focal length were set manually and locked: no further alterations to intrinsic camera parameters were made. The LED light box was positioned in each network camera's field-of-view to provide a time reference.
Four spherical retro-reflective markers (25 mm diameter) were positioned on the floor at the corners of the motion capture volume, defining a reference plane and common coordinate system, i.e. C1 - C4 (Figure 1). Marker locations were measured using the motion capture system to minimise positioning error and help ensure orthogonality: marker position residuals were 0.92 ± 0.42 mm. Single camera calibration was performed for each network camera. Intrinsic camera parameters were calculated by filming a 6 × 6 checkerboard of 25 mm squares held in different positions and orientations relative to the camera. Checkerboard corners were extracted and processed using the Camera Calibration Toolbox for Matlab (Bouguet, 2010). A single image from each network camera was used to manually digitise markers C1 - C4 (Figure 1) at a sub-pixel resolution. Marker coordinates ZHUHGLJLWLVHGRQILYHRFFDVLRQVVWDQGDUGHUURURIWKHPHDQZDVSL[HOVIRUDOOmarker coordinates. The mean marker coordinates were used to calculate extrinsic camera parameters for each network camera. Planar position reconstruction was performed as described by Dunn et al. (2012) to identify real-world foot contact position.
Dunn et al. (2011) demonstrated the use of an elevated reconstruction plane to reconstruct out-of-plane image coordinates. FSCi position estimates (FSCiXYT) were reconstructed using an elevated reconstruction plane as well
as the reference plane (Figure 1). The elevated reconstruction plane corresponded to the reference plane but was elevated by 29 and 35 mm for barefoot and shod conditions respectively. Reconstruction plane elevation was determined following a pilot study that identified the plane elevation that yields the minimum reconstruction error for barefoot and shod foot contact position. Foot contact data measured by three-dimensional motion analysis and the FSCi system, i.e. MACXYT and FSCiXYT respectively, were reported in the common coordinate system to enable
comparison (Figure 1). For individual foot contacts, the number of foot contacts (n) and foot contact position (mm) were quantified. For a sequence of foot contacts, step length (mm) and step time (s) were quantified. Step length and step time were defined as the absolute difference between contralateral foot contact location and time respectively. Agreement was assessed using Bland and Altman 95% limits of agreement (LOA). In the case of heteroscedastic data distribution, i.e. |r2| 0.1, ratio LOA (dimensionless) was also reported. Furthermore, root-mean square error (RMSE) was calculated with the following:
C1
X
C1 Y
NCam 4 NCam 3
NCam 2
NCam 1 Data
Collection PC's
Wall Participant
Motion MAC 1
MAC 2
4 MAC 3
MAC 4
MAC 5
MAC 6 MAC 7
MAC 8
LED C2
246 Marcus Dunn et al. / Procedia Engineering 72 ( 2014 ) 243 – 248
ܴܯܵܧ= ඥσேୀଵ(ܺோെ ܺ)ଶ / ܰ (1)
where XiRis the criterion, Xir is the estimate and N is the number of data points.
3.Results
Mean resultant direction velocity (coronal plane) was 1.42 ± 0.11 and 3.03 ± 0.52 m·s-1 for walking and running respectively. Four camera perspectives meant that the FSCi system was passed 288 image sequences containing a total of 1248 foot contacts. The FSCi system identified data for 1243 of 1248 (99.6%) foot contacts. Furthermore, step analysis was performed automatically for 263 image sequences (91.3%); 25 image sequences (8.7%) required manual intervention for step analysis. For seven image sequences, 93 data points (0.5%) were manually removed. For 20 image sequences, the correct number of foot contacts was manually identified to cluster foot contact data (two image sequences required both operations).
Table 1. RMSE (mm) for all FSCi estimates (n = 1243) in X, Y and resultant (R) directions. Reference plane Elevated plane
X Y R X Y R
RMSE (mm) 72.0 67.4 98.6 29.7 67.1 73.4
RMSE for foot contact position (all camera perspectives) was lower when FSCi system data were reconstructed using an elevated plane (Table 1). Therefore all FSCiXYT data presented hereafter were reconstructed using an
[image:5.544.54.484.346.518.2]elevated reconstruction plane.
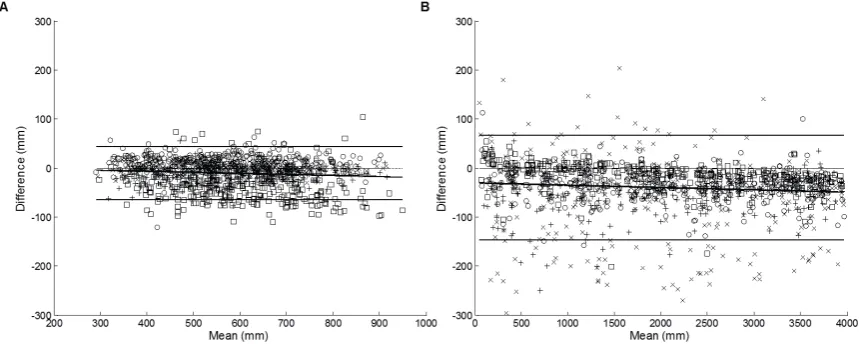
Figure 2. Absolute LOA for all foot contact data (n = 1243) in the X and Y directions (A and B respectively). Pluses, crosses, circles and squares identify network cameras 1 - 4 respectively.
Figure 2 presents absolute LOA for all foot contact position data: pluses, crosses, circles and squares identify network camera perspectives 1 – 4 respectively. X and Y direction differences did not increase in relation to mean values, i.e. |r2| < 0.1, therefore data distributions were homoscedastic. For all camera perspectives, 95% LOA were í10.3 ± 54.7 and í39.7 ± 106.1 mm for X and Y directions respectively (Figure 2).
Table 2. Resultant direction RMSE (mm) for barefoot and shod foot contacts during walking and running. Walking
(n)
Running
(n)
(391) (251)
Shod (363) 52.2 103.4 (238)
Resultant direction RMSE (RMSER) was greater for running foot contacts than walking foot contacts (Table 2).
RMSER for shod and barefoot walking foot contacts was similar; however foot contact RMSER was 12 mm greater
[image:6.544.123.422.169.296.2]for shod running when compared to barefoot running (Table 2).
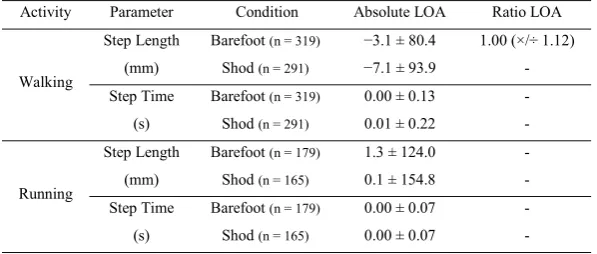
Table 3. LOA (absolute and ratio) for step length and step time during walking and running (barefoot and shod). Activity Parameter Condition Absolute LOA Ratio LOA
Walking
Step Length (mm)
Barefoot (n = 319) í3.1 ± 80.4 1.00 (×/÷ 1.12) Shod (n = 291) í7.1 ± 93.9 - Step Time
(s)
Barefoot (n = 319) 0.00 ± 0.13 - Shod (n = 291) 0.01 ± 0.22 -
Running
Step Length Barefoot (n = 179) 1.3 ± 124.0 - (mm) Shod (n = 165) 0.1 ± 154.8 - Step Time Barefoot (n = 179) 0.00 ± 0.07 - (s) Shod (n = 165) 0.00 ± 0.07 -
Barefoot walking step length differences were heteroscedastic (|r2| = 0.13). Ratio LOA indicated that 95% of
ratios were between 11% of the mean ratio (Table 3). Heteroscedastic step length data for barefoot walking was the result of a single outlier: its removal yields |r2| = 0.04. Absolute LOA for shod walking indicated that step length
HVWLPDWHVZHUHV\VWHPDWLFDOO\VKRUWHUíPP); 95% of estimates were between ± 93.9 mm of the mean (Table
5XQQLQJ VWHS OHQJWK HVWLPDWHV EDUHIRRW DQG VKRG ZHUH VLPLODU V\VWHPDWLF GLIIHUHQFHV ZHUH PP
However 95% of estimates were between ± 124.0 and ± 154.8 mm of the mean for barefoot and shod running respectively (Table 3). Step time estimates for both walking and running were similar: absolute LOA indicated a systematic difference for shod walking step time of 0.01 s. However 95% of walking step time estimates were between ± 0.13 and ± 0.22 s of the mean for barefoot and shod walking respectively (Table 3). For running, 95% of step time estimates (barefoot and shod) were between ± 0.07 s of the mean.
4.DISCUSSION
Existing single camera algorithms that identify heel-strikes during walking have reported identification rates of 99.2% (Bouchrika and Nixon, 2006) and 95.6% (Jung and Nixon, 2013). However such methods have only been applied to walking and do not quantify step parameters. The FSCi system automatically identified data for 99.6% of foot contacts for walking and running. View-independent estimates for foot contact position, e.g. Figure 2, highlight that the FSCi system identified a video feature of walking and running rather than a view-dependent feature, e.g. marker. Error intervals for X and Y foot contact position were í10.3 ± 54.7 and í39.7 ± 106.1 mm respectively. Foot contacts identified by the FSCi system were systematically different to criterion foot contact locations, e.g. heel and 2nd meta-tarsal head midpoint. Larger error intervals observed in the Y direction correspond
to the direction of motion, e.g. Figure 1. Further, foot contact position errors were greater for running trials (Table 2). Greater position errors during running might reflect variation in foot contact type, i.e. forefoot contacts. The FSCi system would be sensitive to changes in foot contact type however criterion data would not. Criterion data do not support the analysis of foot contact type; thus future assessments should consider centre-of-pressure as a criterion measure. The markerless identification of foot contact position in walking and running represents an important contribution to pattern recognition in sport. However current data were measured in an area equal to 6 m2. Position errors are likely to increase when filming larger areas, e.g. tennis courts. Further research must
248 Marcus Dunn et al. / Procedia Engineering 72 ( 2014 ) 243 – 248
Step analysis was performed automatically for 91.3% of foot contact data. Manual interventions to cluster foot contact data were predominantly performed for frontal perspective data (80%) and reflect challenges of identifying foot contacts from frontal perspectives (Jung and Nixon, 2013). Current data indicate that the maximum random error component for FSCi system step length estimates was 101.0 and 154.9 mm for walking and running respectively. Furthermore, the maximum random error component for walking and running step time estimates was 0.23 and 0.07 s respectively. When validating the GAITRite® walkway (commercial system), Webster, Wittwer
and Feller (2005) reported maximum random error components of 25.1 mm and 0.04 s for step length and step time. Current data do not support the FSCi system as a physical walkway replacement. However findings should be interpreted with regard to the flexibility of the system. The FSCi system measured basic gait parameters of walking and running without interfering with the activity being observed. The system could be applied to environments where walkway or conventional motion analysis is not appropriate. Furthermore, current data were measured using colour images streamed from individual web cameras at 25 Hz. Therefore different image resolution, sampling frequency and lens systems might improve system accuracy for different applications.
5.CONCLUSION
Using standard colour images the FSCi system measured basic gait parameters of walking and running without interfering with the activity being observed. The FSCi system represents a flexible approach which could be used for in situ gait analysis. The FSCi system could be used for gait analysis in competitive tennis however performance of the system when applied to larger filming areas, e.g. tennis courts, must be evaluated. Finally, the FSCi system could be used for different applications, ranging from sport to surveillance.
Acknowledgements
This research was part-funded by the International Tennis Federation, Roehampton, UK.
References
Bouchrika, I., Nixon. M. S., 2006. Markerless feature extraction for gait analysis. In IEEE SMC Conference on Advances in Cybernetic Systems, pp. 55 - 61.
Bouguet, J. Y., 2010. Camera Calibration Toolbox for Matlab [online]. Available: http://www.vision.caltech.edu/bouguetj/calib_doc/ [Accessed 10 October, 2010].
Dunn, M., Wheat, J., Haake, S., Goodwill, S., 2011. Assessing tennis player interactions with tennis courts. In Vilas-Boas, J.P., Machado, L., Kim, W., Veloso., A.P. (Eds.), Proceedings of the 29th International Conference on Biomechanics in Sports, pp. 859 - 862.
Dunn, M., Wheat, J., Miller, S., Haake, S., Goodwill, S., 2012. Reconstructing 2D planar coordinates using linear and non-linear techniques. In Bradshaw E.J., Burnett, A., Hume, P.A. (Eds.), Proceedings of the 30th International Conference on Biomechanics in Sports, pp. 381 - 383.
Jung, S-U., Nixon, M. S., 2013. Heel strike detection based on human walking movement for surveillance analysis. Pattern Recognition Letters 34, 895 - 902.
Miller, S., 2006. Modern tennis rackets, balls and surfaces. British Journal of Sports Medicine 40, 401 - 405.
O'Connor, C. M., Thopre, S. K., O'Malley, M. J., Vaughan, C. L., 2007. Automatic detection of gait events using kinematic data. Gait & Posture 25, 469 - 474.
Queen, R. M., Gross, M. T., Liu, H-Y., 2006. Repeatability of lower extremity kinetics and kinematics for standardized and self-selected running speeds. Gait & Posture 23, 282 - 287.
Webster, K.E., Wittwer, J.E., Feller, J.A., 2005. Validity of the GAITRite® walkway system for the measurement of averaged and individual