Elsevier Editorial System(tm) for Journal of Magnetic Resonance
Manuscript Draft
Manuscript Number: JMR-15-265R2
Title: 11-interval PFG pulse sequence for improved measurement of fast velocities of fluids with high diffusivity in systems with short T2* Article Type: Article
Keywords: flow NMR; pulsed field gradients; granular materials; pulse sequences
Corresponding Author: Dr. Christopher M. Boyce,
Corresponding Author's Institution: Princeton University First Author: Christopher M. Boyce
Order of Authors: Christopher M. Boyce; Nicholas P Rice; Andrew J Sederman; John S Dennis; Daniel J Holland
Abstract: Magnetic resonance (MR) was used to measure SF6 gas velocities in beds filled with particles of 1.1 mm and 0.5 mm in diameter. Four pulse sequences were tested: a traditional spin echo pulse sequence, the 9-interval and 13-interval pulse sequence of Cotts et al. (1989) and a newly developed 11-interval pulse sequence. All pulse sequences measured gas velocity accurately in the region above the particles at the highest velocities that could be achieved (up to 0.1 m s-1). The spin echo pulse sequence was unable to measure gas velocity accurately in the bed of particles, due to effects of background gradients, diffusivity and acceleration in flow around particles. The 9- and 13-interval pulse sequence measured gas velocity accurately at low flow rates through the particles (expected velocity < 0.06 m s-1), but could not measure
velocity accurately at higher flow rates. The newly developed 11-interval pulse sequence was more accurate than the 9- and 13-interval pulse
October 14, 2015 Dear Editor,
Please would you consider the attached paper, entitled “11-interval PFG pulse sequence for accurate measurement of gas velocity in granular materials” for publication in Journal of Magnetic Resonance? It is an original paper, which has not been published or submitted for publication in any other journal. The paper describes a new pulse sequence we have developed to accurately measure gas velocity in heterogeneous systems such as granular materials and porous media. The paper demonstrates that the new pulse sequence, which builds on the framework of the landmark work by Cotts et al. (1989), measures gas velocity more accurately in packed beds of particles than the pulse sequences from this previous work as well as a standard spin echo pulse sequence. The key development of this new pulse sequence comes from using a double spin echo segment on each side of a z-storage period, in order to significantly reduce the echo time necessary to allow for flow encoding gradients with finite ramping time. By providing a variety of comparisons varying pulse sequences and echo times while measuring signal intensity and velocity, the paper concludes that the increased accuracy of the measurements comes from the reduced echo time, which reduces selective signal attenuation from fast moving nuclei.
This new pulse sequence enables gas phase velocity imaging in fluidized beds. We also anticipate that the pulse sequence described here will be advantageous in other systems in which background gradients caused by heterogeneity in the sample may be prominent. Thus, we expect the technique to have immediate application to studying flows in porous media, such as rock cores.
Yours sincerely,
Highlights:
New 11-interval PFG pulse sequence introduced
New pulse sequence measures gas velocity more accurately in bed of particles than spin echo, 9- and 13-interval pulse sequences
Better performance due mainly to reduction in echo time, reducing selective attenuation of fastest moving signal
Reviewer #1: This revised manuscript is an improvement over the original submission; it is definitely easier to read. However, I feel that some of my misgivings were not understood so I hope to recast the ones that remain.
The manuscript can be published after these additional revisions.
One of my earlier objections remains. The conclusion that their 11-interval pulse sequence is better than the other three sequences considered is still described in qualitative terms, starting in the abstract. The lack of quantification conflicts with statements that this experiment will provide quantitative measurements of gas flow in fluidized beds. Gas flow velocities are given but not in terms of the overall parameter space. Readers would be hard put to use these results without a complete set of parameters. This work shows that the accuracy of all the methods fail at high enough flow velocity (not quantitative) so what is important is to learn in which part of the parameter space the conclusion is valid and how much better the new sequence is compared to other methods. More quantitative statements were added in the conclusion section but most passages are still in general terms.
We agree with the reviewer that a limitation of this paper is that we have been unable to present a fully quantitative explanation as to when the pulse sequences fail; however, we have demonstrated that the proposed sequence is better than other methods that have been published (i.e. it retains a high accuracy to higher velocities). Although it would be preferable to fully characterize a dimensionless parameter space, the number of parameters makes this space unrealistically large to measure for the scope of this paper. Physics from fluid mechanics and magnetic resonance must be combined to fully characterize the parameter space outside which the pulse sequences fail via dimensional analysis. The Reynolds number (Re) is clearly important, as the reviewer mentions below. The Péclet number (Pé), incorporating the relative importance of diffusivity, is also likely important as previous studies using liquids in which the diffusivity is lower have not been found to require as short a tau as we found with the gases studied here. Neither of these parameters (Re, Pé) account for the magnetic susceptibility though, which would clearly be another parameter of importance. Further parameters that are potentially relevant but not represented in Re, Pé or the magnetic susceptibility include the voidage and particle shape information, as well as observation time and echo time. As a result, we have not been able to determine fully dimensionless relationships from the results to be able to instruct readers on the exact parameter space in which they could expect the pulse sequences to be accurate in all possible flow systems. This is certainly an area that warrants further investigation, but it was not within the scope of this study to exhaustively study all possible flow systems.
Instead, we have tried to show the level of accuracy that we have attained over a range of parameters (which are detailed in the tables) and that these levels of accuracy are greater than those attained using other previously published methods. The plots in the paper along with tables describing the parameters studied clearly show the level of accuracy of the measurements within the range of parameters studied. This visualization is aided by text in the Results and Discussion sections, including a discussion, albeit qualitative, about when we think this sequence will be of benefit. We leave it to the reader to use the information to apply the new pulse sequence to other flow systems.
We take the point that the measurements are not completely quantitatively accurate at the highest flow rates studied here. Thus, we have changed “accurate” to “improved” in cases where it may be misinterpreted as being completely quantitatively accurate.
Sorry to keep beating on this but statements such as "All pulse sequences measured gas velocity accurately in the region above the particles" are incomplete without information about the gas velocity, particle size, etc., as well as for what set of parameters the statement is true. If the specific conditions are not stated, a phrase could be added to state that the statement holds for the conditions used in this work, implying that these conclusions may not hold in other parts of the phase space, e.g., faster velocity or smaller particles.
We have added information on the gas velocities measured to the abstract. It is not possible to give full details of all of the parameters used in this paper in the abstract, but these details are included in the main text.
could give the wrong idea that the new pulse sequence was completely quantitatively accurate at all flow rates.
The fact that velocity differences are now plotted in Figs. 5-10 is helpful.
The discussion in terms of the highest velocity used in the experiment is not very general. Why not state the results in terms of parameters such as Reynolds number? It was stated in the earlier version that the fastest gas velocity was limited by the formation of bubbles. That at least gave us an idea of the gas flow rate in terms of Reynolds number but it was removed in the revision. Why?
The fastest gas velocity which can be measured quantitatively by the various pulse sequences is not necessarily given by the Reynolds number, and thus it would be misleading to present it as such. The Reynolds number does not directly account for the diffusivity of the gas, its acceleration in moving around obstacles or the magnitude of inhomogeneities in the magnetic field, all of which could be expected to affect the range of accuracy for the measurements.
We state that the gas velocities were kept below velocities at which bubbling occurred (Section 2.1) and that in a bubbling fluidized bed, the fastest gas velocities through the interstices between particles would be expected to be comparable to those at the fastest flow rate studied here (Section 4).
I may be missed it somewhere in the text but could not find the pulse sequence parameters for the 9-interval sequence results in Fig. 6.
These parameters are the same as for the 13-interval. This has been corrected in the updated version.
It is mentioned early in Section 4 that "It proved more difficult to measure velocity accurately in the bed of particles…" as if this was a new discovery. I suggest changing the wording.
This has been changed to “As expected, it proved more difficult…” to clarify any ambiguity.
The next-to-last paragraph of the same section is where I'd like to see mention of specific velocities at which "accurate" measurements can be made or not made.
We have changed this paragraph as follows to address this comment:
“The measurements shown here demonstrate that accurate velocities can be measured using the 11-interval pulse sequence for dp = 1.1 mm particles, with quantitatively accurate measurements up to expected velocities of 0.1 m s-1
and significantly improved measurements for expected velocities greater than 0.1 m s-1. However, it could be expected that measurements would not be as accurate in beds of smaller particles, which are also of interest in gas-solid fluidization research. Previous measurements showed that accurate measurements could be obtained using a spin echo pulse sequence for beds containing particles of dp = 5 mm [17,18]. However, the spin echo pulse sequence was not accurate when used to measure velocity in the bed of dp = 1.1 mm particles here. However, Figure 10 (a) shows that the 11-interval pulse sequence also measured gas velocity accurately in a bed of dp = 0.5 mm particles for expected velocities up to 0.09 m s-1 and with significant improvements in accuracy over the 13-interval pulse sequence for gas velocities greater than 0.09 m s-1. Additionally, smaller beds of particles reach minimum fluidization and bubbling conditions at lower velocities than do larger beds of particles, reducing the maximum value of expected velocity at which gas velocity needs to be measured in order to measure gas velocity under fluidized conditions. Since the 11-interval pulse sequence becomes less accurate with increasing expected gas velocity through packed beds of particles, it is possible that the pulse sequence could be even more accurate at measuring gas velocities in bubbling beds of smaller particles. It remains an area of future research to explore the accuracy of the 11-interval pulse sequence for beds with dp < 0.5 mm.”
January 13
th, 2015
11-interval PFG pulse sequence for
accurate improved
measurement of fast velocities of fluids with high diffusivity in
systems with short
T
2*C. M. Boyce§†, N. P. Rice, A. J. Sederman, J. S. Dennis, D. J. Holland‡
Department of Chemical Engineering and Biotechnology, University of Cambridge, New Museums Site, Pembroke Street, Cambridge CB2 3RA, UK.
.
(§) Corresponding author. Email: [email protected]. Tel: +1-646-255-4807
(†) Current address: Department of Chemical and Biological Engineering, Princeton University, Princeton, NJ 08544
Abstract
Magnetic resonance (MR) was used to measure SF6 gas velocities in beds filled with particles of
1.1 mm and 0.5 mm in diameter. Four pulse sequences were tested: a traditional spin echo pulse sequence, the 9-interval and 13-interval pulse sequence of Cotts et al. (1989) and a newly developed 11-interval pulse sequence. All pulse sequences measured gas velocity accurately in the region above the particles at the highest velocities that could be achieved (up to 0.1 m s-1). The spin echo pulse sequence was unable to measure gas velocity accurately in the bed of particles, due to effects of background gradients, diffusivity and acceleration in flow around particles. The 9- and 13-interval pulse sequence measured gas velocity accurately at low flow rates through the particles (expected velocity < 0.06 m s-1), but could not measure velocity accurately at higher flow rates. The newly developed 11-interval pulse sequence was more accurate than the 9- and 13-interval pulse sequences at higher flow rates, but for velocities in excess of 0.1 m s-1 the measured velocity was lower than the expected velocity. The increased accuracy is arose from was because of the smaller echo time that the new pulse sequence it
enabled, reducing selective attenuation of signal from faster moving nuclei.
1. Introduction
Magnetic resonance (MR) has proven a powerful technique for measuring liquid flows in porous media, granular material and other heterogeneous systems [1–3], from measuring liquid flows through packed beds of glass beads [4] to quantifying water diffusion in biological tissue [5]. Measurements of fluid flow are more difficult in heterogeneous media than single phase systems because (a) the signal density from the fluid is lower, (b) flow through tortuous pathways increases the acceleration and dispersion of fluid, leading to difficulties in measuring coherent motion and (c) differences in magnetic susceptibility between the fluid and particles create background gradients which lead to signal decay and shorten relaxation times. Issue (c) in particular is well known for causing problems with accurate quantification of flow phenomena. Cotts et al. [6] have defined the theoretical basis of issue (c) and have developed pulse sequences to minimise their effects. The pulse sequences of Cotts et al. have since been used to enable more accurate measurements in a variety of systems (e.g. [7–11]). However, even with sequences derived from the approach of Cotts et al., quantitative velocity measurements of fast flow through porous material can be challenging [12]. The major challenge with quantitative velocity measurements in these systems is the strong dependence on the echo spacing, . Here we develop quantitative velocity measurements of gas flow through a bed of particles. This measurement technique will be used to provide quantitative measurements of gas flow in fluidized beds.
In fluidized beds, MR has been used to measure bubble dynamics [13], particle velocity and granular temperature [14], providing key insights on the complex dynamics of fluidization. However, without previous measurements of gas dynamics in beds of fluidized particles using MR or other experimental techniques, it has been difficult to shed light experimentally on many key concepts and theories in fluidization.
MR is desirable as compared to other experimental techniques for measuring gas velocities because MR can measure gas velocities directly and quantitatively in opaque, multi-phase systems which are 3D in geometry. However, three main issues make MR velocity measurements of gas more difficult than those of liquid: (1) low signal density from nuclei in the gas phase, (2) fast diffusion of the gas, making it more difficult to measure coherent motion of gas and (3) short relaxation times of molecules in the gas phase.
With increased expertise in quantifying flow phenomena using MR, there has recently been an effort to make difficult measurements in complex flows. These measurements, and the techniques associated with them, have been reviewed by Gladden and Sederman [15]. With respect to measuring velocities in a flowing gas, Newling and co-workers [16] were able to measure velocities in highly turbulent conditions at up to 50 m s-1. In fixed beds, measurements of gas velocities through particles 5 mm in diameter have also been achieved [17,18]. For these measurements, thermally-polarised sulphur hexafluoride (SF6) was used to receive MR signal
The present research is concerned with MR techniques allowing for the measurement of time-averaged SF6 velocities in a bed filled separately with two sets of small particles (dp = 1.1 mm,
0.5 mm) under packed and fluidized conditions. The MR characteristics of SF6 limit the types of
MR techniques which can be used to measure its velocity, especially when flowing at high velocities and amongst particles. These limitations come from signal degradation due to short relaxation times, background gradients formed at the interface with particles and the need for long observation times (Δ) to minimise the effects of diffusive flow, dispersion and acceleration. A new, 11-interval pulse sequence based on the principles of the pulse sequences introduced by Cotts et al. [6] was developed to measure gas velocity; the accuracy of these measurements was compared to that from measurements using existing pulse sequences.
2. Experimental
2.1 Bed of particles
Gas velocity measurements were conducted in the bed of particles as well as the region above the particles (open pipe) in a fluidized bed. Details of the fluidized bed are summarised in Table 1. The bed had an internal diameter, Dbed = 52 mm filled with poppy seeds to a tapped bed height,
H0 = 100 mm. Two sets of poppy seeds were used, one with diameter dp = 1.1 mm and a second
with dp = 0.5 mm. Different sizes of poppy seeds were used, since it was expected that it would be more difficult to measure gas velocity accurately in beds of smaller particles as the length scale associated with changes in the magnetic field is closely linked to the particle size, as described further in Section 2.3. The bed was fluidized using sulphur hexafluoride (SF6) gas,
which gives an MR signal arising from 19F nuclei. The gas was kept at 7.5 barg in the bed in order to increase the MR signal from it, as well as increase its relaxation times. With the temperature of the SF6 controlled at 25 ± 3°C, its density was 56 kg m-3 and its viscosity was
approximately 1.6 10-5 Pas. The gas flow rate was controlled using a Bronkhorst F-113AC-M50-AAD-55-E mass flow controller. Experiments were conducted at a variety of different flow rates in order to investigate the relationship between measured velocity and expected velocity when using different pulse sequences. The flow rates were kept below values at which “bubbles” of gas void of particles rose through the particles, so that it would be easy to assess the expected velocity because there would not be issues with temporally variant velocities or difficulties in assessing the solids packing fraction in the bed. A porous plate distributor approximately 50 mm in diameter made of 250 μm sintered bronze was used for even distribution of gas at the inlet to the fluidized bed. The gas feed to the bed was located 300 mm below the distributor. The region between the gas feed and the distributor was filled with glass beads 2 mm in diameter in order to further ensure the even distribution of gas. The pressure drop across the distributor and glass beads was measured to be 10 mbar, ensuring even flow of gas at the inlet. The bed was made from a PVC pipe.
2.2 MRI arrangement
MRI measurements were conducted using a Bruker DMX 200 spectrometer with a magnetic field strength of 4.7 T. The magnet was operated at a proton (1H) frequency of 199.7 MHz to measure signal from the oil in the poppy seeds and a 19F frequency of 187.9 MHz to measure signal from the SF6 gas. This separation of frequencies allowed signal from the particles and gas
tuning to either the 1H or the 19F frequency) with an inner diameter of 64 mm was situated around the fluidized bed to excite and detect signal from the seeds and gas. A shielded 3-axis gradient set capable of producing a maximum gradient of 0.139 T m-1 was used for imaging and velocimetry purposes.
The relaxation times for the poppy seeds and SF6 gas were measured in order to determine
repetition times for successive scans of MRI experiments. These times are shown in Table 2. The repetition times were chosen as 3-5 times T1, so as to allow the net magnetisation to return
almost completely to the vertical (z) axis before the next excitation. The B0 field homogeneity
was poor (3 ppm at 10% of the peak height) due to limited shimming capabilities, as well as background gradients due to the difference in the magnetic susceptibility of the particles and the gas. Therefore, the T2* for the oil in the particles and the gas was short (< 1 ms).
2.3 Velocity measurement details
Background gradients were expected to affect the accuracy of the gas velocity measurements. Thus, a variety of pulse sequences were used, in order to test the ability of each to measure gas velocity accurately in the fluidized bed. Each pulse sequence used involved a bipolar pair of flow encoding gradients to measure velocity or velocity distribution using the phase contrast method [20]. For slice selection in the z-direction, a Gaussian refocusing pulse was used at the same time as a slice gradient in the z-direction. The strength of the slice gradient was set such that the slice would have a full-width-half-maximum (FWHM) thickness of 4 mm.
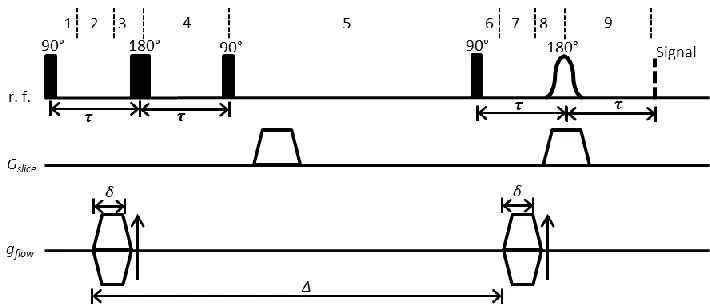
The pulse sequences used in this study and their parameters are given in Table 3. In this table, the field-of-flow refers to the range of velocities which can be registered by a velocity measurement experiment, analogous to the field-of-view in an imaging experiment. Initially, a spin echo velocimetry pulse sequence was used because of its simplicity and its demonstrated accuracy for measuring gas velocity in beds of particles 5 mm in diameter [17,18]. However, for the measurements at high velocity and with small particles, this pulse sequence, shown in Figure 1, was expected to have rapid signal decay and inaccurate velocity measurements of SF6 in the
bed of particles, due to signal attenuation and velocity encoding from background gradients. Thus, more complicated pulse sequences robust to background gradients were explored. These pulse sequences are referred to by the number of “intervals” they have. Intervals refer to periods of time during the pulse sequence when the magnetic field vector is in a distinct period of its evolution; a new interval begins when an r.f. pulse is implemented or a magnetic field gradient is turned on or off. The intervals for the pulse sequences are indicated above the r.f. line in the pulse sequence diagrams. The 9-interval pulse sequence of Cotts et al. [6], shown in Figure 2, was tested because it allows for a long observation time (Δ) for velocimetry and is more robust to signal attenuation due to background gradients. In this pulse sequence, homospoil gradients were used in all three directions during the z-storage period between the second and third 90° pulses in order to ensure that any coherent signal in the horizontal plane during this time period was negated. The z-storage period allows for a long observation time because signal decays according to T1 during the z-storage period, and there is no potential for velocity encoding from the
is identical to the 9-interval pulse sequence, except an extra set of flow encoding gradients are used on each side of the z-storage period. Signal attenuation and the effects of background gradients are expected to increase dramatically with increasing values of τ, and thus it is desirable to minimise the echo time. The echo time, is limited by the slew rate of the gradient set, the r.f. pulse duration and ringdown. The gradients were turned on and off using linear ramps of duration 100 s. The minimum duration of the hard 90° r.f. pulse was 115 s, and the minimum duration for a soft 180° r.f. pulse was 256 s. In addition a 30 s delay was required between r.f. pulses and the start or end of the gradient ramps. Thus, the minimum echo time for the 9- and 13-interval sequences was 780 s.
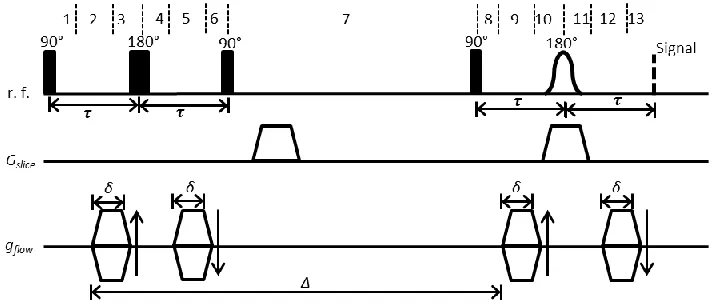
Figure 4 shows an 11-interval pulse sequence, developed here, to minimise signal attenuation and flow encoding arising from background gradients in the magnetic field. Similar to the 9- and 13-interval pulse sequences, the 11-interval pulse sequence makes use of a z-storage period, in order to allow for a large observation time. However, the 11-interval sequence utilises two double spin echoes on opposite sides of a z-storage period as these have both a zeroth moment and a first moment equal to zero with respect to back ground gradients. Therefore, the double spin echo portions of the pulse sequence are velocity compensated with respect to background gradients, and hence the pulse sequence minimises velocity encoding from background gradients. Furthermore, the use of double spin echoes allows the flow encoding gradients to be placed in the centre of a 2τ-long period between pulses, such that the echo time, τ, could be reduced from 780 µs to 360 µs as compared to the 9- and 13-interval pulse sequences. The double spin echo does not have symmetric gradient pulses and therefore will not be compensated for the cross term between the applied gradient and the background gradient. However, this term is only critical for diffusion measurement and is not critical for flow measurement [12]. Thus, this pulse sequence was expected to provide improved performance as compared to the spin echo, 9- and 13-interval pulse sequences. A cogwheel phase cycle was developed in which the r.f. pulses were incremented simultaneously, as opposed to independently, in order to minimise the length of the phase cycle [21,22].The 12-step phase cycle for the seven r.f. pulses was: = = 30°, 60°, 90°, 120°, 150°, 180°, 210°, 240°, 270°, 300°, 330°, 0°; = = 0°; = = 60°, 120°, 180°, 240°, 300°, 0°; = 90°, 180°, 270°, 0°; = 270°, 180°, 90°, 0°.
For all of the experiments with different pulse sequences, the amount of signal received from the measurement and the velocity measured was recorded. For each experiment, three signals were obtained, one when no flow encoding gradients were pulsed, one when the flow encoding gradients were pulsed in the positive-negative orientation and one in the negative-positive orientation. The signals were sampled in a small window in time surrounding the centre of the echo for each experiment, in order to obtain signal and velocity information. The absolute value of the signal obtained when no flow encoding gradients were pulsed was used to record the amount of signal received from a given experiment. The complex data from the experiments in which the gradients were pulsed was used to determine the velocity, according to the well-known phase contrast method. Since slightly non-zero velocities (< 0.001 m s-1) were measured for the different pulse sequences when there was no net flow of SF6 through the bed, these velocities
In order to assess the accuracy of the measurements of gas velocity, the measured velocities were compared with the expected gas velocity, given the mass flow rate of SF6, the bed diameter and
the solids packing fraction, . Since the solids packing fraction in the bed varied with flow rate, the expected velocity had to be calculated taking into account this change in solids packing. The expected velocity, , was calculated, according to:
(1)
Here, is the packing fraction at a superficial gas velocity, U, the volumetric flow rate divided by the cross-sectional area of the cylinder. This packing fraction was measured as described in Section 2.4.
2.4 Measurements of particle packing fraction
The particle packing fraction was measured for each flow rate by running spin echo experiments on the oil in the particles (parameters given in Table 4). The signal intensity obtained from these particle-phase spin echo experiments was converted into a packing fraction. For this conversion, a spin echo was first acquired of a packed bed of the particles in which the packing fraction was known. The packing fraction for the packed bed case was measured by filling a graduated cylinder to a specified volume, , with poppy seeds and then submerging the poppy seeds under water. The volume increase in the water was used to determine the actual volume of the poppy seeds, , and thus the packing fraction was:
(2)
This methodology was able to measure accurately, since the poppy seeds measured did not aborb any measurable quantity of water in the approximately 2 minutes of submersion required for the measurement, as determined by monitoring the surface level of liquid over time for poppy seeds submerged in water. For the dp = 1.1 mm particles, this packing fraction was = 0.57, and for the dp = 0.5 mm particles, it was = 0.58. A standard, slice selective spin echo pulse sequence (with no flow encoding gradients applied) was used to measure the signal intensity from the bed of particles in a packed state, giving a signal . Measurements were taken at different flow rates, and the packing fraction was assessed based on the ratios of the measured signal intensity, , and the signal intensity from the packed bed:
(3)
3. Results
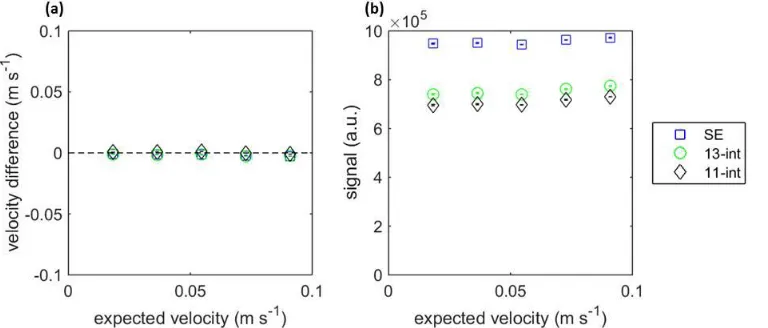
measured and expected velocity for any of the pulse sequences was 0.001 m s-1, showing that all pulse sequences were able to measure velocities accurately at all flow rates examined. The experiments were repeated 3 times, and the standard deviations of any three measurements for all of the flow rates and all of the pulse sequences were below 0.001 m s-1, showing that there was a low level of random noise in the measurements. Figure 5 (b) shows the corresponding signal intensities for the measurements in Figure 5 (a). The signal intensity is the highest for the spin echo pulse sequence, with lower signal intensities for the 13- and 11-interval pulse sequences. In all cases, the signal intensity does not change significantly with expected velocity.
Figure 6 (a) shows the results for measurements of the vertical component of gas velocity in the bed of dp = 1.1 mm particles, 50 mm above the distributor. The spin-echo pulse sequence was not able to measure the velocity accurately at any gas velocity. The 9- and 13-interval sequences were able to measure the gas velocity accurately up to ~0.010 m s-1. The 11-interval pulse sequence was most accurate, with a measured velocity 0.010 m s-1 lower than the expected interstitial velocity of 0.162 m s-1 at the highest flow rate. For all pulse sequences, the measurements were least accurate at the highest flow rate, with measured velocities all below the expected velocity. . Each experiment was repeated 3 times, showing very similar results, to confirm that any inaccuracies were not simply due to random noise in the experiments. The maximum standard deviation of any three measurements for any of the flow rates and any of the pulse sequences was 0.002 m s-1.
Figure 6 (b) shows the corresponding signal intensity for the measurements in Figure 6 (a). In the no flow case, the 13- and 9-interval pulse sequences have the same signal intensity, slightly above that of the 11-interval pulse sequence and significantly greater than that of the spin echo pulse sequence. In the flowing cases, the signal from the 11-interval pulse sequences is the highest and decreases only slightly with increasing flow rate. Between the no flow and the highest flow rate, the signal decreased by just 7% for the 11-interval pulse sequence. The signal from the 9- and 11-interval pulse sequences are equal to one another and decrease more significantly with increasing flow rate. These pulse sequences are expected to have the same signal intensity because the signal intensity was taken from the experiments when no flow encoding gradients were applied, and the pulse sequences are identical when no flow encoding gradients are applied. For these pulse sequences, the signal decreased by 42% between the no flow case and the highest flow rate.
Figure 7 (a) shows velocity measurements using the 11-interval pulse sequence in the bed of dp = 1.1 mm particles, varying the observation time from 3 ms to 30 ms, while maintaining the same field-of-flow. Each measurement was run three times, and again, the measurements were consistent to within 0.001 m s-1 indicating that there is little random noise. The measurements show that the observation time does not have a significant effect on the measured velocity with the 11-interval pulse sequence. Figure 7 (b) shows the corresponding signal intensities from the measurements. While signal intensity decreases with increasing observation time due to T1
effects, in all cases the signal only decreases slightly with increasing flow rate.
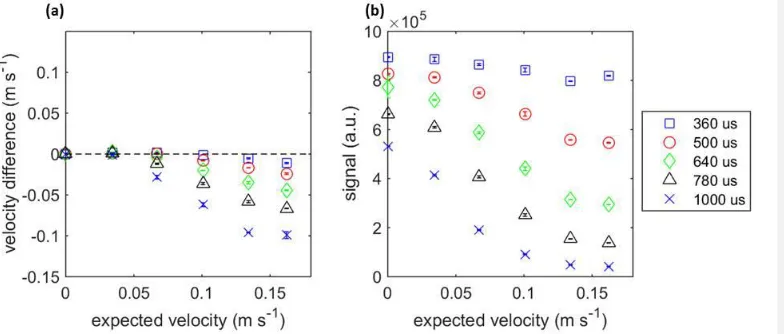
velocity. Figure 8 (b) shows the corresponding signal intensities for the measurements in Figure 8 (a). In all cases, the signal intensity decreases with increasing τ and increasing expected velocity. The difference between signal intensity under no flow and at the highest flow rate increases with increasing τ, showing that the 11-interval pulse sequence is less robust to signal attenuation due to flow at higher values of τ. The percent difference between the signal intensity at no flow and that at the highest flow rate are 7%, 32%, 59%, 77% and 90% for the τ = 360, 500, 640, 780 and 1000 µs experiments, respectively.
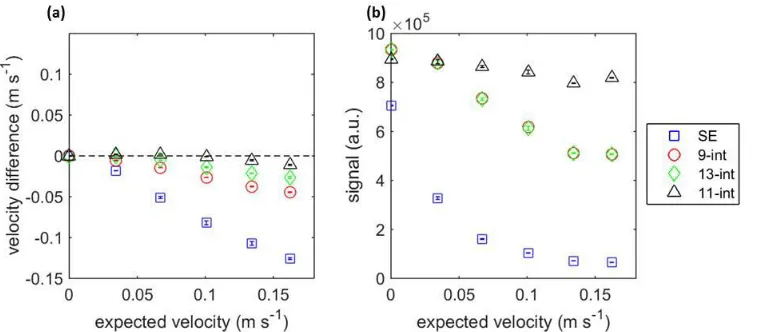
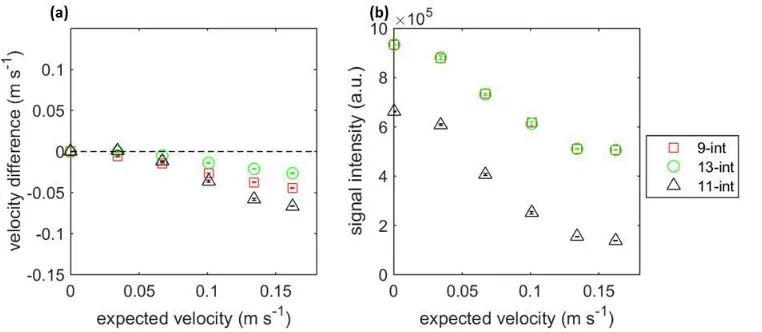
Figure 9 (a) shows measurements of gas velocity using the 9-, 13- and 11-interval pulse sequences; an echo time of τ = 780 µs was used for all of the pulse sequences. At expected velocities above 0.07 m s-1, the gas velocity measured with the 11-interval pulse sequence is less than that measured with the 9- and 13-interval sequences. For example, at the highest flow rate, the velocity measured by the 11-interval pulse sequence is 0.066 m s-1 lower than the expected velocity. The corresponding velocity differences for the 9- and 13- interval pulse sequences are 0.025 m s-1 and 0.045 m s-1, respectively. Figure 9 (b) shows the corresponding signal intensities. The signal intensities for the 9- and 13-interval pulse sequences are equal to one another and higher than those for the 11-interval pulse sequence. All pulse sequences show similar patterns in decreasing signal intensity with increasing expected velocity.
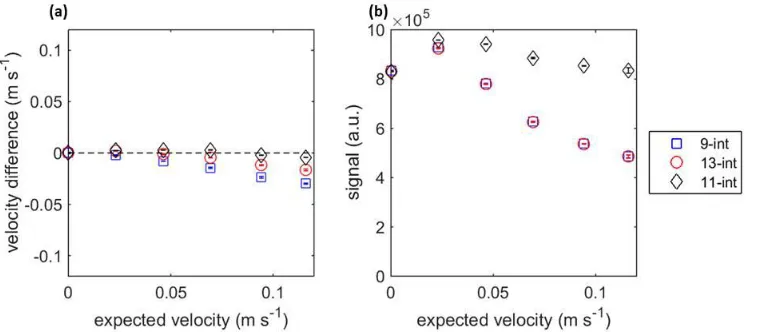
Figure 10 (a) shows the gas velocity measurements in the bed of dp = 0.5 mm particles for the 9-, 13- and 11-interval pulse sequences. The highest flow rate corresponded to an expected velocity of 0.116 m s-1. For all pulse sequences, at the highest flow rate, the measured velocities were all below the expected velocity. The 11-interval pulse sequence was most accurate of the pulse sequences tested. Each experiment was repeated 3 times. The maximum standard deviation of any three measurements for any of the flow rates and any of the pulse sequences was 0.001 m s-1, showing that there was a low level of random noise in the measurements. Figure 10 (b) shows the corresponding signal intensity for the measurements in Figure 10 (a). In the no flow case, the 9- and 13-interval pulse sequences have the same signal intensity, slightly above that of the 11-interval pulse sequence and significantly greater than that of the spin echo pulse sequence. In the flowing cases, the signal from the 9- and 13-interval pulse sequences are equal to one another and decrease significantly with increasing flow rate. The signal from the 11-interval pulse sequences is the highest and decreases only slightly with increasing flow rate.
4. Discussion
non-linear phase change owing to flow or acceleration effects occurring during the observation time that may interfere with the velocity encoding from the applied flow gradients non-linearly. (d) SF6 could adsorb on to particles making a significant amount of signal come from stationary SF6
on the particles, depressing the measured velocity. Issue (d) was eliminated as a possibility because this issue would cause the calibration curves of measured vs. expected velocity to be straight lines going through the origin, with slopes less than unity, and this was not observed for any of the pulse sequences (see Figure 6 (a)). Additionally, if SF6 was adsorbed on to poppy
seeds, two values of T2 likely would be measured, one from adsorbed SF6 and one for gaseous
SF6, and this was not observed. To determine which of the other effects is dominant, each must
be considered in more detail.
For dealing with issues (a) and (b) it is desirable to lengthen the observation time, Δ, and shorten the echo time, τ, since signal decays significantly with respect to τ [6] and longer observation times allow for flow encoding based more on coherent displacement than acceleration and diffusion or dispersion. Since spin echo pulse sequences need a long τ to achieve a long Δ, this pulse sequence performed the worst at measuring velocity in the bed of particles, as shown in Figure 6 (a). The 9-, 13- and 11-interval pulse sequences produced much more accurate measurements in Figure 6 (a) because they use the z-storage period of a stimulated echo in order to lengthen Δ without lengthening τ.
For dealing with issue (c), it is important to employ a pulse sequence with a first moment equal to zero for the background gradients so that there is no velocity encoding from constant background gradients. Although the 9- and 13-interval pulse sequences have zero first moments when calculated on a time scale on the order of , the first moment is not zero for a time scale on the order of . The background gradient will change with a length scale on the order of dp; the
displacements measured are typically ≥ dp. Therefore, the background gradient cannot be
assumed constant over [12], and the measurement using the 9- and 13-interval pulse sequences will not be fully flow compensated with respect to the background gradient. In contrast, the 11-interval pulse sequence utilised double spin echoes on each side of the z-storage period. The double spin echo has a zero first moment with respect to background gradients. Therefore, the 11-interval sequence is flow compensated over a time scale of the order , even if the background gradient is only constant over an interval of the order . Motion encoding arising from background gradients during the 11-interval sequence may be reduced compared to the 9- and 13-interval sequences. Additionally, the even echoes in the 11-interval pulse sequence will allow signal to be better refocused with imperfect r.f. pulses than the signal from the 9- and 13-interval pulse sequences, since the latter sequences utilize odd echoes [23]. However, as a consequence of the additional flow compensation, the total echo time (i.e. the total time spent in the transverse plane) has increased from 4 with the 9- or 13-interval sequences to 8 for the 11-interval sequence. These two effects are conflicting. The data shown in Figure 6 indicate that the 11-interval pulse sequence performs significantly better than the 9- or 13-interval pulse sequence when the total echo times for the three sequences are very close to one another. The question remains as to whether the improvement in performance is due to a lower value of or reduced non-linear flow encoding.
from background gradients (issue c). Figure 8 (a) showed that with increasing τ, the 11-interval pulse sequence became significantly less accurate at measuring gas velocity at high flow rates. With increasing values of τ, more signal is lost at higher flow rates, and this signal is lost selectively from faster moving nuclei, explaining the lower measured velocities at high flow rates. Thus issue (a) is clearly important. Figure 9 (a) showed that with the same value of τ, the 9- and 13-interval pulse sequences measure velocity more accurately at high flow rates than the 11-interval pulse sequence. If non-linear flow encoding from background gradients (issue c) were important, as compared to signal decay (issue a), then the 11-interval pulse sequence would perform better than the other pulse sequences at the same value of τ. Instead, the 11-interval pulse sequence is less accurate in velocity measurements for the same value of (albeit with a larger total echo time). These results indicate that issue (a) had a much greater impact on velocity measurements than issue (c), and the reduction in that is possible when using the 11-interval pulse sequence is the main reason for the increase in accuracy of the 11-interval sequence.
The 11-interval pulse sequence still measured velocities below those expected at the highest flow rate in the bed of particles, as shown in Figure 6 (a). This issue probably arose from the rapid decay of the fastest moving signal due to background gradients and acceleration weighting. However, these inaccuracies were < 8% for all velocities measured. For measurements in the fluidized bed, the velocity through the particulate phase is not likely to increase significantly beyond the velocities measured here, even under fluidized conditions. During fluidization gas travels at velocities similar to those seen at minimum fluidization conditions through the particulate phase; higher gas velocities only occur for the gas passing through the bed as bubbles, where the effect of background gradients is expected to be significantly smaller since there are not many particles in bubbles and bubbles are much larger than individual particles.
The measurements shown here demonstrate that accurate velocities can be measured using the 11-interval pulse sequence for dp = 1.1 mm particles, with quantitatively accurate measurements
up to expected velocities of 0.1 m s-1 and significantly improved measurements for expected velocities greater than 0.1 m s-1. Hhowever, it could be expected that measurements would not be as accurate in beds of smaller particles, which are also of interest in gas-solid fluidization research. Previous measurements showed that accurate measurements could be obtained using a spin echo pulse sequence for beds containing particles of dp = 5 mm [17,18]. However, the spin echo pulse sequence was not accurate when used to measure velocity in the bed of dp = 1.1 mm particles here. However, Figure 10 (a) shows that the 11-interval pulse sequence also measured gas velocity accurately in a bed of dp = 0.5 mm particles for expected velocities up to 0.09 m s-1 and with significant improvements in accuracy over the 13-interval pulse sequence for gas velocities greater than 0.09 m s-1. Additionally, smaller beds of particles reach minimum fluidization and bubbling conditions at lower velocities than do larger beds of particles, reducing the maximum value of expected velocity at which gas velocity needs to be measured accurately in the bed in order to measure gas velocity accurately under fluidized conditions. Since the 11-interval pulse sequence becomes less accurate with increasing expected gas velocity through packed beds of particles, it is possible that the pulse sequence could be even more accurate at measuring gas velocities in bubbling beds of smaller particles. It remains an area of future research to explore the accuracy of the 11-interval pulse sequence for beds with dp < 0.5 mm.
Formatted: Superscript
Formatted: Superscript
Formatted: Superscript
One final question that arises is why this problem has not been identified more frequently during investigations of the flow of liquid through porous media. There is a substantial body of research in this area often using particles of diameter 100 m and velocities of the order of 0.01 m s-1, or more (for example see [8,10,24,25]). These are comparable to the diameter of 1.1 mm and velocities of 0.1 m s-1 used in the present work. The major differences between these studies and the work presented here is the use of a liquid phase instead of the gas used in the present work, and the lower magnetic field strength used for many of these measurements. A typical sandstone or bead pack will have an apparent T2* of ~0.5 ms at the field strength of 4.7 T used in this work
[26], while the SF6 gas used here had an apparent T2* of 0.2 ms. Ignoring the contribution from T2 and the static magnetic field, the difference in magnetic susceptibility is inversely proportional
to the apparent T2*. Therefore, the magnetic susceptibility, and hence internal gradients [27], are
expected to be approximately twice as strong in this system, when compared with a typical liquid phase system. However, many porous media samples have shorter T2* than sandstones and
therefore this explanation alone is insufficient. It is likely that the more significant contribution arises from the difference in the diffusivity of the gas. Gases typically have a diffusivity several orders of magnitude greater than liquids. The SF6 gas at 7.5 bar g used in this work was chosen
because of its low diffusivity, but even so it has a diffusivity two orders of magnitude greater than that of water. The high diffusivity in combination with the strong internal gradients observed in this system likely explain why the 13-interval pulse sequence does not perform well here. These observations also suggest that the 11-interval sequence developed here may be of interest for flow measurements in other heterogeneous samples, especially at high magnetic fields where quantitative measurements are more challenging [12,28].
5. Conclusions
This study presents a new 11-interval pulse sequence for accurately measuring fluid velocity with improved accuracy in heterogeneous media where background gradients are prominent. The new pulse sequence measured gas velocity in beds of 1.1 mm and 0.5 mm diameter particles more accurately than a standard spin echo pulse sequence, as well as the 9- and 13-interval pulse sequences of Cotts et al.[6]. For all pulse sequences, inaccuracies in gas velocity measurement at high flow rates were caused by selective attenuation of signal from the fastest moving nuclei, and this signal attenuation correlated strongly with increasing τ, as could be expected given previous theory and experimental results[6]. This effect was minimised in the 11-interval pulse sequence because it allowed for a significantly shorter value of τ than other pulse sequences. The 11-interval pulse sequence is enabling accurate improved measurements of gas dynamics in fluidized beds and has the potential to improve measurements of flow of fluids with high diffusivity (> 10-7 m2 s-1) at fast velocities (> 0.05 m s-1) in other heterogeneous media with low
T2* (< 1 ms),especially for particles < 1 mm in diameter. It is worth noting that these values for diffusivity, velocities, T2* and particle size are based on the system studied here; for particles
significantly smaller than 1 mm, the 11-interval pulse sequence may be advantageous for liquids with lower diffusivities, perhaps extending into the range of common liquids such as water.
Acknowledgements
References:
[1] C.J. Elkins, M.T. Alley, Magnetic resonance velocimetry: applications of magnetic resonance imaging in the measurement of fluid motion, Exp. Fluids. 43 (2007) 823–858. doi:10.1007/s00348-007-0383-2.
[2] P.T. Callaghan, Translational Dynamics and Magnetic Resonance: Principles of Pulsed Gradient Spin Echo NMR, OUP Oxford, 2011.
[3] B. Blümich, NMR imaging of materials, Clarendon, Oxford, 2000.
[4] A.J. Sederman, M.L. Johns, A.S. Bramley, P. Alexander, L.F. Gladden, Magnetic resonance imaging of liquid flow and pore structure within packed beds, Chem. Eng. Sci. 52 (1997) 2239–2250. doi:10.1016/S0009-2509(97)00057-2.
[5] L.L. Latour, K. Svoboda, P.P. Mitra, C.H. Sotak, Time-dependent diffusion of water in a biological model system., Proc. Natl. Acad. Sci. 91 (1994) 1229–1233.
doi:10.1073/pnas.91.4.1229.
[6] R. Cotts, M. Hoch, T. Sun, J. Markert, Pulsed field gradient stimulated echo methods for improved NMR diffusion measurements in heterogeneous systems, J. Magn. Reson. 1969. 83 (1989) 252–266. doi:10.1016/0022-2364(89)90189-3.
[7] L. Li, Q. Chen, A.E. Marble, L. Romero-Zerón, B. Newling, B.J. Balcom, Flow imaging of fluids in porous media by magnetization prepared centric-scan SPRITE, J. Magn. Reson. 197 (2009) 1–8. doi:10.1016/j.jmr.2008.10.020.
[8] U.M. Scheven, D. Verganelakis, R. Harris, M.L. Johns, L.F. Gladden, Quantitative nuclear magnetic resonance measurements of preasymptotic dispersion in flow through porous media, Phys. Fluids. 17 (2005) 1–7. doi:10.1063/1.2131871.
[9] M.D. Mantle, Quantitative magnetic resonance micro-imaging methods for pharmaceutical research, Int. J. Pharm. 417 (2011) 173–195. doi:10.1016/j.ijpharm.2010.11.035.
[10] M. Hunter, P. Callaghan, NMR Measurement of Nonlocal Dispersion in Complex Flows, Phys. Rev. Lett. 99 (2007) 210602. doi:10.1103/PhysRevLett.99.210602.
[11] J. Perlo, F. Casanova, B. Blümich, Velocity imaging by ex situ NMR, J. Magn. Reson. 173 (2005) 254–258. doi:10.1016/j.jmr.2004.12.010.
[12] N. Spindler, P. Galvosas, A. Pohlmeier, H. Vereecken, NMR velocimetry with 13-interval stimulated echo multi-slice imaging in natural porous media under low flow rates, J. Magn. Reson. 212 (2011) 216–223.
[13] C.R. Müller, J.F. Davidson, J.S. Dennis, P.S. Fennell, L.F. Gladden, A.N. Hayhurst, et al., Real-Time Measurement of Bubbling Phenomena in a Three-Dimensional Gas-Fluidized Bed Using Ultrafast Magnetic Resonance Imaging, Phys. Rev. Lett. 96 (2006) 154504. doi:10.1103/PhysRevLett.96.154504.
[14] D.J. Holland, L.F. Gladden, C.R. Müller, J.S. Dennis, A.J. Sederman, Spatially resolved measurement of anisotropic granular temperature in gas-fluidized beds, Powder Technol. 182 (2008) 171–181. doi:10.1016/j.powtec.2007.06.030.
[15] L.F. Gladden, A.J. Sederman, Recent advances in Flow MRI, J. Magn. Reson. 229 (2013) 2–11. doi:10.1016/j.jmr.2012.11.022.
[16] B. Newling, C. Poirier, J. Rioux, Y. Zhi, A. Coristine, B. Balcom, et al., Velocity Imaging of Highly Turbulent Gas Flow, Phys. Rev. Lett. 93 (2004) 154503.
[17] M.H. Sankey, D.J. Holland, L.F. Gladden, A.J. Sederman, Magnetic resonance velocity imaging of liquid and gas two-phase flow in packed beds, J. Magn. Reson. 196 (2009) 142– 148. doi:10.1016/j.jmr.2008.10.021.
[18] D.J. Holland, D.M. Malioutov, A. Blake, A.J. Sederman, L.F. Gladden, Reducing data acquisition times in phase-encoded velocity imaging using compressed sensing., J. Magn. Reson. 203 (2010) 236–46. doi:10.1016/j.jmr.2010.01.001.
[19] T. Pavlin, R. Wang, R. McGorty, M.S. Rosen, D.G. Cory, D. Candela, et al., Noninvasive Measurements of Gas Exchange in a Three-Dimensional Fluidized Bed by Hyperpolarized 129Xe NMR, Appl. Magn. Reson. 32 (2007) 93–112. doi:10.1007/s00723-007-0002-7. [20] P.R. Moran, A flow velocity zeugmatographic interlace for NMR imaging in humans,
Magn. Reson. Imaging. 1 (1982) 197–203. doi:10.1016/0730-725X(82)90170-9.
[21] M.H. Levitt, P.K. Madhu, C.E. Hughes, Cogwheel Phase Cycling, J. Magn. Reson. 155 (2002) 300–306. doi:10.1006/jmre.2002.2520.
[22] A. Jerschow, R. Kumar, Calculation of coherence pathway selection and cogwheel cycles, J. Magn. Reson. 160 (2003) 59–64. doi:10.1016/S1090-7807(02)00031-9. [23] T.D.W. Claridge, High-resolution NMR Techniques in Organic Chemistry, Newnes,
2009.
[24] M.H.G. Amin, S.J. Gibbs, R.J. Chorley, K.S. Richards, T.A. Carpenter, L.D. Hall, Study of flow and hydrodynamic dispersion in a porous medium using pulsed-field-gradient magnetic resonance, Proc. R. Soc. Math. Phys. Eng. Sci. 453 (1997) 489–513. doi:10.1098/rspa.1997.0028.
[25] U.M. Scheven, S. Khirevich, a. Daneyko, U. Tallarek, Longitudinal and transverse dispersion in flow through random packings of spheres: A quantitative comparison of experiments, simulations, and models, Phys. Rev. E - Stat. Nonlinear Soft Matter Phys. 89 (2014) 1–10. doi:10.1103/PhysRevE.89.053023.
[26] J. Mitchell, T.C. Chandrasekera, M.L. Johns, L.F. Gladden, E.J. Fordham, Nuclear magnetic resonance relaxation and diffusion in the presence of internal gradients: The effect of magnetic field strength, Phys. Rev. E. 81 (2010) 026101.
doi:10.1103/PhysRevE.81.026101.
[27] J. Mitchell, T.C. Chandrasekera, L.F. Gladden, Obtaining true transverse relaxation time distributions in high-field NMR measurements of saturated porous media: Removing the influence of internal gradients, J. Chem. Phys. 132 (2010). doi:10.1063/1.3446805. [28] N.M. Homan, B. Venne, H. Van As, Flow characteristics and exchange in complex
Figures:
Figure 6 Measurements of the vertical component of gas velocity in the dp = 1.1 mm bed of particles using spin
[image:26.612.71.451.128.294.2]Figure 7 Measurements of the vertical component of gas velocity in the dp = 1.1 mm bed of particles using the
Figure 8 Measurements of the vertical component of gas velocity in the dp = 1.1 mm bed of particles using the
Figure 9 Measurements of the vertical component of gas velocity in the dp = 1.1 mm bed of particles using 9-, 13-
Figure 10 Measurements of the vertical component of gas velocity in the dp = 0.5 mm bed of particles using 9-, 13
Tables:
Table 1. Fluidized bed properties
Bed Property Value
Inner diameter (Dbed) 52 mm
Tapped bed height (H0) 100 mm
Particle type Poppy seeds Particle diameter (dp) 1.1 mm 0.5 mm
Minimum bubbling velocity, Umb
0.09 m s-1 0.06 m s-1
Gas molecule SF6
Pressure 7.5 barg Temperature 25±3°C Gas density 56 kg m-3 Gas viscosity 1.6 10-5 Pas
Distributor type Porous bronze plate
Table 2 Relaxation times
Molecule T1 (ms) T2 (ms) T2* (ms)
SF6 in open pipe 20 13 0.5
SF6 in bed of particles 19 10 0.2
[image:31.612.57.450.375.483.2]Oil in poppy seeds 373 75 0.3
Table 3 Parameters for vertical velocity measurements with different pulse sequences
Parameter Spin Echo 9-interval 13-interval 11-interval
Field of flow (FoF) 2.00 m s-1 2.00 m s-1 2.00 m s-1 2.00 m s-1 FWHM slice thickness 4 mm (z) 4 mm (z) 4 mm (z) 4 mm (z)
Phase cycling 4-step 8-step cogwheel 8-step cogwheel 12-step cogwheel Observation time (Δ) 2.33 ms 6 ms 6 ms 2, 6, 30 ms Flow encoding gradient period (δ) 100 μs 100 μs 100 μs 100 μs
Echo time (τ) 2000 μs 780 μs 780 μs 360, 500, 640, 780 1000 μs
Recycle time (TR) 75 ms 75 ms 75 ms 75 ms
Number of averages (Navg) 6 3 3 2
[image:31.612.105.372.516.618.2]Acquisition time 30 seconds 30 seconds 30 seconds 30 seconds
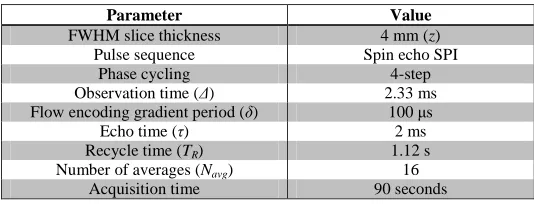
Table 4 Parameters for measurements of particle packing fraction
Parameter Value
FWHM slice thickness 4 mm (z) Pulse sequence Spin echo SPI
Phase cycling 4-step
Observation time (Δ) 2.33 ms Flow encoding gradient period (δ) 100 μs
Echo time (τ) 2 ms Recycle time (TR) 1.12 s
Number of averages (Navg) 16
January 13
th, 2015
11-interval PFG pulse sequence for improved measurement of
fast velocities of fluids with high diffusivity in systems with
short
T
2*C. M. Boyce§†, N. P. Rice, A. J. Sederman, J. S. Dennis, D. J. Holland‡
Department of Chemical Engineering and Biotechnology, University of Cambridge, New Museums Site, Pembroke Street, Cambridge CB2 3RA, UK.
.
(§) Corresponding author. Email: [email protected]. Tel: +1-646-255-4807
(†) Current address: Department of Chemical and Biological Engineering, Princeton University, Princeton, NJ 08544
(‡) Current address: Department of Chemical and Process Engineering, University of Canterbury *Manuscript
Abstract
Magnetic resonance (MR) was used to measure SF6 gas velocities in beds filled with particles of 1.1 mm and 0.5 mm in diameter. Four pulse sequences were tested: a traditional spin echo pulse sequence, the 9-interval and 13-interval pulse sequence of Cotts et al. (1989) and a newly developed 11-interval pulse sequence. All pulse sequences measured gas velocity accurately in the region above the particles at the highest velocities that could be achieved (up to 0.1 m s-1). The spin echo pulse sequence was unable to measure gas velocity accurately in the bed of particles, due to effects of background gradients, diffusivity and acceleration in flow around particles. The 9- and 13-interval pulse sequence measured gas velocity accurately at low flow rates through the particles (expected velocity < 0.06 m s-1), but could not measure velocity accurately at higher flow rates. The newly developed 11-interval pulse sequence was more accurate than the 9- and 13-interval pulse sequences at higher flow rates, but for velocities in excess of 0.1 m s-1 the measured velocity was lower than the expected velocity. The increased accuracy arose from the smaller echo time that the new pulse sequence enabled, reducing selective attenuation of signal from faster moving nuclei.
1. Introduction
Magnetic resonance (MR) has proven a powerful technique for measuring liquid flows in porous media, granular material and other heterogeneous systems [1–3], from measuring liquid flows through packed beds of glass beads [4] to quantifying water diffusion in biological tissue [5]. Measurements of fluid flow are more difficult in heterogeneous media than single phase systems because (a) the signal density from the fluid is lower, (b) flow through tortuous pathways increases the acceleration and dispersion of fluid, leading to difficulties in measuring coherent motion and (c) differences in magnetic susceptibility between the fluid and particles create background gradients which lead to signal decay and shorten relaxation times. Issue (c) in particular is well known for causing problems with accurate quantification of flow phenomena. Cotts et al. [6] have defined the theoretical basis of issue (c) and have developed pulse sequences to minimise their effects. The pulse sequences of Cotts et al. have since been used to enable more accurate measurements in a variety of systems (e.g. [7–11]). However, even with sequences derived from the approach of Cotts et al., quantitative velocity measurements of fast flow through porous material can be challenging [12]. The major challenge with quantitative velocity measurements in these systems is the strong dependence on the echo spacing, . Here we develop quantitative velocity measurements of gas flow through a bed of particles. This measurement technique will be used to provide quantitative measurements of gas flow in fluidized beds.
In fluidized beds, MR has been used to measure bubble dynamics [13], particle velocity and granular temperature [14], providing key insights on the complex dynamics of fluidization. However, without previous measurements of gas dynamics in beds of fluidized particles using MR or other experimental techniques, it has been difficult to shed light experimentally on many key concepts and theories in fluidization.
MR is desirable as compared to other experimental techniques for measuring gas velocities because MR can measure gas velocities directly and quantitatively in opaque, multi-phase systems which are 3D in geometry. However, three main issues make MR velocity measurements of gas more difficult than those of liquid: (1) low signal density from nuclei in the gas phase, (2) fast diffusion of the gas, making it more difficult to measure coherent motion of gas and (3) short relaxation times of molecules in the gas phase.
The present research is concerned with MR techniques allowing for the measurement of time-averaged SF6 velocities in a bed filled separately with two sets of small particles (dp = 1.1 mm,
0.5 mm) under packed and fluidized conditions. The MR characteristics of SF6 limit the types of MR techniques which can be used to measure its velocity, especially when flowing at high velocities and amongst particles. These limitations come from signal degradation due to short relaxation times, background gradients formed at the interface with particles and the need for long observation times (Δ) to minimise the effects of diffusive flow, dispersion and acceleration. A new, 11-interval pulse sequence based on the principles of the pulse sequences introduced by Cotts et al. [6] was developed to measure gas velocity; the accuracy of these measurements was compared to that from measurements using existing pulse sequences.
2. Experimental
2.1 Bed of particles
Gas velocity measurements were conducted in the bed of particles as well as the region above the particles (open pipe) in a fluidized bed. Details of the fluidized bed are summarised in Table 1. The bed had an internal diameter, Dbed = 52 mm filled with poppy seeds to a tapped bed height,
H0 = 100 mm. Two sets of poppy seeds were used, one with diameter dp = 1.1 mm and a second
with dp = 0.5 mm. Different sizes of poppy seeds were used, since it was expected that it would
be more difficult to measure gas velocity accurately in beds of smaller particles as the length scale associated with changes in the magnetic field is closely linked to the particle size, as described further in Section 2.3. The bed was fluidized using sulphur hexafluoride (SF6) gas, which gives an MR signal arising from 19F nuclei. The gas was kept at 7.5 barg in the bed in order to increase the MR signal from it, as well as increase its relaxation times. With the temperature of the SF6 controlled at 25 ± 3°C, its density was 56 kg m-3 and its viscosity was approximately 1.6 10-5 Pas. The gas flow rate was controlled using a Bronkhorst F-113AC-M50-AAD-55-E mass flow controller. Experiments were conducted at a variety of different flow rates in order to investigate the relationship between measured velocity and expected velocity when using different pulse sequences. The flow rates were kept below values at which “bubbles” of gas void of particles rose through the particles, so that it would be easy to assess the expected velocity because there would not be issues with temporally variant velocities or difficulties in assessing the solids packing fraction in the bed. A porous plate distributor approximately 50 mm in diameter made of 250 μm sintered bronze was used for even distribution of gas at the inlet to the fluidized bed. The gas feed to the bed was located 300 mm below the distributor. The region between the gas feed and the distributor was filled with glass beads 2 mm in diameter in order to further ensure the even distribution of gas. The pressure drop across the distributor and glass beads was measured to be 10 mbar, ensuring even flow of gas at the inlet. The bed was made from a PVC pipe.
2.2 MRI arrangement
tuning to either the 1H or the 19F frequency) with an inner diameter of 64 mm was situated around the fluidized bed to excite and detect signal from the seeds and gas. A shielded 3-axis gradient set capable of producing a maximum gradient of 0.139 T m-1 was used for imaging and velocimetry purposes.
The relaxation times for the poppy seeds and SF6 gas were measured in order to determine repetition times for successive scans of MRI experiments. These times are shown in Table 2. The repetition times were chosen as 3-5 times T1, so as to allow the net magnetisation to return almost completely to the vertical (z) axis before the next excitation. The B0 field homogeneity was poor (3 ppm at 10% of the peak height) due to limited shimming capabilities, as well as background gradients due to the difference in the magnetic susceptibility of the particles and the gas. Therefore, the T2* for the oil in the particles and the gas was short (< 1 ms).
2.3 Velocity measurement details
Background gradients were expected to affect the accuracy of the gas velocity measurements. Thus, a variety of pulse sequences were used, in order to test the ability of each to measure gas velocity accurately in the fluidized bed. Each pulse sequence used involved a bipolar pair of flow encoding gradients to measure velocity or velocity distribution using the phase contrast method [20]. For slice selection in the z-direction, a Gaussian refocusing pulse was used at the same time as a slice gradient in the z-direction. The strength of the slice gradient was set such that the slice would have a full-width-half-maximum (FWHM) thickness of 4 mm.
is identical to the 9-interval pulse sequence, except an extra set of flow encoding gradients are used on each side of the z-storage period. Signal attenuation and the effects of background gradients are expected to increase dramatically with increasing values of τ, and thus it is desirable to minimise the echo time. The echo time, is limited by the slew rate of the gradient set, the r.f. pulse duration and ringdown. The gradients were turned on and off using linear ramps of duration 100 s. The minimum duration of the hard 90° r.f. pulse was 115 s, and the minimum duration for a soft 180° r.f. pulse was 256 s. In addition a 30 s delay was required between r.f. pulses and the start or end of the gradient ramps. Thus, the minimum echo time for the 9- and 13-interval sequences was 780 s.
Figure 4 shows an 11-interval pulse sequence, developed here, to minimise signal attenuation and flow encoding arising from background gradients in the magnetic field. Similar to the 9- and 13-interval pulse sequences, the 11-interval pulse sequence makes use of a z-storage period, in order to allow for a large observation time. However, the 11-interval sequence utilises two double spin echoes on opposite sides of a z-storage period as these have both a zeroth moment and a first moment equal to zero with respect to back ground gradients. Therefore, the double spin echo portions of the pulse sequence are velocity compensated with respect to background gradients, and hence the pulse sequence minimises velocity encoding from background gradients. Furthermore, the use of double spin echoes allows the flow encoding gradients to be placed in the centre of a 2τ-long period between pulses, such that the echo time, τ, could be reduced from 780 µs to 360 µs as compared to the 9- and 13-interval pulse sequences. The double spin echo does not have symmetric gradient pulses and therefore will not be compensated for the cross term between the applied gradient and the background gradient. However, this term is only critical for diffusion measurement and is not critical for flow measurement [12]. Thus, this pulse sequence was expected to provide improved performance as compared to the spin echo, 9- and 13-interval pulse sequences. A cogwheel phase cycle was developed in which the r.f. pulses were incremented simultaneously, as opposed to independently, in order to minimise the length of the phase cycle [21,22].The 12-step phase cycle for the seven r.f. pulses was: = = 30°, 60°, 90°, 120°, 150°, 180°, 210°, 240°, 270°, 300°, 330°, 0°; = = 0°; = = 60°, 120°, 180°, 240°, 300°, 0°; = 90°, 180°, 270°, 0°; = 270°, 180°, 90°, 0°.