Resolving the temporal evolution of line
broadening in single quantum emitters
C
HRISTIANS
CHIMPF,
1,*M
ARCUSR
EINDL,
1P
ETRK
LENOVSKÝ,
2,3,4T
HOMASF
ROMHERZ,
1S
AIMONF. C
OVRED
AS
ILVA,
1J
ULIANH
OFER,
1C
HRISTIANS
CHNEIDER,
5S
VENH
ÖFLING,
5,6R
INALDOT
ROTTA,
7 ANDA
RMANDOR
ASTELLI1 1Institute of Semiconductor and Solid State Physics, Johannes Kepler University, Linz 4040, Austria 2Department of Condensed Matter Physics, Faculty of Science, Masaryk University, Kotlářská 267/2,61137 Brno, Czech Republic
3Central European Institute of Technology, Masaryk University, Kamenice 753/5, 62500 Brno, Czech
Republic
4Czech Metrology Institute, Okružní 31,63800 Brno, Czech Republic
5Technische Physik and Wilhelm Conrad Röntgen Research Center for Complex Material Systems,
Universität Würzburg, 97074 Würzburg, Germany
6SUPA, School of Physics and Astronomy, University of St Andrews, St Andrews, KY16 9SS, UK 7Department of Physics, Sapienza University, 00185 Rome, Italy
Abstract: Light emission from solid-state quantum emitters is inherently prone to environ-mental decoherence, which results in a line broadening and in the deterioration of photon indistinguishability. Here we employ photon correlation Fourier spectroscopy (PCFS) to study the temporal evolution of such a broadening in two prominent systems: GaAs and In(Ga)As quantum dots. Differently from previous experiments, the emitters are driven with short laser pulses as required for the generation of high-purity single photons, the time scales we probe range from a few nanoseconds to milliseconds and, simultaneously, the spectral resolution we achieve can be as small as∼2µeV. We find pronounced differences in the temporal evolution of different optical transition lines, which we attribute to differences in their homogeneous linewidth and sensitivity to charge noise. We analyze the effect of irradiation with additional white light, which reduces blinking at the cost of enhanced charge noise. Due to its robustness against experimental imperfections and its high temporal resolution and bandwidth, PCFS outperforms established spectroscopy techniques, such as Michelson interferometry. We discuss its practical implementation and the possibility to use it to estimate the indistinguishability of consecutively emitted single photons for applications in quantum communication and photonic-based quantum information processing.
Published by The Optical Society under the terms of theCreative Commons Attribution 4.0 License. Further distribution of this work must maintain attribution to the author(s) and the published article’s title, journal citation, and DOI.
1. Introduction
Semiconductor quantum dots (QDs) are excellent resources of non-classical light for modern photonics [1]. They enable pivotal single photon applications in the field of quantum commu-nication and quantum information processing, such as quantum teleportation [2] and Boson sampling [3,4]. A key parameter in these applications is theindistinguishabilityof consecutively emitted photons, which is usually quantified as the visibility of the Hong-Ou-Mandel (HOM) interference between two photons impinging on a 50:50 beam splitter [5][6]. In turn, this directly impacts the error rate in envisioned applications. The photon indistinguishability of solid state light emitters is predominantly reduced by coupling to the phonon bath [7] and by
#375940 https://doi.org/10.1364/OE.27.035290
down to the microseconds range [14], shedding light on noise sources, but cutting off crucial parts of the frequency spectrum. In addition, this technique is based on excitation via a continuous wave laser, while true single-photon generation requires excitation pulses with temporal duration substantially shorter than the excitonic lifetime. The most reliable way of quantifying the indistinguishability so far is a direct measurement of the interference visibility in a HOM experiment, using varying delay times to probe photons from different excitation cycles [15–17]. However, this approach has limited temporal resolution due to the inefficient way of varying the delay time and the maximum achievable delay is limited by optical fiber losses.
Photon Correlation Fourier Spectroscopy (PCFS), first introduced by Brokmann et al, [18] can provide quantitative information about the emission line broadening at time scales down to the source lifetime (usually sub-nanoseconds) and up to several hours, all in one measurement. It therefore allows an estimation of the trend of the HOM visibility with increasing photon delay. As a Fourier method, it benefits from a high energy resolution compared to diffraction spectroscopy, similar to Michelson interferometry, but without the high requirements in mechanical stability of the optical components. We also stress that, different from scanning resonance fluorescence, PCFS is completely independent on the excitation method (optical or also electrical) and can thus be used to characterized the emitter properties "in operando", i.e. under exactly the same conditions used to generate single photons.
In this article we employ PCFS to investigate line broadening in two QD systems: GaAs QDs and In(Ga)As QDs. In(Ga)As QDs obtained by the Stranski-Krastanow growth method have been used over the last two decades to preform several pioneering experiments [1,12,15,19–21]. GaAs obtained via the local droplet etching method [22,23] have emerged more recently [24]. They exhibit intrinsically short lifetimes, a near-zero multi-photon emission probability [25], and a high indistinguishability of consecutively emitted photons [26] [27], despite the non-lifetime-limited time-averaged linewidth [28]. In addition, these QDs can be used to generate polarization-entangled photon pairs with near-unity entanglement fidelity using the biexciton-exciton recombination cascade [29]. These properties recently allowed performing entanglement swapping between subsequently emitted photon pairs [30], where the success rate is mostly determined by the indistinguishability of the photons used for the Bell state measurement.
We therefore investigate line broadening for the emission lines XX and X corresponding to the biexciton-to-exciton and the exciton-to-groundstate decays for both material systems. We point out differences and common properties based on the information gained from the measurements.
2. Methods
mirror pairs in the bottom (top) DBR (details can be found in [31]). Buried nanohills, which naturally occur during the eptaxial growth, provide lateral confinement to the optical mode, and thus strongly enhance the photon extraction efficiency [31], while the high optical emitter quality is reflected by high degrees of photon indistinguishability of consecutively emitted photons [32,33]. Figure1illustrates the experimental arrangement for PCFS. The QDs are cooled to 5 K in a He flow cryostat and excited by a pulsed TiSa laser with a pulse duration of about 5 ps and a repetition period of 12.5 ns to produce trains of photon pairs, similar to recent experiments [25,34–36]. To access both the XX and X lines, we employ a two-photon excitation scheme (TPE) [35,37], with the laser energy tuned precisely to the half of the biexciton energy. The resulting spectra are shown in Fig.2(a) and2(c), such as the respective decay time traces in Figs.2(b) and2(c). To decrease the total acquisition time and to enhance the temporal resolution, we double the average repetition rate of the laser by an unbalanced Mach-Zehnder interferometer (MZ), yielding two pulses with a time delay of 2 ns per laser pulse. In addition to the laser, white light from an LED with variable intensity can be coupled into the same excitation path.
Fig. 1.Sketch of the experimental setup. The quantum dots (QDs) are placed in a cryostat and excited by a pulsed TiSa laser with a pulse duration of about 5 ps and a separation of 12.5 ns. Each pulse is doubled by an unbalanced Mach-Zehnder interferometer (MZ) with a time delay of 2 ns. Additional white light provided by an LED can be coupled into the excitation path. The emitted photons (XX and X) from the QD’s decay cascade can be filtered in polarization by a half-wave-plate (HWP) and a polariser (Pol), so that only one fine structure component is selected. Variable notch filters (NF) with a bandwidth of 0.4 nm reject the stray light from the laser. The signal is guided to a Michelson interferometer, consisting of two retroreflectors (RR), one of them on a motorized linear stage with 300 mm travel range. The reflected beams interfere at a beam splitter (BS). Both beams are spectrally filtered by monochromators (M) to select either the X or XX emission line and finally measured by avalanche photodiodes (APDs) - connected to correlation hardware.
The spectral separation between X and XX lines - typically about 2 nm (4 meV) for GaAs QDs and 1.5 nm (2.3 meV) for the here employed In(Ga)As QD - allows a selection of the lines via standard diffraction monochromators (M) before detection, see Fig.1. The scattered laser light, located between the X and XX lines, is reflected by tunable notch filters (NF) with a bandwidth of 0.4 nm. Since the exciton energy level is split by a fine structure splitting (FSS), the X and XX lines actually consist of doublets with orthogonal linear polarization [38]. In the setup we can select one fine structure component of each doublet by rotating the polarization plane of the emission signal by a half wave plate (HWP), until one component is cancelled by a subsequent polarizer.
Fig. 2. (a) Emission spectra of a GaAs quantum dot (QD) under resonant two-photon excitation (TPE) - measured by micro photoluminescence (µPL) spectroscopy. XX and X mark the emission lines of the biexcition to exciton- and the excition to groundstate radiative transitions, respectively. (b) Time traces of the X and XX emission from the GaAs QD. Convoluted fits, considering the instrument response function, yield lifetimes of
T1,XX=115(4)ps andT1,X=267(14)ps. (c) Emission spectra of an In(Ga)As QD under TPE. (d) Time traces from the In(Ga)As QD. The fitted lifetimes areT1,XX=186(6)ps and
T1,X=351(15)ps.
via two avalanche photodiodes (APDs), which are connected to correlation hardware. In our experiment we use APDs with a time resolution of 500 ps.
The PCFS measurement is performed by positioning the linear stage at several equidistant positions, yielding a discrete set ofNdifferent optical path differences{δi},i∈ {0,. . .,N−1},
with a constant spacing of∆=δi+1−δi. In Michelson interferometry, usually the intensity
contrast (or "visibility") between the interference maxima and minima at one BS output is determined. In PCFS the interference fringes are averaged by slowly moving the linear stage with a constant velocityv, i.e. no high precision linear stage is needed (in contrast to Michelson interferometry).
To illustrate the working principle of PCFS we first consider a monochromatic plane wave with a time-dependent angular frequencyω(t). In the classical picture, the resulting intensities at the respective BS outputs A and B are then proportional to
IA(t,δi) ∝1+cos
(2vt+δi)ω(t)/c
,
IB(t,δi) ∝1−cos(2vt+δi)ω(t)/c.
(1)
depending on the lifetimeT1of the emitter. Dephasing processes lead to further broadening of
this distribution.
Fluctuations ofωin semiconductor structures usually occur on timescales much smaller than the measurement times of commonly-used spectroscopy methods. Those techniques only reflect the time average of the frequency distribution, concealing its temporal evolution. PCFS allows us to recover the time dependency by exploiting the time resolution of our single photon detectors (APDs) and determining the second order correlation function
g(2)(τ,δi)=
hIA(t,δi)IB(t+τ,δi)it
hIA(t,δi)ithIB(t+τ,δi)it
, (2)
whereh. . .itdenotes the time average over the integration timeT andτis the time difference
between detection events (see later Eq. (3)).
To avoid confusion, we stress at this point that the optical path differenceδgives us access to the spectral distribution, similar to conventional Michelson interferometry. It is in fact evident from Eq. 1 that interference will produce a drop in the coincidence counts between the two detectors and that a relatively low value ofg(2)(τ,δi)is thus expected as long asδiis small
compared to the coherence length of the source, i.e., as long as interference fringes are detectable. The high temporal resolution and large temporal bandwidth on the determination ofτadds the desired temporal information.
The velocityvin PCFS is particularly relevant and should satisfy the following conditions: 1) The travelling distance of the stage withinT has to be small, so that 2vT∆. This condition is equivalent to asserting that the interference visibility has a well defined value for a given value of path differenceδi. 2) The travelling distance must be sufficiently long in order to average
over several interference fringes, so that 2vT 2πc/ω0, whereω0 is the mean frequency of
the emitted signal. 3) The change inδwithin the maximum time delay of interestτmaxhas to
be substantially lower than the coherence length of the emitter, i.e. 2vτmaxcT2(see [18] for
details).
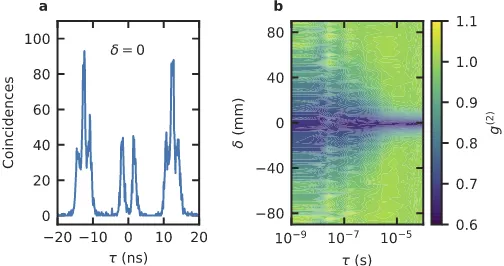
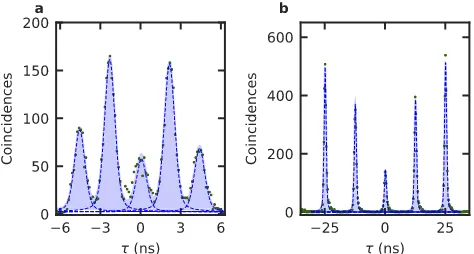
Figure3(a) shows the unnormalizedg(2)(τ)of the X signal of a GaAs QD for a fixedδ=0. The triple-peak pattern originates from the pulse sequence of the excitation laser, doubled by the MZ. The peak atτ=0 is absent due to the single photon emission characteristics of the QD [25]. The single photons arrive within a minimum time delay of 2 ns at the two detectors, yielding the two peaks aroundτ=0 and thus defining the time resolutionτmin=2 ns. This threshold solely
arises from the specific measurement arrangement and can, in principle, be pushed down to the emitter lifetimeT1by further reducing the delay of the MZ or by utilizing a CW pump laser.
We evaluate theg(2)for time delays up toτmax =1 ms, which turned out to be sufficiently
high to cover the slowest frequency fluctuations in the used QDs. The total observable noise frequency range in this case is thus from 1 kHz to 500 MHz, which extends well beyond 100 kHz, previously accessed by resonant fluorescence [14]. After repeating theg(2)measurement for all differentδi, a two-dimensional map ofg(2)values as a function ofτandδcan be constructed, as
shown in Fig.3(b). Provided that the aforementioned conditions regardingvare fulfilled, the value ofg(2)
always drops to (ideally) 0.5 atδ=0. The measured value of about 0.6 is a result of experimental imperfections, such as a non-perfect overlap of the interfering beams at the BS. For
δ,0 and fixedτtheg(2)value increases towards 1 (when corrected for the "blinking" of the emitter, explained in section3.3), following a functional behaviour, which depends on the spectral broadening mechanisms acting within a time delayτ: the stronger the broadening, the narrower the dip ofg(2). From the 2D map we already qualitatively see that the spectral fluctuations of the emitter increase with increasing time delayτ. The maximum path delay induced by the linear stage therefore has to be well above the maximum coherence length 2cT1of the emitted signal, in
Fig. 3.(a) Recorded coincidence histogram (corresponding to the unnormalizedg(2)(τ)) of the X emission of a GaAs QD for a time delayτat the nanosecond timescale and fixed optical path delay ofδ =0. The absence of a peak atτ =0 reflects the single photon emission characteristics of the QD. (b) Normalized second order correlation functiong(2)
of the X photons as a function ofδandτ. The value (ideally) drops to 0.5 atδ=0 and converges to 1 at sufficiently large values ofδ, with a functional behaviour depending on the dephasing mechanisms at differentτ.
To draw conclusions about the energy distribution of our signal, we combine Eq. (1) and Eq. (2):
g(2)(τ,δi)=1−
1 2T
∫ T
0
cos(ζτ(t)δi/c)dt, (3)
whereζτ(t)=δω(t+τ) −δω(t)describes a random frequency shift betweentandt+τ, with
δω(t)the frequency deviation fromω0. For sufficiently longT, all possible frequency fluctuations
will occur, hence we can apply the ergodic theory to substitute the time average with the ensemble average:
g(2)(τ,δi)=1−
1 2
∫ ∞
−∞
cos(ζ δi/c)pτ(ζ)dζ, (4)
where the normalized probability distributionpτ(ζ)over the random variableζ = ζτ(t =0) contains the desired information about the time-dependent spectral properties of the measured signal. We identify the integral in Eq. (4) as Fourier transform [18]. Applying the discrete inverse Fourier transform yields the values forpτ(ζ),
pτ(ζj)=2
N−1 Õ
k=0 h
1−gτ(2)(δk) i
e−2Nπik j 2
, (5)
withj∈ {0,. . .,N−1}andζj=2πcj/N∆. The value ofg(2)τ (δk)is evaluated by integrating over
an appropriate time bin∆τ(see App.A.1).
The maximum induced optical path differenceN∆=δN−1−δ0defines the frequency resolution
by ζmin = 2πc/N∆. For our linear stage with a maximum travel range of 300 mm, the
energy resolution results inmin =~ζmin=2.1 µeV. The measurable spectral range is given by ζmax=2πc/∆. For∆=2.5 mm, the energy range then results inmax=~ζmax=245 µeV.
closer look at the formal definition:
pτ(ζ)=h
∫ ∞
−∞
st(ω)st+τ(ω+ζ)dωi. (6)
In Eq. (6) the emission frequency ω is generalized to the time-dependent homogeneous distributionst(ω). In the case of QDs, it ideally corresponds to the natural Lorentzian spectral
distribution with a linewidth ofΓ=1/T1, often referred to as theFourier limit. The integral in Eq. (6) represents the cross-correlation function between the spectral distributions at the timet
and att+τ, which could differ because of a spectral shift withinτ. The ensemble average (h. . .i) over all possible realisations of frequency fluctuations leads topτ(ζ).
For the limiting case of τ → 0 no frequency fluctuations have occurred and st+τ → st.
Consequently,p0(ζ)corresponds to the auto-correlation function of the Fourier-limited line
shape, which is again a Lorentzian distribution, but with a FWHM of 2Γ. For the second limiting case ofτ→ ∞, all possible frequency shifts have happened betweentandt+τ. This situation corresponds to the regime accessed by standard Michelson interferometry andp∞(ζ)represents the auto-correlation function of the time averaged spectral distribution. In the case of a Gaussian broadening with a FWHM ofΣ, the resulting observedp(ζ)is again a Gaussian distribution with a FWHM of√2Σ.
3. Measurements and results
3.1. Resolving the fine-structure of inhomogeneously broadened lines with PCFS
To illustrate the high spectral resolution of PCFS and gain further insight in the information provided by the technique, we focus here on the fine-structure-split X emission of a GaAs QD.
Figure4shows an excerpt of a PCFS measurement, evaluated at two different time delays
τ=2 ns in Figs.4(a) and4(b) andτ=100 µs in Figs.4(c) and4(d). Instead of using the angular frequency shiftζ, we plot the results as a function of the energy shift=~ζ. The panels on the
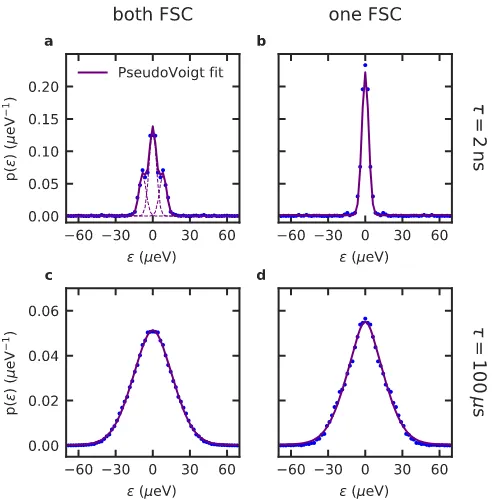
left show measurements of both fine structure components (FSCs). These components represent a static doublet in the spectral distribution, separated by the fine structure splitting (FSS). The value of the FSS was determined from polarization-resolved photo-luminescence (PL) spectra asS=8.2(2)µeV. According to Eq. (6), a static doublet of homogeneously broadened lines results in a peak triplet inp(), as seen in panel (a), corresponding to all different combination of spectral shifts: The peak atζ =0 represents the absence of a spectral shift (if two photons stem from the same FSC). The two identical side peaks correspond to an equally probable positive or negative energy shift of±S(if two photons stem from different FSCs). The triplet is fitted with the sum of three Pseudo Voigt functions. The FWHM of each peak is 6.81(11)µeV and the mean energies of the two side peaks yieldS=8.3(1)µeV, which is in good agreement with the value measured byµPL. Figure4(b) corresponds to the same X emission signal, when selecting only one FSC. In that case,p()shows only one line with fitted FWHM of 6.48(8) µeV. The expected FWHM of a Fourier limited Lorentzian spectral line is 2ΓX=4.97(19)µeV. The discrepancy indicates the presence of a broadening mechanism, already active atτ=2 ns, probably due to both interaction with lattice vibrations [7] and charge noise.
Fig. 4. (a) Distribution of the spectral shiftsp()atτ =2 ns, for both fine structure components (FSCs) of the X signal of a GaAs QD. The doublet appears as a triplet in
p(). The fitted sidepeaks are located at the energy corresponding to the fine structure splittingS=8.3(1)µeV and show a FWHM of 6.81(11) µeV. (b) One FSC of the same signal evaluated atτ=2 ns with a fitted FWHM of 6.48(8)µeV. (c, d) Distribution for the X emission atτ=100 µs, for both and one FSC, respectively. The distinct peaks from the FSCs are obscured, the FWHM of the inhomogeneously broadened lines are 39.2(2) µeV and 38.4(3) µeV, respectively.
the original linewidth. Assuming a predominantly Lorentzian lineshape, the results of PCFS and Michelson interferometry are in sufficiently good agreement.
From the above discussion it is clear that PCFS allows to overcome inhomogenous broadening and thus to access spectrally close lines even without resorting to polarization selection.
3.2. Temporal evolution of the X and XX spectral line broadening from a GaAs QD and an In(Ga)As QD
We focus first on the temporal evolution of the line broadening of a GaAs QD displaying a relatively broad emission linewidth (∼60 µeV) in time-averaged µPL. The broad linewidth, compared to GaAs QDs used in previous works (5.1 µeV [28]), stems from a higher amount of impurities introduced during the growth via MBE, which is an undesirable circumstance for usual application. However, in our particular case, we profit from the high contrast in linewidth at different timescales.
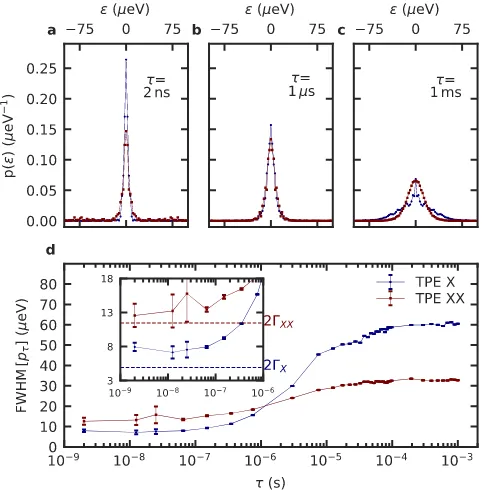
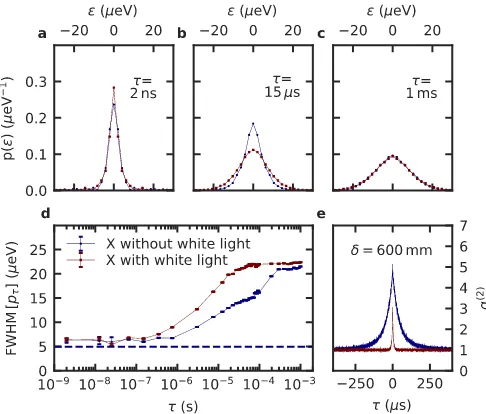
Figures5(a)–5(c) presentp()for the X (magenta) and XX (blue) emission at three relevant time regimes. The corresponding FWHM ofp()for all evaluated values ofτ is shown in Fig.5(d). The dashed lines in the inset represent the X and and XX Fourier limits 2ΓX=4.93(25) µeV and 2ΓXX=11.45(40)µeV, calculated from the measured lifetimes (see Fig.2(b)). Note that the actual Fourier limits can slightly vary among different QDs. At the lowest accessible time delayτmin =2 ns, X (XX) emission exhibits a FWHM (fitted by a Pseudo-Voigt function) of
is not surprising to see that the XX line is broader than the X line. We attribute the discrepancy between the measured values and the respective Fourier limits to phonon coupling [7][39] and possibly charge noise.
Fig. 5.(a-c) Distribution of spectral shiftsp()of the X and XX emission of an GaAs QD at time delaysτ. One FSC was selected by a polarizer. (d) Full width at half maximum (FWHM) ofp()as a function ofτin the range from 2 ns to 1 ms. The dashed lines in the inset correspond to the X and XX Fourier limits of 2ΓX=4.93(25)µeV and 2ΓXX=11.45(40)
µeV, respectively.
Starting at aroundτ=10 ns, a monotonically increasing broadening ofp()for both the XX and the X emission becomes apparent (due to decreasing statistical error, the increase becomes significant from approximately 100 ns). While for short time delays the X line remains narrower than the XX counterpart, a crossover of the linewidths is observed atτ≈1 µs (see Fig.5(d)). All GaAs QDs measured so far showed the same behaviour. We attribute the dominant broadening of the X compared to the XX in GaAs QDs to a higher polarizability of the X state, leading to a stronger coupling to environmental charges due to the quantum confined Stark effect [40].
Finally, at the millisecond timescale both FWHM converge to 60.5(2)µeV (for X) and 32.7(1) µeV (for XX), which correspond to the inhomogeneously broadened spectral lines observed by a spectrometer or by Michelson interferometry.
We want to point out that - for this specific QD - the results shown in Fig.5(d) clearly show that XX is more suitable than X for HOM measurements among remote QDs [28], such as those necessary for a Bell-state measurement used in entanglement swapping. In this case, spectral broadenings for separate emitters are uncorrelated and the deviation from the Fourier limit at long time delays is most important [44] [45].
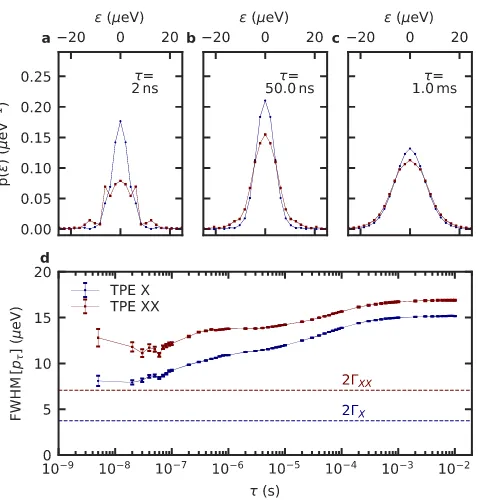
To demonstrate the general applicability of PCFS, the study was repeated using an In(Ga)As QD. Figures6(a)–6(c) showp()for the X and XX transition for three distinctτ, while Fig.6(d) depicts the evolution of the FWHM ofp()forτranging from 2 ns to 1 ms. The dashed lines indicate Fourier limits of 2ΓX =3.75(6)µeV and 2ΓXX =7.09(20)µeV, calculated from the respective radiative lifetimes. At a time delay ofτ=2 ns the FWHM for the X and XX result in 8.0(5)µeV and 12.8(8)µeV, respectively. Consecutively emitted photons in this time regime exhibit interference visibility ofVHOMX =57(4)% andVHOMXX =67(5)%, which is within the error of the limit ofVHOMmax =65(2)%, determined by the lifetime ratio of XX and X.
Towards higherτ, we observe again an unequal evolution of the line broadening for X and XX. In contrast to the GaAs QDs, however, for In(Ga)As QDs the coupling of the X and XX states to charge noise is hard to generalize, as it may depend on the varying inbuilt strain state of the QD [46,47]. At a time delay of about 10 ms the widths converge to 15.17(2)µeV (X) and 16.89(7)µeV (XX). In contrast to the case of the measured GaAs, the curves never cross. Furthermore they reach saturation at longer time delays, which indicates the presence of low frequency components in the charge noise.
3.3. Influence of white light illumination on the charge dynamics of GaAs QDs
In the context of QDs embedded in a semiconductor host structure, additional weak white light illumination is well known to potentially enhance their brightness, especially under resonant excitation and in absence of intentional doping [19,48]. This effect is attributed to a reduction of the "blinking", which is an on-off-modulation (telegraph noise) of the QD emission, presumably due to diffusion of charges from QD into the vicinity or vice versa. Although the impact of white light on the steady-state emission conditions are well explored, little is known about actual variations in the charge dynamics.
Fig. 6.(a-c) Distribution of spectral shiftsp()of the X and XX emission of an In(Ga)As QD at time delaysτ. One FSC was selected by a polarizer. (d) Full width at half maximum (FWHM) of p() as a function ofτin the range from 2 ns to 1 ms. The dashed lines correspond to the X and XX Fourier limits of 2ΓX=3.75(6)µeV and 2ΓXX=7.09(20)µeV, respectively.
broadening starting at lower values ofτ. This is clearly visible by inspecting the lineshape with and without white light (see Fig.7(b)). When fitting with a Pseudo-Voigt function, the line shape ofp()exhibits a more Lorentzian character in the absence of white light, while a more Gaussian character is apparent when using white light.
A previous study reported a similar transition from a Lorentzian to a Gaussian broadening of the X emission line with increasing CW above-band laser pumping power (using In(Ga)As QDs) [13]. The effect was explained by "unconventional" motional narrowing, since the behaviour is opposite from the expected one in bulk semiconductors or quantum wells. Another study reported a different situation, where the emission linewidth from a resonantly excited GaAs QD becomes narrower with higher additional CW laser power [49]. We believe that further research, exploiting the time resolution of PCFS, will help to shine light on the connections between charge dynamics and motional narrowing.
Eventually, at largeτin the millisecond range, the FWHM ofp()converge to similar value values for both cases, see Figs.7(c) and7(d).
More information on the effects produced by white light illumination can be gathered by inspecting theg(2)(τ,δi)shown in Fig.7(e) forδi=600 mm (A large value ofδwas chosen to
exclude any correlation effects stemming from interference at the BS). In absence of blinking, we would expect a flat distribution withg(2)(τ,δi)=1 (Note that the antibunching atτ=0 due
to the single photon emission characteristics is irrelevant due to the large histogram time bin of 100 ns). In presence of blinking,g(2)(τ,δi)has a value of 1/β >1 forτclose to 0 and then
Fig. 7.(a-c) Distribution of spectral shiftsp()of the X signal of a GaAs QD without (blue) and with (magenta) additional white light illumination at differentτ. (d) FWHM ofp()as a function ofτin a range from 2 ns to 1 ms. The dashed line indicates the X Fourier limit of 2ΓX=4.93(25)µeV. (e) Second order correlation functiong(2)(τ)atδ=600 mm. The bunching, indicating the blinking of the QD emission, is reduced by white light illumination.
increase in brightness. Simultaneously, white light reduces the correlation time from 46.7(14) µs to 4.7(4) µs, corresponding to a faster on/off modulation of the emission. By comparing the extracted correlation time with the time at which the line broadening starts to increase in Fig.7(d) we conclude that the increased intensity produced by white light comes at the expense of an increased charge noise at intermediate timescales 500 ns.τ.500 µs.
4. Conclusions
We demonstrated the implementation of a time resolved Fourier spectroscopy technique - Photon Correlation Fourier Spectroscopy (PCFS) [18] - to study the optical emission dynamics of GaAs and In(Ga)As quantum dots under resonant two-photon excitation. We thoroughly explained the experimental implementation and interpretation of obtained data. The experiments gave access to the time evolution of the emission line broadening of GaAs and In(Ga)As quantum dots. The acquired information allow an estimation of the shape and width of the spectral distribution at different time scales, supporting a better understanding of the underlying broadening mechanisms acting in the solid state environment, such as electron-phonon coupling [7] and charge noise [8]. The charge-induced inhomogeneous broadening lowers the HOM interference visibility [50], thus the probing of the temporal behaviour of the fluctuating charges allows us to deduce a trend for the indistinguishability of photons emitted at different time delays. Moreover, we investigated the effect of additional weak white light illumination on the emission of GaAs QDs and observed an acceleration of the charge dynamics, while enhancing the brightness due to suppressed blinking [19,48].
time resolution). The measurement is independent on the excitation conditions and can thus be performedin operando, allowing for a reliable characterization of the emitted light as it is needed in further experiments and applications. Because the full time scale is covered by one measurement and the excitation conditions remain unaltered, PCFS is clearly a viable alternative to direct HOM measurements with varying delay lines [15] [16] or scanning resonance fluorescence [14] experiments. While resonant optical excitation was used here, the technique is perfectly suited for characterizing and possibly optimizing the performance of practical electrically-driven sources of quantum light [51–55].
A. Appendix
A.1. Evaluation and normalisation of the second order correlation function
Detector clicks represent discrete events at the timestiAandtiB, so we rewrite Eq. (2) as
g(2)(τ)=
1 T
∫T 0
Í
iA,iBδ(t−tiA)δ(t−tiB+τ)dt
1 T
∫T 0
Í
iAδ(t−tiA)dt 1 T ∫T 0 Í
iBδ(t−tiB+τ)dt
, (7)
whereTis the total integration time at a fixed path differenceδi. We define the integral in the
numerator of Eq. (7) asn(τ), corresponding to the number of coincidences within an infinitesimal delay time intervaldτ. The integrals in the denominator are referred to asSAandSB, describing
the sum of clicks at the respective detector. Note that bothSAandSBare independent fromτ, as
we sum up over all detector events withinTat all possible values ofτ. Equation (7) then reads
g(2)(τ)=n(τ) T
S1S2 (8)
The normalized correlation function for a certain time bin∆τ:=τB−τAis then defined as:
g(2)∆τ= T S1S2
1 ∆τ
∫ τB
τA
n(τ)dτ=:N∆τn∆τ, (9)
wheren∆τrepresents the sum of all coincidences within the interval∆τandN∆τis the respective normalization factor.
On the one hand, a large ∆τ results a low statistical error in n∆τ, due to the Poissonian statistics. On the other hand, a large∆τinduces an unwanted "averaging" over a certain range of
τ. Therefore, the ratio∆τ/τshould be kept reasonably low. For values ofτin the nano-second regime∆τwas chosen as 10 ns in order to include a full peak triplet per excitation cycle (see Fig.3(a)). For higherτ,∆τwas chosen as approximately 0.1τ.
Chapter 3 (c) in the main paper explains the additional bunching of theg(2), caused by blinking. For a fixed value ofτ, the bunching can be seen as an offset, which lifts the average value of
g(2)τ (δi). When performing the inverse Fourier transform to obtainp(ζ), this offset causes an error
inp(0). To account for the effect we use the fact that atδmax=600 mm, which is well beyond the
maximum coherence length 2cT1, all deviations ofg(2)from 1 can only stem from the blinking and not from interference at the BS. Assuming the blinking to be independent fromδ, we are thus able to renormalize all valuesg(2)(δ
i)by dividing them byg(2)(δmax).
A.2. PCFS on HeNe Laser
Fig. 8.(a-c) Distribution of the spectral shiftsp(ζ)for differentτ. (d) FWHM ofp(ζ)for all evaluated time bins. (e) Michelson measurement of the HeNe Laser, yielding a FWHM of 1.89(11) µeV.
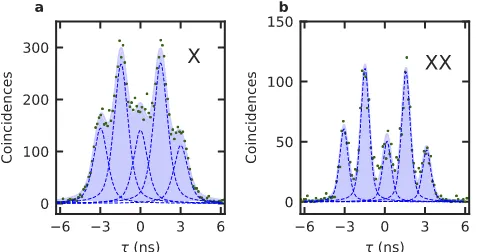
A.3. Hong-Ou-Mandel interference measurements
In Sec. 3B of the main text we mention HOM measurements on the exciton emission of GaAs QDs and the fact that the interference visibility drops by increasing the delay between subsequently emitted photons. Two representative examples are shown in Fig.9.
[image:14.612.188.425.457.584.2]In addition, HOM measurements of the exciton and biexciton emission of an In(Ga)As QD for a time delay of 1.5 ns were performed, as shown in Fig.10. These measurements had to be performed with a less ideal beam splitter (BS) compared to the measurements of the GaAs QD. For this reason, a correction [56] was applied in order to estimate the real photon mode overlap:
VHOMreal = 1
(1−)2
T2+R2
2TR V meas
HOM, (10)
[image:15.612.188.427.221.347.2]where 1−=0.92(2)is the interference contrast,T =0.58(2)andR=1−Tare the transmission-and reflection coefficients of the BS, respectively, transmission-andVHOMmeas is is the measured HOM visibility.
Fig. 10.HOM interference measurements of the X (a) and XX (b) signals of a In(Ga)As QD with a photon delay of 1.5 ns. The HOM visibility values after correcting for the BS imperfections areVHOMX =57(4)% andVHOMXX =67(5)%.
Funding
H2020 European Research Council (679183); Austrian Science Fund (P29603); Seventh Framework Programme (601126); Central European Institute of Technology (7AMB17AT044); Horizon 2020 Framework Programme (731473); European Metrology Programme for Innovation and Research (17FUN06); Bundesministerium für Wissenschaft, Forschung und Wirtschaft (CZ 07 / 2017); Ministerstvo Školství, Mládeže a Tělovýchovy; QuantERA (Hyper-U-P-S); QuantERA (CUSPIDOR); Linz Institute of Technology (LIT); LIT Secure and Correct Systems Lab; Bayerisches Staatsministerium für Bildung und Kultus, Wissenschaft und Kunst; Deutsche Forschungsgemeinschaft (SCHN1376 5.1).
Acknowledgments
We thank H. Huang, K.D. Jöns, F. Basso Basset and M. Rota for fruitful discussions.
Disclosures
The authors declare no conflict of interest.
References
1. P. Senellart, G. Solomon, and A. White, “High-performance semiconductor quantum-dot single-photon sources,” Nat. Nanotechnol.12(11), 1026–1039 (2017).
2. M. Reindl, D. Huber, C. Schimpf, S. F. Covre, M. B. Rota, H. Huang, V. Zwiller, K. D. Jöns, A. Rastelli, and R. Trotta, “All-photonic quantum teleportation using on-demand solid-state quantum emitters,”Sci. Adv.4(12), eaau1255 (2018).
10. D. Miller, D. Chemla, and T. Damen, “Band-Edge Electroabsorption in Quantum Well Structures: The Quantum-Confined Stark Effect,”Phys. Rev. Lett.53(22), 2173–2176 (1984).
11. F. Lenzini, B. Haylock, J. C. Loredo, R. A. Abrahão, N. A. Zakaria, S. Kasture, I. Sagnes, A. Lemaitre, H. Phan, D. V. Dao, P. Senellart, M. P. Almeida, A. G. White, and M. Lobino, “Active demultiplexing of single photons from a solid-state source,”Laser Photonics Rev.11(3), 1600297 (2017).
12. C. Santori, D. Fattal, J. Vučković, G. S. Solomon, and Y. Yamamoto, “Indistinguishable photons from a single-photon device,”Nature419(6907), 594–597 (2002).
13. A. Berthelot, I. Favero, G. Cassabois, C. Voisin, C. Delalande, P. Roussignol, R. Ferreira, and J. Gérard, “Uncon-ventional motional narrowing in the optical spectrum of a semiconductor quantum dot,”Nat. Phys.2(11), 759–764 (2006).
14. A. V. Kuhlmann, J. H. Prechtel, J. Houel, A. Ludwig, D. Reuter, A. D. Wieck, and R. J. Warburton, “Transform-limited single photons from a single quantum dot,”Nat. Commun.6(1), 8204 (2015).
15. J. C. Loredo, N. A. Zakaria, N. Somaschi, C. Anton, L. De Santis, V. Giesz, T. Grange, M. A. Broome, O. Gazzano, G. Coppola, I. Sagnes, A. Lemaitre, A. Auffeves, P. Senellart, M. P. Almeida, and A. G. White, “Scalable performance in solid-state single-photon sources,”Optica3(4), 433–440 (2016).
16. H. Wang, Z. C. Duan, Y. H. Li, S. Chen, J. P. Li, Y. M. He, M. C. Chen, Y. He, X. Ding, C. Z. Peng, C. Schneider, M. Kamp, S. Höfling, C. Y. Lu, and J. W. Pan, “Near-Transform-Limited Single Photons from an Efficient Solid-State Quantum Emitter,”Phys. Rev. Lett.116(21), 213601 (2016).
17. A. Thoma, P. Schnauber, M. Gschrey, M. Seifried, J. Wolters, J. H. Schulze, A. Strittmatter, S. Rodt, A. Carmele, A. Knorr, T. Heindel, and S. Reitzenstein, “Exploring Dephasing of a Solid-State Quantum Emitter via Time- and Temperature-Dependent Hong-Ou-Mandel Experiments,”Phys. Rev. Lett.116(3), 033601 (2016).
18. X. Brokmann, M. Bawendi, L. Coolen, and J.-P. Hermier, “Photon-correlation Fourier spectroscopy,”Opt. Express
14(13), 6333–6341 (2006).
19. P. Michler, A. Imamoˇglu, M. Mason, P. Carson, G. Strouse, and S. Buratto, “Quantum correlation among photons from a single quantum dot at room temperature,”Nature406(6799), 968–970 (2000).
20. N. Akopian, N. H. Lindner, E. Poem, Y. Berlatzky, J. Avron, D. Gershoni, B. D. Gerardot, and P. M. Petroff, “Entangled photon pairs from semiconductor quantum dots,”Phys. Rev. Lett.96(13), 130501 (2006).
21. Z. Yuan, B. E. Kardynal, R. M. Stevenson, A. J. Shields, C. J. Lobo, K. Cooper, N. S. Beattie, D. A. Ritchie, and M. Pepper, “Electrically Driven Single-Photon Source,”Science295(5552), 102–105 (2002).
22. C. Heyn, M. Klingbeil, C. Strelow, A. Stemmann, S. Mendach, and W. Hansen, “Single-dot Spectroscopy of GaAs Quantum Dots Fabricated by Filling of Self-assembled Nanoholes,”Nanoscale Res. Lett.5(10), 1633–1636 (2010). 23. Y. H. Huo, A. Rastelli, and O. G. Schmidt, “Ultra-small excitonic fine structure splitting in highly symmetric quantum
dots on GaAs (001) substrate,”Appl. Phys. Lett.102(15), 152105 (2013).
24. M. Gurioli, Z. Wang, A. Rastelli, T. Kuroda, and S. Sanguinetti, “Droplet epitaxy of semiconductor nanostructures for quantum photonic devices,”Nat. Mater.18(8), 799–810 (2019).
25. L. Schweickert, K. D. Jöns, K. D. Zeuner, S. F. Covre Da Silva, H. Huang, T. Lettner, M. Reindl, J. Zichi, R. Trotta, A. Rastelli, and V. Zwiller, “On-demand generation of background-free single photons from a solid-state source,” Appl. Phys. Lett.112(9), 093106 (2018).
26. D. Huber, M. Reindl, Y. Huo, H. Huang, J. S. Wildmann, O. G. Schmidt, A. Rastelli, and R. Trotta, “Highly indistinguishable and strongly entangled photons from symmetric GaAs quantum dots,”Nat. Commun.8(1), 15506 (2017).
27. M. Reindl, J. H. Weber, D. Huber, C. Schimpf, S. F. C. da Silva, S. L. Portalupi, R. Trotta, P. Michler, and A. Rastelli, “Highly indistinguishable single photons from incoherently and coherently excited GaAs quantum dots,”Phys. Rev. B100(15), 155420 (2019).
28. M. Reindl, K. Joens, D. Huber, C. Schimpf, Y. Huo, V. Zwiller, A. Rastelli, and R. Trotta, “Phonon-assisted two-photon interference from remote quantum emitters,”Nano Lett.17(7), 4090–4095 (2017).
30. F. B. Basset, M. B. Rota, C. Schimpf, D. Tedeschi, K. D. Zeuner, S. F. C. da Silva, M. Reindl, V. Zwiller, K. D. Jöns, A. Rastelli, and R. Trotta, “Entanglement swapping with photons generated on-demand by a quantum dot,”Phys. Rev. Lett.123(16), 160501 (2019).
31. S. Maier, P. Gold, A. Forchel, N. Gregersen, J. Mørk, S. Höfling, C. Schneider, and M. Kamp, “Bright single photon source based on self-aligned quantum dot–cavity systems,”Opt. Express22(7), 8136–8142 (2014).
32. Y. M. He, Y. He, Y. J. Wei, D. Wu, M. Atatüre, C. Schneider, S. Höfling, M. Kamp, C. Y. Lu, and J. W. Pan, “On-demand semiconductor single-photon source with near-unity indistinguishability,”Nat. Nanotechnol.8(3), 213–217 (2013).
33. S. Gerhardt, J. Iles-Smith, D. P. S. McCutcheon, Y.-M. He, S. Unsleber, S. Betzold, N. Gregersen, J. Mørk, S. Höfling, and C. Schneider, “Intrinsic and environmental effects on the interference properties of a high-performance quantum dot single-photon source,”Phys. Rev. B97(19), 195432 (2018).
34. J. Liu, R. Su, Y. Wei, B. Yao, S. F. C. da Silva, Y. Yu, J. Iles-Smith, K. Srinivasan, A. Rastelli, J. Li, and X. Wang, “A solid-state source of strongly entangled photon pairs with high brightness and indistinguishability,”Nat. Nanotechnol.
14(6), 586–593 (2019).
35. M. Müller, S. Bounouar, K. D. Jöns, M. Glässl, and P. Michler, “On-demand generation of indistinguishable polarization-entangled photon pairs,”Nat. Photonics8(3), 224–228 (2014).
36. Y. Chen, M. Zopf, R. Keil, F. Ding, and O. G. Schmidt, “Highly-efficient extraction of entangled photons from quantum dots using a broadband optical antenna,”Nat. Commun.9(1), 2994 (2018).
37. H. Jayakumar, T. Huber, T. Kauten, A. Predojevic, G. S. Solomon, and G. Weihs, “Deterministic Photon Pairs and Coherent Optical Control of a Single Quantum Dot,”Phys. Rev. Lett.110(13), 135505 (2013).
38. M. Bayer, G. Ortner, O. Stern, A. Kuther, A. Gorbunov, A. Forchel, P. Hawrylak, S. Fafard, K. Hinzer, T. Reinecke, S. Walck, J. Reithmaier, F. Klopf, and F. Schäfer, “Fine structure of neutral and charged excitons in self-assembled In(Ga)As/(Al)GaAs quantum dots,”Phys. Rev. B65(19), 195315 (2002).
39. J. Iles-Smith, D. P. McCutcheon, A. Nazir, and J. Mørk, “Phonon scattering inhibits simultaneous near-unity efficiency and indistinguishability in semiconductor single-photon sources,”Nat. Photonics11(8), 521–526 (2017). 40. M. Abbarchi, F. Troiani, C. Mastrandrea, G. Goldoni, T. Kuroda, T. Mano, K. Sakoda, N. Koguchi, S. Sanguinetti, A.
Vinattieri, and M. Gurioli, “Spectral diffusion and line broadening in single self-assembled GaAsAlGaAs quantum dot photoluminescence,”Appl. Phys. Lett.93(16), 162101 (2008).
41. C. Simon and J. P. Poizat, “Creating single time-bin-entangled photon pairs,”Phys. Rev. Lett.94(3), 030502 (2005). 42. T. Huber, A. Predojevi, H. Zoubi, G. S. Solomon, and G. Weihs, “Measurement and modification of biexciton-exciton
time correlations,”Opt. Express21(8), 9890–9898 (2013).
43. F. Troiani, “Entanglement swapping with energy-polarization-entangled photons from quantum dot cascade decay,” Phys. Rev. B90(24), 245419 (2014).
44. J. H. Weber, B. Kambs, J. Kettler, S. Kern, J. Maisch, H. Vural, M. Jetter, S. L. Portalupi, C. Becher, and P. Michler, “Two-photon interference in the telecom C-band after frequency conversion of photons from remote quantum emitters,”Nat. Nanotechnol.14(1), 23–26 (2019).
45. J. H. Weber, J. Kettler, H. Vural, M. Müller, J. Maisch, M. Jetter, S. L. Portalupi, and P. Michler, “Overcoming correlation fluctuations in two-photon interference experiments with differently bright and independently blinking remote quantum emitters,”Phys. Rev. B97(19), 195414 (2018).
46. J. Aberl, P. Klenovský, J. S. Wildmann, J. Martín-Sánchez, T. Fromherz, E. Zallo, J. Humlíček, A. Rastelli, and R. Trotta, “Inversion of the exciton built-in dipole moment in In(Ga)As quantum dots via nonlinear piezoelectric effect,” Phys. Rev. B96(4), 045414 (2017).
47. P. Klenovský, P. Steindl, J. Aberl, E. Zallo, R. Trotta, A. Rastelli, and T. Fromherz, “Effect of second-order piezoelectricity on the excitonic structure of stress-tuned In(Ga)As/GaAs quantum dots,”Phys. Rev. B97(24), 245314 (2018).
48. J. P. Jahn, M. Munsch, L. Béguin, A. V. Kuhlmann, M. Renggli, Y. Huo, F. Ding, R. Trotta, M. Reindl, O. G. Schmidt, A. Rastelli, P. Treutlein, and R. J. Warburton, “An artificial Rb atom in a semiconductor with lifetime-limited linewidth,”Phys. Rev. B92(24), 245439 (2015).
49. O. Gazzano, T. Huber, V. Loo, S. Polyakov, E. B. Flagg, and G. S. Solomon, “Effects of resonant-laser excitation on the emission properties in a single quantum dot,”Optica5(4), 354–359 (2018).
50. T. Legero, T. Wilk, A. Kuhn, and G. Rempe, “Characterization of Single Photons Using Two-Photon Interference,” Adv. At. Mol. Opt. Phys.53, 253–289 (2006).
51. T. Heindel, C. Schneider, M. Lermer, S. H. Kwon, T. Braun, S. Reitzenstein, S. Höfling, M. Kamp, and A. Forchel, “Electrically driven quantum dot-micropillar single photon source with 34% overall efficiency,”Appl. Phys. Lett.
96(1), 011107 (2010).
52. C. L. Salter, R. M. Stevenson, I. Farrer, C. A. Nicoll, D. A. Ritchie, and A. J. Shields, “An entangled-light-emitting diode,”Nature465(7298), 594–597 (2010).
53. T. H. Chung, G. Juska, S. T. Moroni, A. Pescaglini, A. Gocalinska, and E. Pelucchi, “Selective carrier injection into patterned arrays of pyramidal quantum dots for entangled photon light-emitting diodes,”Nat. Photonics10(12), 782–787 (2016).