Stem-loop binding protein is a multifaceted cellular regulator of
HIV-1 replication
Ming Li, … , Michelle A. Lally, Bharat Ramratnam
J Clin Invest. 2016;126(8):3117-3129. https://doi.org/10.1172/JCI82360.
A rare subset of HIV-1–infected individuals is able to maintain plasma viral load (VL) at low levels without antiretroviral treatment. Identifying the mechanisms underlying this atypical response to infection may lead to therapeutic advances for treating HIV-1. Here, we developed a proteomic analysis to compare peripheral blood cell proteomes in 20 HIV-1–infected individuals who maintained either high or low VL with the aim of identifying host factors that impact HIV-1 replication. We determined that the levels of multiple histone proteins were markedly decreased in cohorts of individuals with high VL. This reduction was correlated with lower levels of stem-loop binding protein (SLBP), which is known to control histone metabolism. Depletion of cellular SLBP increased promoter engagement with the chromatin structures of the host gene high mobility group protein A1 (HMGA1) and viral long terminal repeat (LTR), which led to higher levels of HIV-1 genomic integration and proviral transcription. Further, we determined that TNF-α regulates expression of SLBP and observed that plasma TNF-α levels in HIV-1–infected individuals correlated directly with VL levels and inversely with cellular SLBP levels. Our findings identify SLBP as a potentially important cellular regulator of HIV-1, thereby establishing a link between histone metabolism, inflammation, and HIV-1 infection.
Research Article AIDS/HIV
Find the latest version:
The Journal of Clinical Investigation
R E S E A R C H A R T I C L EIntroduction
HIV-1 becomes a newly acquired genetic locus upon integration into the human genome. Efforts to eradicate HIV-1 have been frustrated by the genomic persistence of replication-competent provirus despite promptly initiated and prolonged, potent antiretroviral therapy. In a subset of infected individuals (~1%), viral transcription from this locus is low to absent even in activated CD4+ T lymphocytes that have
the capacity to harbor productive infection (1, 2). These individuals are referred to as elite or viremic controllers, the latter having low lev-els of plasma viremia (<2,000 copies/ml) and the former consistently maintaining levels below the limit of detection of current assays.
Individuals with atypical responses to HIV-1 infection have been intensively studied with the hope that the discovery of under-lying mechanisms can be harnessed for therapeutic and preventive advances. Perhaps the most striking example is the identification of HIV-1 coreceptor CCR5. Certain individuals with mutated CCR5 are resistant to HIV-1 infection despite high-risk behaviors (3, 4). Pharmacologic inhibitors of CCR5 have emerged as a component
of multidrug regimens for the treatment of infected individuals (5). More recently, elegant genome-wide association studies of control-ler cohorts point to immune-based mechanisms of viral control (6). For example, polymorphisms in the HLA class I locus, especially in the region of HLAB and HLAC, are associated with slower disease progression (7, 8). Other immunologic factors are also likely involved, implicating arms of both adaptive and innate immunity, but with less consistent correlations with HIV-1 disease phenotype (9–11), pointing to the underlying complexity of the viral/host relationship (12, 13).
HIV-1 depends on the host cellular machinery to support its replication, rendering the host proteome a major determinant of viral infection. Well-known HIV-1 cellular cofactors operating at the postentry level include lens epithelium-derived growth factor (LEDGF, also known as p75; essential for HIV-1 genomic integra-tion) (14, 15), positive transcription elongation factor (P-TEFb; important for HIV-1 transcription) (16, 17), and tetherin (which inhibits the release of progeny virions) (18). Recent genome-wide siRNA screens (19–21) and other systemic approaches (22, 23) have identified numerous HIV-1–related host factors, but few of the identified factors appear to be differentially expressed accord-ing to disease burden. One exception appears to be SAM domain– and HD domain–containing protein 1 (SAMHD1), which depletes A rare subset of HIV-1–infected individuals is able to maintain plasma viral load (VL) at low levels without antiretroviral
treatment. Identifying the mechanisms underlying this atypical response to infection may lead to therapeutic advances for treating HIV-1. Here, we developed a proteomic analysis to compare peripheral blood cell proteomes in 20 HIV-1–infected individuals who maintained either high or low VL with the aim of identifying host factors that impact HIV-1 replication. We determined that the levels of multiple histone proteins were markedly decreased in cohorts of individuals with high VL. This reduction was correlated with lower levels of stem-loop binding protein (SLBP), which is known to control histone metabolism. Depletion of cellular SLBP increased promoter engagement with the chromatin structures of the host gene high mobility group protein A1 (HMGA1) and viral long terminal repeat (LTR), which led to higher levels of HIV-1 genomic integration and proviral transcription. Further, we determined that TNF-α regulates expression of SLBP and observed that plasma TNF-α levels in HIV-1–infected individuals correlated directly with VL levels and inversely with cellular SLBP levels. Our findings identify SLBP as a potentially important cellular regulator of HIV-1, thereby establishing a link between histone metabolism, inflammation, and HIV-1 infection.
Stem-loop binding protein is a multifaceted cellular
regulator of HIV-1 replication
Ming Li,1,2 Lynne D. Tucker,1,2 John M. Asara,3 Collins K. Cheruiyot,1,2 Huafei Lu,1,2 Zhijin J. Wu,4 Michael C. Newstein,5
Mark S. Dooner,6 Jennifer Friedman,7,8 Michelle A. Lally,2,9,10 and Bharat Ramratnam1,2,10,11,12
1Laboratory of Retrovirology, Division of Infectious Diseases, Department of Medicine, Warren Alpert Medical School of Brown University, Providence, Rhode Island, USA. 2Division of Infectious Diseases,
Department of Medicine, The Miriam Hospital and Rhode Island Hospital, Providence, Rhode Island, USA. 3Division of Signal Transduction, Beth Israel Deaconess Medical Center and Department of Medicine,
and Harvard Medical School, Boston, Massachusetts, USA. 4Department of Biostatistics, Brown University, Providence, Rhode Island, USA. 5Department of Medicine, Milford Regional Medical Center, and
University of Massachusetts Medical School, Milford, Massachusetts, USA. 6Division of Hematology and Oncology, Department of Medicine, Rhode Island Hospital, and Warren Alpert Medical School of
Brown University, Providence, Rhode Island, USA. 7Center for International Health Research, Rhode Island Hospital, Providence, Rhode Island, USA. 8Department of Pediatrics, Rhode Island Hospital, and
Warren Alpert Medical School of Brown University, Providence, Rhode Island, USA. 9Providence Veterans Affairs Medical Center, Providence, Rhode Island, USA. 10Lifespan/Tufts/Brown Center for AIDS
Research, Providence, Rhode Island, USA. 11COBRE Center for Cancer Research, Rhode Island Hospital, and Warren Alpert Medical School of Brown University, Providence, Rhode Island, USA. 12Clinical Research Center of Lifespan, Providence, Rhode Island, USA.
Conflict of interest: The authors have declared that no conflict of interest exists.
Submitted: April 15, 2015; Accepted: May 26, 2016.
The Journal of Clinical Investigation
R E S E A R C H A R T I C L E
Results
Supplemental Results are available online with this article; doi:10.1172/JCI82360DS1.
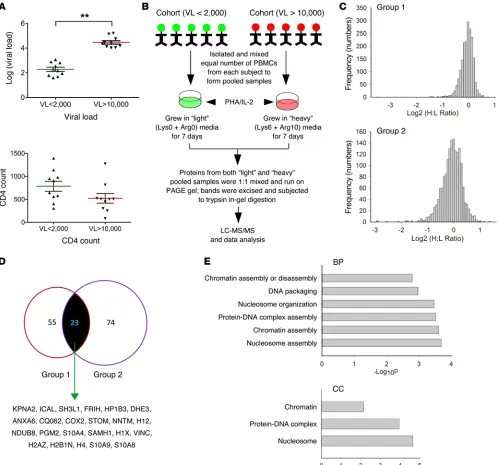
Proteomic characterization of patient samples. We began by
studying individuals with chronic HIV-1 infection who were not the pool of nucleotides available for viral cDNA synthesis, thereby
[image:3.585.39.537.56.521.2]acting to inhibit viral replication (24). SAMHD1 is expressed at higher levels in a subset of elite controllers (25). Here, we used a reverse proteomic strategy to identify host factors that were differ-entially expressed according to HIV-1 plasma burden.
The Journal of Clinical Investigation
R E S E A R C H A R T I C L Eteomes of the cohorts according to VL category. A total of 3,068 and 3,190 unique proteins were identified (Supplemental Table 2) from the 2 groups, respectively. Before in-depth analysis, we plot-ted log2 transformed “heavy”/“light” ratios of all proteins from the 2 groups. The normal distribution of protein ratios indicated that our experimental techniques did not produce bias (Figure 1C). Significantly up- and downregulated protein candidates were iden-tified by first calculating the cutoff values for the first (>1.61 and <0.58) and second groups of data (>2.13 and <0.43) (Supplemental receiving antiretroviral medication. We recruited 10 subjects with
viral load (VL) less than 2,000 copies/ml (VLlow) and 10 subjects
with viral load greater than 10,000 copies/ml (VLhigh) (Figure 1A
and Supplemental Table 1). We randomly divided the subjects into 2 groups (each containing 5 blindly chosen individuals with high and low VL) and initially used a cohort-based analytic approach to mini-mize interindividual proteomic variations.
Using techniques based on Stable Isotope Labeling by Amino acids in Cell culture (SILAC) (Figure 1B), we compared the
[image:4.585.84.496.59.513.2]The Journal of Clinical Investigation
R E S E A R C H A R T I C L E
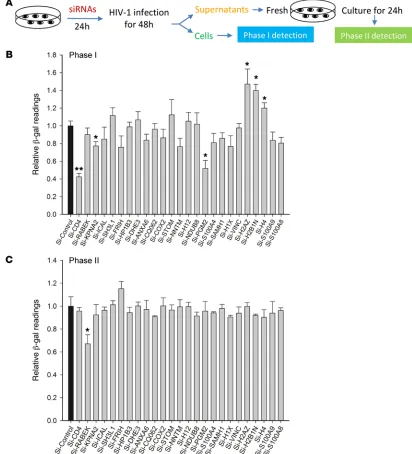
2A) comprised TZM-bl cells with a stably integrated HIV-1 long ter-minal repeat (LTR) upstream of the indicator β-gal. Viral challenge leads to HIV-1 tat-mediated engagement of the LTR, resulting in increased β-gal activity, thereby broadly assessing the effect of bio-logic interventions on steps of the viral life cycle from cellular entry to genomic integration and transcription (phase I). We used RNAi to deplete each of the 23 identified proteins in TZM-bl cells. The SMARTpool siRNA treatments typically achieved approximately 80% depletion efficacy on most of the candidates (Supplemental Figure 1). RNAi treatments had no significant effect on cell surviv-al or proliferation (Supplementsurviv-al Figure 2). As seen in Figure 2B, of the 23 candidates, depletion of 5 host proteins led to significant phase I effects (P < 0.05). Among them, the depletion of KPNA2 and phosphoglucomutase-2 (PGM2) led to approximately 20% (P < 0.05) and 45% (P < 0.05) lower β-gal activity, respectively. Notably, depletion of all candidate histones except H1X and H12 led to between 20% and 45% (P < 0.05) increase in β-gal activity. We confirmed these results using 4 independent siRNAs for each of the 5 significant hits (KPNA2, PGM2, H2AZ, H2B1N, and H4) (Sup-plemental Figure 3). We next addressed whether any of the candi-date proteins affected viral infectivity. Culture supernatants from siRNA-treated cells were p24-adjusted and applied to new TZM-bl cells, and β-gal activity was measured (phase II). The supernatants derived from the cells with individually depleted proteins did not produce significant changes in β-gal readings in recipient cells (Fig-ure 2C and Supplemental Fig(Fig-ure 4). These results likely reflected Table 3). The stringency of identification was increased by
requir-ing that each protein associated with at least 2 unique peptides. Using these filters, a total of 55 and 74 differentially expressed pro-tein candidates were assigned to the 2 groups, respectively (Sup-plemental Table 4). We merged these independent data and iden-tified a total of 23 proteins that were shared by both groups (Figure 1D and Supplemental Table 5). Of these 23 candidates, Database for Annotation, Visualization and Integrated Discovery (DAVID) analyses revealed significant enrichment (P < 0.05) of nucleosome assembly–related biologic processes and nucleosome or chromatin cellular components (Figure 1E and Supplemental Table 6).
Identification of HIV-1–related host factors. The first indication
that our experimental methodology was capable of identifying bona fide HIV-1–related host factors came from mining the HIV-1 Human Interaction Database (26). Of the 23 identified proteins, 8 had been previously associated with HIV-1 (Supplemental Table 5). For example, the HIV-1 restriction factor SAMHD1 (27) was expressed at lower levels in VLhigh. In contrast, karyopherin subunit α2 (KPNA2), which facilities the nuclear entry of the viral preinte-gration complex (28), was overexpressed in VLhigh. Vinculin (29),
ferritin (30), and 4 histones, histone H12 (31), histone H2AZ (32), histone H2B1N (33), and histone H4 (34), were all underexpressed in VLhigh. To determine which of the candidate proteins had a direct
[image:5.585.41.543.55.307.2]effect on the HIV-1 life cycle, we used a 2-phase reporter assay that allowed us to assess the impact of RNAi-mediated depletion of each candidate protein on HIV-1 replication. The reporter assay (Figure
The Journal of Clinical Investigation
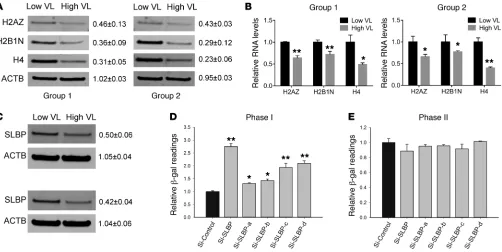
R E S E A R C H A R T I C L Eapproximately 50% to 70% in the VLhigh compared with the VLlow
cohort. RT-PCR profiling revealed an approximately 30% to 55% (P < 0.05) reduction among the VLhigh cohort (Figure 3B). The
mechanism of simultaneous underexpression of multiple histones in VLhigh was at first perplexing. Interestingly, histones share a
unique feature in that their mRNAs end with a 3′ stem-loop struc-ture rather than the ubiquitous poly-A tail (35). Stem-loop binding the complexity of virion biogenesis involving the activity of
multi-ple human proteins with high levels of redundancy (19).
Stem-loop binding protein serves as a histone-related HIV-1 host factor. Notably, among the 5 significant candidates identified in
[image:6.585.50.537.54.492.2]phase I, 3 were histones. We first validated the mass spectrome-try–based quantifications by Western blot profiling of the original samples. As seen in Figure 3A, histone protein levels were reduced
The Journal of Clinical Investigation
R E S E A R C H A R T I C L E
protein (SLBP) is known to bind to the stem-loop structure and is involved in stabilizing mature histone mRNAs as well as regulating their transport and translation (36, 37). In cell culture, RNAi-me-diated reduction of SLBP led to decreased expression of histone candidates at both protein and mRNA levels (Supplemental Figure 5 and summarized in Supplemental Table 7). The close correlation between histone and SLBP prompted us to profile SLBP expression in our original cohorts by Western blot; we documented approxi-mately 50% underexpression in both VLhigh groups (Figure 3C). We
next measured the effect of SLBP reduction on the viral life cycle
[image:7.585.56.509.56.491.2]The Journal of Clinical Investigation
R E S E A R C H A R T I C L ESupernatants (p24-adjusted), derived from SLBP-depleted and HIV-1–infected cells, did not produce significant changes in β-gal readings in new recipient cells in phase II of our assay (Figure 3E). Importantly, to discount the possibility that histone and SLBP reduction was merely a consequence of the stress of cellular HIV-1 infection, we also profiled its expression in infected and uninfect-ed primary mononuclear cells. Neither HIV-1 infection nor the cul-ture conditions that we used impacted histone/SLBP expression levels (Supplemental Figure 8).
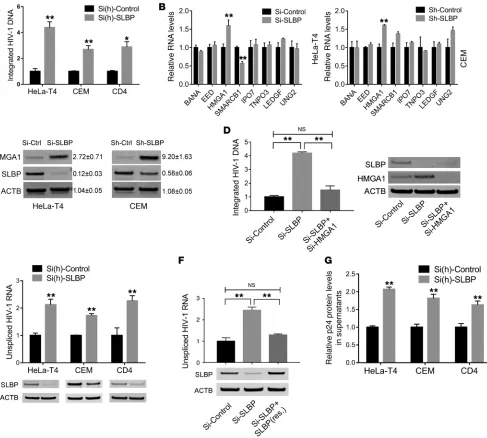
SLBP depletion increases HIV-1 integration and replication. Life
cycle–specific assays revealed that SLBP depletion had the most marked effect on integration and transcription. We used Alu-PCR to quantify levels of integrated provirus and observed an approximately 4-fold increase in HIV-1 integration levels at 48 hours after infection (P < 0.01) in SLBP-depleted HeLa-T4 cells. Similarly, SLBP depletion led to a significant (P < 0.01) increase of HIV-1 integration in lymphocytic CEM cells and primary CD4+
[image:8.585.71.506.59.453.2]The Journal of Clinical Investigation
R E S E A R C H A R T I C L E
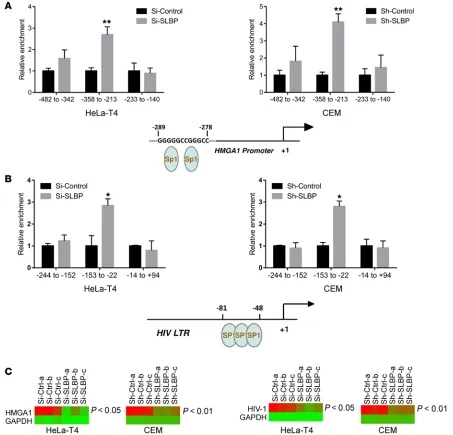
By performing Formaldehyde-Assisted Isolation of Regulatory Ele-ments (FAIRE) (50) assay, we found that SLBP depletion did not significantly change the abundance of active regulatory elements, suggesting that large-scale chromatin alteration by SLBP depletion was not contributing to its HIV-1–centric effects (Supplemental Fig-ure 15). We next explored whether SLBP depletion induced a chro-matin effect(s) on a more localized, HIV-1–centric basis and altered the binding of specific HMGA1 and HIV-1 LTR transcription factors such as SP1 (51, 52). ChIP assays revealed significantly higher SP1 binding to the HMGA1 promoter at the region of –358 to –213 in both SLBP-depleted HeLa-T4 and CEM cells (Figure 5A). ChIP assays on SLBP-depleted and virus-challenged cells revealed an approxi-mately 3-fold increase in SP1 binding to the HIV-1 LTR regions –153 to –22 (Figure 5B) in both SLBP-depleted HeLa-T4 and CEM cells. SLBP depletion had no effect on the SP1 expression itself, regardless of HIV-1 infection (Supplemental Figures 16 and 17). This prompt-ed us to assess the chromatin structure and local accessibility of
HMGA1 and HIV-1 promoters. As seen in Figure 5C, SLBP depletion
was indeed associated with significantly (P < 0.05) higher accessi-bility of both HMGA1 and HIV-1 promoters in both HeLa-T4 and CEM cells. These results partially explained our ChIP findings in which we observed higher transcription of both HMGA1 and HIV-1 without higher levels of active regulatory elements and enhanced expression of the transcription factor SP1.
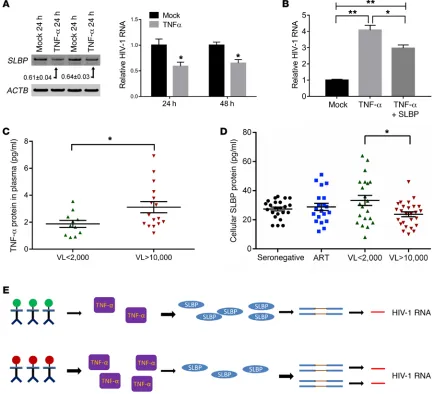
TNF-α downregulates SLBP expression. Our results thus far
indicated that manipulations of SLBP protein levels altered HIV-1 replication dynamics. We subjected cells to a variety of stresses (e.g., activation, drug and cytokine treatment) known to render cells more susceptible to HIV-1 infection and quantified levels of SLBP. Surprisingly, TNF-α treatment led to reduction of SLBP protein and RNA levels by approximately 40% (Figure 6A). Treat-ment of CEM cells with TNF-α with subsequent HIV-1 infection led to approximately 4-fold (P < 0.01) increase of HIV-1 unspliced RNA levels, consistent with previous reports (51). Compared with TNF-α–treated cells, forced supraphysiologic expression of SLBP in TNF-α–treated cells blunted the proinflammatory effects with a significant reduction of HIV-1 unspliced RNA levels by approx-imately 30% (P < 0.05) (Figure 6B). We next asked whether a TNF-α/SLBP/HIV-1 circuit was operational in vivo. We compared plasma levels of TNF-α in subjects with low versus high VL. As seen in Figure 6C, plasma levels of TNF-α were significantly higher (P < 0.05) in the high-VL group. Conversely, SLBP levels were approximately 40% (P < 0.05) higher in the low-VL versus the high-VL group (Figure 6D). This prompted us to quantify SLBP lev-els in 2 additional cohorts of 43 individuals with low to undetect-able levels of plasma TNF-α: seronegative individuals and those treated with suppressive antiretroviral medications (53). As seen in Figure 6D, SLBP levels in both of these cohorts were similar to that observed in the low-VL group, supporting the link between plasma TNF-α levels and intracellular SLBP protein expression.
Discussion
The genomic persistence of replication-competent HIV-1 is a sub-stantial barrier to curing infection. While strategies aimed at achiev-ing complete eradication of provirus are beachiev-ing developed and test-ed, most agree that this is a daunting challenge. Another approach has been to identify and therapeutically implement the components mine the underlying mechanism, we surveyed a panel of 8 host
factors, all known to be important for viral integration, including barrier to autointegration factor 1 (BANF1) (38), polycomb protein EED (39), high mobility group protein A1 (HMGA1) (40), SWI/ SNF-related matrix-associated actin-dependent regulator of chro-matin subfamily B member 1 (SMARCB1) (41), importin-7 (IPO7) (42), transportin-3 (TNPO3) (43), LEDGF (44), and uracil-DNA glycosylase (UNG2) (45). Their RNA expression was compared between SLBP-depleted and matched control HeLa-T4 and CEM cells. Among them, only HMGA1 consistently had a significantly higher expression (P < 0.01) in both RNA (Figure 4B) and protein (Figure 4C) levels upon SLBP depletion. As a component of pre-integration complexes, HMGA1 facilitates HIV-1 pre-integration by stimulating integrase activity (40). Interestingly, HMGA1 overex-pression (Supplemental Figure 9) led to an approximately 2.6-fold increase (P < 0.01) in HIV-1 integration level. To determine wheth-er HMGA1 increase following SLBP depletion was mechanistically responsible for increased HIV-1 integration, we subjected cells to simultaneous SLBP and HMGA1 depletion. Compared with SLBP depletion, double depletion significantly decreased HIV-1 inte-gration with levels approaching those in the nontargeting control (Figure 4D). Recall that our initial TZM-bl reporter assay also sug-gested increased proviral transcription upon SLBP depletion. This was directly borne out by a series of experiments in which we used siRNA against SLBP and found an approximately 2-fold (P < 0.01) increase of unspliced HIV-1 RNA at 48 hours after infection in HeLa-T4 cells. A similar pattern of upregulation of RNA expression was also observed in SLBP-depleted CEM cells and primary CD4+
T lymphocytes (Figure 4E). We further validated SLBP-mediated effects on viral replication by introducing a mutated form of SLBP (resistant to siRNA degradation but encoding functional SLBP protein; Supplemental Figure 10) into SLBP siRNA–transfected HeLa-T4 cells. As expected, provision of exogenous siRNA-resis-tant SLBP to SLBP-depleted cells abrogated approximately 80% (P < 0.01) of the effects of SLBP depletion on HIV-1 RNA increase (Figure 4F). SLBP depletion also led to a significant increase (~1.6- to 2.1-fold) in HIV-1 p24 levels in supernatants of virus-challenged HeLa-T4 and CEM cells and primary CD4+ T lymphocytes
(Fig-ure 4G). SLBP depletion had no impact on HIV-1 binding, reverse transcription, or the expression of key host factors involved in viral budding (Supplemental Figures 11–13).
SLBP depletion increases HMGA1 and HIV-1 promoter accessibility.
The Journal of Clinical Investigation
R E S E A R C H A R T I C L Emedium, designated as “heavy” medium (containing 10% dialyzed FBS and supplemented with 100 mg/l [U-13C6]-l-lysine, 100 mg/l [U-13C6,15N4]-l-arginine, and 1X l-glutamine; Thermo Fisher Sci-entific). Similarly, 5 million PBMCs from each subject with VL less than 2,000 copies/ml were also pooled and then labeled as VLlow.
These cells were maintained in RPMI-1640 medium (Thermo Fisher Scientific), designated as “light” medium (containing 10% dialyzed FBS and supplemented with 100 mg/l l-lysine, 100 mg/l l-arginine, and 1X l-glutamine; Thermo Fisher Scientific). These steps were then repeated using a second group of pooled samples from different indi-viduals with comparable high and low viral loads.
Protein extraction and preparation
Expanded “heavy” and “light” cells were each spun down at 200 g for 10 minutes. Cells were washed once with cold PBS before mixing with CelLytic M reagent (MilliporeSigma) for 15 minutes on a shaker. The supernatant containing total protein extract was collected after 10 minutes of centrifugation at 12,800 g. Protein concentrations from both “heavy” and “light” cells were determined by Micro BCA Protein Assay Kit (Thermo Fisher Scientific). “Heavy” (2 μg) and “light” (2 μg) protein samples were mixed 1:1 before running on NuPAGE 4%–12% Bis-Tris Precast Gel (Thermo Fisher Scientific) using an XCell Sure-Lock Mini-Cell (Thermo Fisher Scientific). The gel was stained by SimplyBlue SafeStain (Thermo Fisher Scientific). The entire sample lane from the destained gel was cut into 15 equal gel pieces for frac-tionation. Each piece was washed 3 times with 50% acetonitrile/50% HPLC-grade water before mass spectrometric analysis.
Mass spectrometry and quantitative analysis
Gel pieces were washed, reduced with DTT, and alkylated with iodo-acetamide. Gels were then digested with modified trypsin (Promega) at pH 8.3 overnight at 37°C with shaking. The resulting peptide mix-tures from each gel piece were analyzed separately by data-depen-dent microcapillary reversed-phase liquid chromatography tandem mass spectrometry (LC-MS/MS). LC-MS/MS was performed using an EASY-nLC nanoflow HPLC (Thermo Fisher Scientific) with a self-packed 75 μm ID × 15 cm C18 column in buffer A (0.1% formic acid in water) coupled to an LTQ-Orbitrap XL mass spectrometer (Ther-mo Fisher Scientific) using an MS-Fourier Transform target value of 5.05 and an MS/MS-Ion Trap target value of 3.04 in data-dependent
acquisition (DDA)/positive ion mode. The LC gradient was produced over 60 minutes from 2% B to 38% B. Buffer B contained acetonitrile. LC/MS-grade solvents were used. The full scan range was acquired between 390 m/z and 1,500 m/z at 30,000 resolution using a Top5 DDA method via collision-induced dissociation (CID). Precursor ions were excluded for a duration of 2 minutes. Nano-ESI spray voltage of +3 kV was used without sheath or auxiliary flow gas. The ion count threshold for MS/MS selection was 700 counts. Activation time and Q values were set as default. Generated MS/MS spectra were searched against the reversed and concatenated nonredundant Human Inter-national Protein Index database (version 3.68) using Mascot (version 2.2; Matrix Science). Mascot searches used the fixed modification of carbamidomethyl Cys and variable modifications of oxidation of Met and acetylation of protein N-terminus. Two missed cleavages and trypsin with Proline restriction were used during the searches, and a minimum of 6 amino acid residues were allowed. An MS tolerance of 30 ppm and MS/MS tolerance of 0.8 Da were used during Mascot
of a functional cure. A functional cure implies the continued exis-tence of integrated virus but one that has been rendered nonpatho-genic by immune, genetic, or pharmacologic means. HIV-1–infected individuals who are able to control viral replication without antiret-roviral therapy — that is, elite controllers — are an extreme example of individuals living a functional cure. An important caveat is that even though individuals may be able to completely suppress viral replication, a fraction appears to lose viral control with time, and others appear to be at higher risk of developing illnesses associated with prolonged inflammation (54). Nevertheless, detailed studies of atypical viral resistance/control have shed light on basic issues of HIV-1 pathogenesis that have been subsequently mined for thera-peutic advances (e.g., development of anti-CCR5 drugs).
Here, we set out to determine whether autonomous HIV-1 con-trol was associated with a distinct protein signature. We found that 23 proteins were differentially expressed among individuals with high versus low VL, with histones constituting the largest class. This prompted us to focus on SLBP with its known ability to regulate his-tone expression. We found that SLBP exerted a multidimensional effect on HIV-1 and that SLBP is relatively underexpressed among individuals with high VL versus low VL. SLBP depletion leads to increased HIV-1 integration and viral replication. Although the effects are similar to those induced by HDACIs such as suberoy-lanilide hydroxamic acid, we found that acetylation did not play a role in SLBP-induced HIV-1 activation. Rather, SLBP regulates HIV-1 expression by controlling histone metabolism and affecting the accessibility of not only the HIV-1 promoter but also that of the gene encoding HMGA1 that is involved in HIV-1 integration.
Most would agree that endogenous HIV-1 control is largely immunologically based as recent studies indicate (6–11), and our data do not suggest that SLBP protein levels singularly confer con-troller status. Rather, our work found an unexpected circuit that links TNF-α to SLBP expression in vivo. This allowed us to charac-terize the effects of proinflammatory stimuli on the HIV-1–centric cellular scaffold. These observations provide insight into HIV-1 acquisition and disease progression. For example, sexually trans-mitted bacterial and viral infections (STIs) are known to increase HIV-1 susceptibility and replication by their upregulation of proin-flammatory cytokines such as TNF-α (55). It is conceivable that STI-induced TNF-α may lead to decreased SLBP expression in mucosal lymphocytes, thereby increasing HIV-1 cellular suscepti-bility and replication (Figure 6E). A similar dynamic may also be implicated in the natural history of untreated HIV-1 disease with high levels of inflammation ensuring the continued infection of CD4+ T lymphocytes. In summary, SLBP links the processes of
inflammation, histone metabolism, and HIV-1–centric chromatin accessibility and operates in vivo as an HIV-1–related host regula-tory factor.
Methods
Supplemental Methods are available online with this article; doi:10.1172/JCI82360DS1.
Labeling of cells
The Journal of Clinical Investigation
R E S E A R C H A R T I C L E
cells. After transfection, cells were incubated in a humidified 37°C/5% CO2 incubator for 24–48 hours before analysis of gene expression.
β-Gal assay
β-Glo Assay System (Promega) was used to quantify β-gal activity on transfected/infected TZM-bl cells (PTA-5659; ATCC), a HeLa cell line that has integrated luciferase and β-gal genes under control of the HIV-1 promoter, by following the manufacturer’s instructions. Briefly, culture supernatants were removed and 200 μl lysis buffer was added to each well and incubated for 5 minutes at room temperature to allow complete cell lysis. One hundred microliters of the cell lysate was then transferred to a white 96-well Costar microwell plate, and a volume of β-Glo reagent equal to that of the cell lysate was added before mea-surement of the luminescence using a TopCount NXT Microplate Scintillation and Luminescence Counter (PerkinElmer) and a Spectra-Max M5 (Molecular Devices).
Real-time PCR
Total RNA was extracted using TRIzol (Thermo Fisher Scientific) fol-lowing standard protocols. The concentrations of all RNA samples were determined by spectrophotometry. An equal amount of total RNA was used for reverse transcription and PCR, which was carried out on a Mastercycler gradient 5331 (Eppendorf) using Maxima First Strand cDNA Synthesis Kit (Thermo Fisher Scientific). Primers were designed using PrimerQuest online tools available at http://www.idtdna.com/ Primerquest/Home/Index. Primer sequences are provided in Supple-mental Table 9. Real-time PCR was performed on Mastercycler ep real-plex (Eppendorf). All reactions were performed in 96-well plates with the following reagents in a final volume of 20 μl: 1 μl of primers (5 μM each for forward and reverse) and 2X Maxima SYBR Green qPCR Mas-ter Mix from Thermo Fisher Scientific. Ten nanograms of cDNA was added to this mixture. Triplicate reactions of the target and housekeep-ing genes were performed simultaneously for each cDNA template analyzed. The PCR reaction consisted of an initial enzyme activation step at 95°C for 10 minutes, followed by 40 cycles of 95°C for 15 sec-onds and 60°C for 1 minute. A threshold cycle (Ct) value was obtained for each sample, and triplicate sample values were averaged. The 2–ΔΔCt
method was used to calculate relative expression of each target gene.
Western blotting
Cellular protein was harvested, quantified by Micro BCA assay, and run on NuPAGE 4% to 12% Bis-Tris Precast Gel (Thermo Fisher Sci-entific) using an XCell SureLock Mini-Cell (Thermo Fisher Scientif-ic). After electrophoresis, the resolved proteins were transferred onto PVDF membrane using an iBlot Dry Blotting System (Thermo Fisher Scientific). Upon completion of the transfer, membranes were blocked for 1 hour before addition of antibodies to specific proteins (Supple-mental Table 10) and incubation overnight at 4°C. Finally, proteins were detected and analyzed by Odyssey CLx Infrared Imaging System (LI-COR) after incubation with IRDye 680LT- and 800CW-conjugat-ed secondary antibodies for 30 minutes follow800CW-conjugat-ed by 4-time PBS with 0.1% Tween 20 washes.
Quantification of HIV-1 integration by Alu-gag PCR
DNA was extracted by Genomic DNA Purification Kit (Thermo Fisher Scientific) from HIV-1–infected cells. DNA concentration was deter-mined by SmartSpec Plus (Bio-Rad) spectrophotometer. An equal searches. The peptide and protein FDR was set at 1%. Protein
quan-titation was achieved with MaxQuant software (version 1.0.13.13; http://www.maxquant.org) requiring at least 2 peptides per protein (1 razor and 1 unique) for quantitation. Normalized “heavy”/“light” (H/L) ratios were used for all subsequent interpretation.
Bioinformatic analysis
Protein quantitation. Two prerequisites were applied to ensure
great-er confidence in the accuracy of the MS-dgreat-erived peptide ratios: (a) Two or more quantifiable peptides were required to be associated with a given protein. (b) In order to determine significantly up- and downregulated protein candidates, conservative cutoff values were calculated as follows: median and SD (σ) of normalized H/L ratios were calculated using log-transformed data of all quantified pro-teins. The cutoff of value (median ± 2σ) was calculated in log space that was then transformed back into linear space. All identification and quantitation were also manually inspected using previously pub-lished methodologies (56–58).
Histogram of H/L ratio distribution. Normalized H/L ratios of all
quantified proteins were log2 transformed, and plotted using Sigma-Plot (version 12.5; Systat Software).
DAVID analysis. To find significantly overrepresented gene
ontol-ogy terms, Database for Annotation, Visualization and Integrated Discovery (DAVID, version 6.7; http://david.abcc.ncifcrf.gov) analy-sis was used (59), and functional annotation charts were created with default settings.
HIV-1/host protein network analysis. The most recent (November
2015) HIV-1/human protein interaction database (http://www.ncbi. nlm.nih.gov/genome/viruses/retroviruses/hiv-1/interactions/) (26) was manually examined to identify species shared by the data-base and our MS-generated results. The datadata-base contains 3,592 human proteins, which have been reported to interact with proteins encoded by HIV-1.
Cell culture, HIV-1 challenge, and p24 quantification
HeLa-T4 (#154, NIH AIDS Reagent Program), a human cervical epithelial carcinoma cell line modified to stably express CD4 and CXCR4, was used as a preliminary screening tool. It was maintained in DMEM supplemented with 10% FBS and antibiotics. CEM cells (CCL-119; American Type Culture Collection [ATCC]), a T lympho-blastoid cell line derived from human leukemia, was used to validate significant findings. It was grown in RPMI-1640 medium with 10% FBS and antibiotics. Purified CD4+ cells (2W-200; Lonza) were also
used to verify key findings. They were grown in LGM-3 medium with 10% FBS (Lonza). All cells were subsequently infected by HIV-1NL4-3 (starting with ~10 × 103 TCID
50 (50% tissue culture infective dose) per
million cells; Malcolm Martin, NIH AIDS Reagent Program) for 48 hours. Infection was monitored by p24 quantification in culture super-natants with Alliance HIV-1 p24 Antigen ELISA kit from PerkinElmer.
siRNAs and cell transfection
The Journal of Clinical Investigation
R E S E A R C H A R T I C L Eresults were further analyzed by EpiQ Chromatin Kit Data Analysis Tool (version 1.1.18.0915). The final chromatin accessibility values were imported to Heatmap Builder (version 1.0; Stanford) for visual-ization (62).
TNF-α and SLBP expression analysis in subjects
Plasma samples from 27 study subjects (based on availability) were used to determine TNF-α expression in HIV-1–infected patients. Among them, 11 study subjects with VL less than 2,000 were assigned to the low-VL group, while 16 subjects with VL greater than 10,000 were assigned to the high-VL group (Supplemental Table 11). TNF-α
protein levels were quantified by TNF-α Human Ultrasensitive ELISA Kit (Thermo Fisher Scientific) from 100 μl plasma of each subject. PBMC samples from 90 study subjects were used to determine SLBP expression in vivo. Among them, 21 study subjects with VL less than 2,000 were assigned to the low-VL group, 26 subjects with VL greater than 10,000 were assigned to the high-VL group, 20 subjects under antiretroviral therapy for at least 1 year were assigned to the antiret-roviral therapy group, and 23 healthy donors were assigned to the seronegative group (Supplemental Table 12). SLBP protein levels were determined by SLBP ELISA kit (MyBioSource) from protein extracts obtained from 250,000 cells of each subject.
Statistics
For in vitro samples, all data were based on 3 technical replicates with-in at least 3 biological replicates. Comparisons between 2 groups were carried out using Student’s t test function in SigmaPlot (version 12.5) with 2-tailed distribution. Comparisons among multiple (≥3) groups were carried out using 1-way ANOVA with post hoc Tukey’s test in Prism (version 6.05; GraphPad). For clinical samples, comparisons were based on at least 3 technical replicates. No statistical method was used to predetermine sample size. The distribution (test of normality) of data in each group was assessed to determine the appropriate use of parametric versus nonparametric tests. Accordingly, Mann-Whit-ney test was used for comparison of plasma viral load, CD4 count, and plasma TNF-α. For analyzing SLBP expression in the 4 groups, 1-way ANOVA with post hoc Tukey’s test was used. P value ≤ 0.05 was con-sidered significant, denoted with an asterisk. P value ≤ 0.01 is denot-ed with 2 asterisks. Statistical analyses and graphing were performdenot-ed with either Prism or SigmaPlot.
Study approval
This research study was performed under IRB-approved protocols at The Miriam Hospital (Federal Wide Assurance FWA-00003538) and Rhode Island Hospital (Federal Wide Assurance FWA-00001230), both of which are located in Providence, Rhode Island. HIV-1–infected subjects and healthy donors were recruited and enrolled at the Immu-nology Center at The Miriam Hospital. All enrolled subjects were adults who provided informed consent. Data were collected from par-ticipants and their medical records for demographics, medical history, antiretroviral use, and laboratory studies. Deidentified blood samples were obtained from all participants and immediately processed.
Author contributions
ML designed research studies, conducted experiments, acquired data, analyzed data, and cowrote the manuscript. LDT conducted experiments, acquired data, analyzed data, and
pro-amount of DNA from control and experimental cells was applied to the following 2-step PCR (60): First-round Alu-gag PCR was carried out by mixing of primers (forward: 5′ -CCTCCCAAAGTGCTGGGATTA-CAG-3′; reverse: 5′-GTTCCTGCTATGTCACTTCC-3′), Phusion poly-merase (New England Biolabs), and extracted genomic DNAs. Sec-ond-round real-time (nested) RU5 PCR was performed by combining of primers (forward: 5′-TTAAGCCTCAATAAAGCTTGCC-3′; reverse: 5′-GTTCGGGCGCCACTGCTAGA-3′) and probe (5′
-/56-FAM/CCA-GAGTCA/ZEN/CACAACAGACGGGCACA/3IABkFQ/-3′) with the
amplicons from first-round PCR and Luminaris Probe qPCR Master Mixes (Thermo Fisher Scientific).
HIV-1 unspliced transcript quantification
Aforementioned standard protocols (see “Western blotting” above) were followed for RNA extraction, reverse transcription (cDNA synthesis), and real-time PCR. Unspliced RNA detection was carried out using the follow-ing primers (61): forward: 5′-TCAGCCCAGAAGTAATACCCATGT-3′; reverse, 5′-CACTGTGTTTAGCATGGTGTTT-3′); and probes: 5′
-/56-FAM/ATTATCAGA/ZEN/AGGAGCCACCCCACAAGA/3IABkFQ/-3′.
siRNA-resistant SLBP cDNA design, synthesis, and expression
The coding sequence of human SLBP (NM_006527.3) was modified by replacement of existing codons with alternative ones without chang-ing of the amino acid sequence. The newly designed SLBP cDNA (Sup-plemental Figure 10) was synthesized by GenScript and was inserted into pcDNA3.1+N-HA expression vector (SLBPres). The SLBPres con-struct was transfected into cells, and Western blot was used to quan-tify SLBP expression levels and its resistance to SLBP siRNAs. Parallel experiments using empty control plasmid (provided by Xiaoli Tang, Alpert Medical School of Brown University) were also carried out.
ChIP assay
ChIP assay was performed using a SimpleChIP Enzymatic Chromatin IP Kit (Magnetic Beads) from Cell Signaling Technology following the manufacturer’s protocols. Briefly, HeLa-T4 or CEM cells were treated with 1% formaldehyde for 10 minutes to cross-link proteins to DNA. The isolated nuclei were digested with micrococcal nuclease and fur-ther sonicated to prepare 150- to 900-bp DNA/protein fragments. ChIP-grade anti-SP1 (Abcam) was used to immunoprecipitate SP1 bind-ing fragments. The precipitated chromatin was then treated with pro-teinase K (2 hours at 65°C) to reverse cross-links. Finally, DNA was puri-fied with attached spin column and subjected to real-time PCR. Normal rabbit IgG (Cell Signaling Technology) was used as a negative control.
EpiQ chromatin analysis
The Journal of Clinical Investigation
R E S E A R C H A R T I C L E
1. Cao Y, Qin L, Zhang L, Safrit J, Ho DD. Virologic and immunologic characterization of long-term survivors of human immunodeficiency virus type 1 infection. N Engl J Med. 1995;332(4):201–208. 2. Okulicz JF, et al. Clinical outcomes of elite
controllers, viremic controllers, and long-term nonprogressors in the US Department of Defense HIV natural history study. J Infect Dis. 2009;200(11):1714–1723.
3. Samson M, et al. Resistance to HIV-1 infection in caucasian individuals bearing mutant alleles of the CCR-5 chemokine receptor gene. Nature. 1996;382(6593):722–725.
4. Liu R, et al. Homozygous defect in HIV-1 coreceptor accounts for resistance of some multiply-exposed individuals to HIV-1 infection.
Cell. 1996;86(3):367–377.
5. Fätkenheuer G, et al. Efficacy of short-term monotherapy with maraviroc, a new CCR5 antagonist, in patients infected with HIV-1. Nat
Med. 2005;11(11):1170–1172.
6. International HIV Controllers Study, et al. The major genetic determinants of HIV-1 control affect HLA class I peptide presentation. Science. 2010;330(6010):1551–1557.
7. Fellay J, et al. A whole-genome association study of major determinants for host control of HIV-1.
Science. 2007;317(5840):944–947.
8. Pelak K, et al. Host determinants of HIV-1 control in African Americans. J Infect Dis. 2010;201(8):1141–1149.
9. Ranasinghe S, et al. Association of HLA-DRB1-re-stricted CD4+ T cell responses with HIV immune
control. Nat Med. 2013;19(7):930–933. 10. Migueles SA, et al. Lytic granule loading of CD8+
T cells is required for HIV-infected cell elimina-tion associated with immune control. Immunity. 2008;29(6):1009–1021.
11. Sáez-Cirión A, et al. HIV controllers exhibit potent CD8 T cell capacity to suppress HIV infec-tion ex vivo and peculiar cytotoxic T lymphocyte activation phenotype. Proc Natl Acad Sci U S A. 2007;104(16):6776–6781.
12. Walker BD, Yu XG. Unravelling the mechanisms of durable control of HIV-1. Nat Rev Immunol. 2013;13(7):487–498.
13. Emu B, et al. HLA class I-restricted T-cell respons-es may contribute to the control of human
immu-nodeficiency virus infection, but such responses are not always necessary for long-term virus control. J Virol. 2008;82(11):5398–5407. 14. Cherepanov P, et al. HIV-1 integrase forms
stable tetramers and associates with LEDGF/ p75 protein in human cells. J Biol Chem. 2003;278(1):372–381.
15. Llano M, et al. An essential role for LEDGF/p75 in HIV integration. Science. 2006;314(5798):461–464. 16. Wei P, Garber ME, Fang SM, Fischer WH, Jones
KA. A novel CDK9-associated C-type cyclin interacts directly with HIV-1 Tat and mediates its high-affinity, loop-specific binding to TAR RNA.
Cell. 1998;92(4):451–462.
17. Price DH. P-TEFb, a cyclin-dependent kinase controlling elongation by RNA polymerase II.
Mol Cell Biol. 2000;20(8):2629–2634.
18. Neil SJ, Zang T, Bieniasz PD. Tetherin inhibits ret-rovirus release and is antagonized by HIV-1 Vpu.
Nature. 2008;451(7177):425–430.
19. Brass AL, et al. Identification of host proteins required for HIV infection through a functional genomic screen. Science. 2008;319(5865):921–926. 20. König R, et al. Global analysis of host-pathogen
interactions that regulate early-stage HIV-1 repli-cation. Cell. 2008;135(1):49–60.
21. Zhou H, et al. Genome-scale RNAi screen for host factors required for HIV replication. Cell
Host Microbe. 2008;4(5):495–504.
22. Bushman FD, et al. Host cell factors in HIV rep-lication: meta-analysis of genome-wide studies.
PLoS Pathog. 2009;5(5):e1000437.
23. Jäger S, et al. Global landscape of HIV-human pro-tein complexes. Nature. 2012;481(7381):365–370. 24. Laguette N, et al. SAMHD1 is the dendritic- and
myeloid-cell-specific HIV-1 restriction factor coun-teracted by Vpx. Nature. 2011;474(7353):654–657. 25. Riveira-Muñoz E, et al. Increased expression of
SAMHD1 in a subset of HIV-1 elite controllers.
J Antimicrob Chemother. 2014;69(11):3057–3060.
26. Fu W, Sanders-Beer BE, Katz KS, Maglott DR, Pruitt KD, Ptak RG. Human immunodeficiency virus type 1, human protein interaction database at NCBI. Nucleic Acids Res. 2009;37(Database issue):D417–D422.
27. Lahouassa H, et al. SAMHD1 restricts the replica-tion of human immunodeficiency virus type 1 by depleting the intracellular pool of deoxynucleoside
triphosphates. Nat Immunol. 2012;13(3):223–228. 28. Nitahara-Kasahara Y, et al. Novel nuclear import of Vpr promoted by importin alpha is crucial for human immunodeficiency virus type 1 replication in macrophages. J Virol. 2007;81(10):5284–5293. 29. Pelchen-Matthews A, Giese S, Mlčochová P,
Turner J, Marsh M. β2 integrin adhesion com-plexes maintain the integrity of HIV-1 assembly compartments in primary macrophages. Traffic. 2012;13(2):273–291.
30. Barrero CA, et al. HIV-1 Vpr modulates macro-phage metabolic pathways: a SILAC-based quan-titative analysis. PLoS One. 2013;8(7):e68376. 31. Gadad SS, et al. The multifunctional protein
nuc-leophosmin (NPM1) is a human linker histone H1 chaperone. Biochemistry. 2011;50(14):2780–2789. 32. Deng L, et al. Acetylation of HIV-1 Tat by CBP/
P300 increases transcription of integrated HIV-1 genome and enhances binding to core histones.
Virology. 2000;277(2):278–295.
33. Deng L, et al. Enhancement of the p300 HAT activity by HIV-1 Tat on chromatin DNA.
Virolo-gy. 2001;289(2):312–326.
34. Naji S, et al. Host cell interactome of HIV-1 Rev includes RNA helicases involved in multiple facets of virus production. Mol Cell Proteomics. 2012;11(4):M111.015313.
35. Marzluff WF. Metazoan replication-depen-dent histone mRNAs: a distinct set of RNA polymerase II transcripts. Curr Opin Cell Biol. 2005;17(3):274–280.
36. Wang ZF, Whitfield ML, Ingledue TC, Dominski Z, Marzluff WF. The protein that binds the 3′ end of histone mRNA: a novel RNA-binding protein required for histone pre-mRNA processing. Genes
Dev. 1996;10(23):3028–3040.
37. Sànchez R, Marzluff WF. The stem-loop binding protein is required for efficient translation of histone mRNA in vivo and in vitro. Mol Cell Biol. 2002;22(20):7093–7104.
38. Chen H, Engelman A. The barrier-to-auto-integration protein is a host factor for HIV type 1 integration. Proc Natl Acad Sci U S A. 1998;95(26):15270–15274.
39. Violot S, et al. The human polycomb group EED protein interacts with the integrase of human immunodeficiency virus type 1. J Virol. 2003;77(23):12507–12522.
(20133969), and an NIH COBRE URI/RIH Pilot Research Grant (P20-GM104317) and T32-DA013911. JMA was support-ed by grant NIH 5P01-CA120964 and NIH DF/HCC Cancer Center Support Grant 5P30-CA006516. We thank Min Yuan and Susanne Breitkopf for help with mass spectrometry experi-ments and SILAC data processing.
Address correspondence to: Bharat Ramratnam, Department of Medicine, Warren Alpert Medical School of Brown University, 55 Claverick Street, Room 414, Providence, Rhode Island 02903, USA. Phone: 401.793.8905; E-mail: [email protected]. Or to: Ming Li, Department of Medicine, Warren Alpert Medical School of Brown University, 55 Claverick Street, Room 432, Prov-idence, Rhode Island 02903, USA. Phone: 401.444.7369; E-mail: [email protected].
vided reagents. JMA, CKC, and HL conducted experiments and acquired data. ZJW analyzed data. MCN designed research stud-ies and cowrote the manuscript. MSD conducted experiments and analyzed data. JF supported data analyses. MAL designed research studies and provided reagents. BR designed research studies, analyzed data, and cowrote the manuscript.
Acknowledgments
The Journal of Clinical Investigation
R E S E A R C H A R T I C L E40. Farnet CM, Bushman FD. HIV-1 cDNA integra-tion: requirement of HMG I(Y) protein for func-tion of preintegrafunc-tion complexes in vitro. Cell. 1997;88(4):483–492.
41. Kalpana GV, Marmon S, Wang W, Crabtree GR, Goff SP. Binding and stimulation of HIV-1 integrase by a human homolog of yeast transcription factor SNF5. Science. 1994;266(5193):2002–2006. 42. Ao Z, et al. Interaction of human immunodeficiency
virus type 1 integrase with cellular nuclear import receptor importin 7 and its impact on viral replica-tion. J Biol Chem. 2007;282(18):13456–13467. 43. Larue R, et al. Interaction of the HIV-1 intasome
with transportin 3 protein (TNPO3 or TRN-SR2).
J Biol Chem. 2012;287(41):34044–34058.
44. Maertens G, et al. LEDGF/p75 is essential for nuclear and chromosomal targeting of HIV-1 integrase in human cells. J Biol Chem. 2003;278(35):33528–33539.
45. Priet S, et al. HIV-1-associated uracil DNA glyco-sylase activity controls dUTP misincorporation in viral DNA and is essential to the HIV-1 life cycle.
Mol Cell. 2005;17(4):479–490.
46. Sadowski I, Lourenco P, Malcolm T. Factors con-trolling chromatin organization and nucleosome positioning for establishment and maintenance of HIV latency. Curr HIV Res. 2008;6(4):286–295. 47. Archin NM, et al. Administration of vorinostat
disrupts HIV-1 latency in patients on antiretrovi-ral therapy. Nature. 2012;487(7408):482–485.
48. International AIDS Society Scientific Working Group on HIV Cure, et al. Towards an HIV cure: a global scientific strategy. Nat Rev Immunol. 2012;12(8):607–614.
49. Schröder AR, Shinn P, Chen H, Berry C, Ecker JR, Bushman F. HIV-1 integration in the human genome favors active genes and local hotspots.
Cell. 2002;110(4):521–529.
50. Giresi PG, Kim J, McDaniell RM, Iyer VR, Lieb JD. FAIRE (Formaldehyde-Assisted Isolation of Regulatory Elements) isolates active regulatory elements from human chromatin. Genome Res. 2007;17(6):877–885.
51. Cleynen I, Huysmans C, Sasazuki T, Shirasawa S, Van de Ven W, Peeters K. Transcriptional control of the human high mobility group A1 gene: basal and oncogenic Ras-regulated expression. Cancer
Res. 2007;67(10):4620–4629.
52. Jeang KT, Chun R, Lin NH, Gatignol A, Glabe CG, Fan H. In vitro and in vivo binding of human immunodeficiency virus type 1 Tat protein and Sp1 transcription factor. J Virol. 1993;67(10):6224–6233.
53. Wada NI, et al. The effect of HAART-induced HIV suppression on circulating markers of inflammation and immune activation. AIDS. 2015;29(4):463–471.
54. Krishnan S, et al. Evidence for innate immune system activation in HIV type 1-infected elite controllers. J Infect Dis. 2014;209(6):931–939.
55. Nixon B, et al. Genital herpes simplex virus type 2 infection in humanized HIV-transgenic mice triggers HIV shedding and is associated with greater neurological disease. J Infect Dis. 2014;209(4):510–522.
56. Li M, et al. Intercellular transfer of proteins as identified by stable isotope labeling of amino acids in cell culture. J Biol Chem. 2010;285(9):6285–6297.
57. Li M, et al. Quantitative proteomic analysis of exosomes from HIV-1-infected lymphocytic cells. Proteomics. 2012;12(13):2203–2211. 58. Li M, Ramratnam B. Proteomic Characterization
of Exosomes from HIV-1-Infected Cells. Methods
Mol Biol. 2016;1354:311–326.
59. Huang da W, Sherman BT, Lempicki RA. Sys-tematic and integrative analysis of large gene lists using DAVID bioinformatics resources. Nat
Protoc. 2009;4(1):44–57.
60. Liszewski MK, Yu JJ, O’Doherty U. Detecting HIV-1 integration by repetitive-sampling Alu-gag PCR. Methods. 2009;47(4):254–260.
61. Pasternak AO, et al. Highly sensitive methods based on seminested real-time reverse transcrip-tion-PCR for quantitation of human immuno-deficiency virus type 1 unspliced and multiply spliced RNA and proviral DNA. J Clin Microbiol. 2008;46(7):2206–2211.