Bayesian and hierarchical Bayesian analysis of response - time
data with concomitant variables
Dinesh Kumar
Department of Community Medicine, Government Medical College, Chandigarh, India. Email: [email protected]
Received 9 January 2010; 19 January 2010; 30 January 2010.
ABSTRACT
This paper considers the Bayes and hierarchical Bayes approaches for analyzing clinical data on re-sponse times with available values for one or more concomitant variables. Response times are assumed to follow simple exponential distributions, with a dif-ferent parameter for each patient. The analyses are carried out in case of progressive censoring assuming squared error loss function and gamma distribution as priors and hyperpriors. The possibilities of using the methodology in more general situations like dose- response modeling have also been explored. Bayesian estimators derived in this paper are applied to lung cancer data set with concomitant variables.
Keywords:Bayes Estimator; Bayesian Posterior Density; Gamma Prior Density (GPD); Hierarchical Bayes Esti-mator; Hyperprior; Noninformative Prior Quasi-Density (NPQD); Progressive Censoring; Squared Error Loss Function (SELF); Whittaker Function W s1, s2 (.).
1. INTRODUCTION
In biomedical studies, a considerable interest is laid upon developing statistical techniques for analyzing sur-vival data which utilize information available on con-comitant variables. In classical analysis of survival data, several models [1-7] are used for such situations. The usual proportional hazards (PH) regression model pro-posed by Cox [8] has been extensively discussed in the literature. Byar et al. [9] and Greenberg et al. [10] pre-sented analysis of survival data assuming linear hazard model in classical set-up.
Bhattacharya et al. [11] discussed for the first time the problem on estimation of survival probabilities ad-justing the effect of a single concomitant variable in the Bayesian framework. The present paper presents the Bayesian and hierarchical Bayesian analysis of re-sponse-time data in more general situations of more
than one concomitant variables available for their ef-fects to be adjusted. The exponential survival model
-λy
f y | λ λe 0 ; λ0 , (1) representing the death density function (DDF) corre-sponding to the survival time Y is assumed. We also as-sume that the hazard λ for a patient under clinical inves-tigation is linearly related to measurements on ‘p’ con-comitant variables x1, x2, . . . , xp as follows
p p
0 r r r r 0 1 p
r=1 r=1
λ λ t; x β
βx
βx 0β ,β,...,β
(2) where β0, β1, . . . . , βp are (p + 1) unknown parameters
and x0 = 1 is a dummy variable which is set equal to 1
for all individuals for notational symmetry. In (2) β0 can
be interpreted as the underlying hazard rate or the inter-cept. Of course, it is necessary that the right hand side of (2) be positive. The above hazard model can also be written as
λ t; x x β (3)
where x
= (x0 , x1 , . . . . , xp) is a 1 × (p + 1) vector of
concomitant variables measured on the individual under clinical investigation and β
= (β0, β1, . . . , βp) ⁄ is a (p
+ 1) × 1 vector of unknown parameters.
A natural extension of the model (2) is a dose-response model with hazard as a polynomial function of con-comitant variables covering the situations wherein some concomitant variables are functions of others. In dose- response studies, Y represents the time to occurrence of a toxic response and x represents the dose metameter, the hazard can be expressed in the form (2) with x
=
(x0, x1, . . . , xq) and β
= (β0, β1, β2. . . , βq)
⁄ , where q
Prentice et al. [12] gave specific applications of the Cox model to the analysis of dose-response experiments. The detailed account of dose-response models is avail-able in an expository paper by Kalbfleisch et al. [13].
Bayesian and hierarchical Bayesian estimation of the parameters β0, β1, . . . , βp , the hazard rate, and the
sur-vival function are presented here under the assumptions of the squared error loss function (SELF) and suitable joint prior density of (β0, β1, . . . , βp). A numerical
illus-tration based on the model (2) is presented for survival data set on advanced lung cancer patients.
2. TOOLS AND TECHNIQUES
2.1. Model ParametersUnder the model assumptions (1) and (2), the hazard rate (HR) and the survival function (SF) are respectively given by
pr r r=0 h t; x
βx (4)
p r r
r=0
S S t; x exp - βx t t 0
(5)
The SF (5) gives the probability of survival of an in-dividual with a given vector x
of concomitant
vari-ables, up to time t measured from the chosen origin, which may be the start of the clinical study or the point at diagnosis.
2.2. Data Set
It is assumed that ‘n’ individuals enter the clinical study at different points of time and the clinical study lasts a predetermined follow-up period t = T0. Let ‘d’ be the
number of individuals responding prior to the follow-up period T0, then the rest of individuals, say s = (n - d)
consist of those who are lost to follow-up at different time points during the study and those who did not re-spond till the end of the clinical study. This type of cen-soring is also known as “progressive cencen-soring” in the literature. It is also assumed that measurements on (p + 1) concomitant variables for all the patients are also avail-able. For this situation the sample data will consist of the observation vectors (tj, xj0, xj1, . . . , xjp), j = 1, 2, . . . , d
and (t ⁄
k, x⁄k0, x⁄k1, . . . x⁄kp), k = 1, 2, . . . , s, where tj
de-notes the time-to-response of the jth individual measured
from his entry point, t⁄
k denotes the censored
re-sponse-time of the kth individual and x
jr and x⁄kr, r = 0, 1,
2, . . . , p denote rth concomitant variable on the said jth
and kth individuals respectively.
2.3. Likelihood Function
For the hazard model (2) and the Type III censored
sam-ple data set described earlier LF works out as
p r r r=0
- βQ d
0 j0 1 j1 p jp
j=1
0 1 p
β Π β x + βx ... β x e
0 β ,β,...,β
(6)
where
d
s/ k / kr r j jr
j=1 k 1
Q t x t x , r 0,1, 2,..., p
(7)The product term in (6) can be written as a sum as
0 1 pd
m m m
p 0 j0 1 j1 p jp m,d 0 1 j=1
Π β x + βx ... β x *S β β ...β
(8) where ∑* is the sum over all possible combinations of m0, m1, . . . , mp, such that
p
r r
r=0
m d m 0,1, 2,....,d
(9)and for given (m0, m1, . . . , mp), Sm
, d has been defined
in the appendix. Hence, the LF can be written as
r r r
p
m -βQ
r 0 1 p
m,d r 0
β *S β e 0 β ,β,...,β
(10) Throughout this paper, g and g* will be used as the generic notations for the prior and the posterior densities respectively and the loss structure will be characterized by the usual squared error loss function (SELF). We shall also use the generic notation K for the normaliza-tion constant.
3. BAYESIAN ESTIMATION OF THE
MODEL PARAMETERS
Here it is assumed that prior densities of β0, β1, . . . , βp
mentioned earlier are a priori independent and that βr, r
= 0, 1, 2, . . . , p, follows the gamma prior density with known scale and shape hyperparameters br and ar
re-spectively. For this situation, the joint prior density of (β0, β1, . . . , βp) is given by
r r r
p
a 1 -bβ
0 1 p r 0 r 0 1 p
g β ,β,...,β β e 0 β ,β,...,β
(11) The Bayesian results for the non-informative prior quasi-density (NPQD) specified by
0 1 p
0 1 p
g β ,β,...,β 1 0β ,β,...,β (12)
of their use are available in Raiffa and Schlaifer [15]. On the basis of sample data set described earlier, the Bayesian posterior density of (0, 1, . . . , p <∞) is
ob-tained by combining the LF (10) and joint prior density (11) with the help of the Bayes theorem. This works out to be
r r r r r
p
-β b Q a m -1 -1
0 1 p m,d r 0 r
0 1 p
g * β ,β,...,β K *S β e
0 β ,β,...,β
(13) where
r rp
r r a m m,d r 0
r r a m K *S b Q
(14)From (13), the marginal posterior density of r (r = 0,
1, . . , p) is given by
r r r r r
u u
r
p
-β b Q u u
a m -1 -1
r a m
m,d r u 0
u u
r g * β
a m
K *S β e
b Q
0 β ; r=0, 1, 2, ..., p
(15)Under the assumption of the SELF, the Bayes estima-tor of r (r = 0, 1, 2, . . ., p) and its posterior variance
respectively are obtainable from the following expres-sions
u
up
u u r r
-1
r m,d u 0 a m
r r u u
a m a m
β K *S
b Q b Q
(16)
u ur r r r
-1
r m,d 2
r r 2 p u u r a m u 0 u u
a m a m 1
V β K *S
b Q a m β b Q
(17)The Bayes estimator of the SF is given by the expres-sion:
0 0 1 1 p p 0 0 0
0 1 p 0 1 p
S t; x .. exp - β x βx ... β x t
g * β ,β,...,β dβdβ..dβ
(18)
Evaluating the above multiple integral we obtain
r rp
r r -1
a m m,d u 0
r r r
a m
S t; x K *S
b Q +x t
(19)
Similarly, the posterior variance of Ŝ (t; x) is obtained as
r r
2 p
r r -1
a m m,d u 0
r r r
VS t; x
a m
K *S - S t; x
b Q +2x t
(20)The Bayes estimator of the HR of the patient having concomitant variable vector x = x0, x1, . . . , xp ) is
ob-tained as
p
r r r 0 h x β
(21)where βr
(r = 0, 1, 2, . . . , p) is to be substituted from (16). The Bayesian results for the NPQD (12) can be obtained from those corresponding to the prior density (11) given above, by replacing br = 0, and ar = 1, r = 0, 1,
2, . . . p.
4. HIERARCHICAL BAYESIAN
ESTIMATION OF THE MODEL
PARAMETERS
In hierachical Bayes approach [16-20] a second stage prior is assumed for the unknown hyperparameter of the prior distribution assumed at the first stage. Here the hirachical Bayes (HB) estimators of the parameters: r (r
= 0, 1, 2, . . . , p) , the HR and the SF have been derived under the assumptions of the SELF and the gamma dis-tributions as prior and hyperprior densities. At the first stage r (r = 0, 1, 2, . . . , p) is assumed to follow the
gamma prior density.
r
r r r
a
a 1 bβ
r
r r r r
r
r r r r
b
g β g β | b β e
a
0 β ; b ,a 0; a known
(22)
For the unknown scale hyperparameter br in (22) the
following GPD as hyperprior is assumed at the second stage
r
r r r
v
v 1 ρb r
r r r r r
r
r r r r r
ρ
g b g b | p , v b e
v
0 b ; ρ , v 0; ρ , v known
(23)
From (22) and (23) the prior pdf of r is obtained as
r
r r
r
r r
r r0 0
g β g β , b db g β | b g b db
(24)Assuming a priori independence, the joint prior den-sity of (0, 1, . . . , p) in this case comes out to be
r r a 1 p r 0 1 p r 0 ρr r
β
g β , β, ..., β
ρ +β
(25)
with the help of the Bayes theorem. This works out to be
r r r r r
m a -1 -βQ p
-1 r
0 1 p m,d r 0 v r r
β e
g* β , β, ..., β K *S
ρ +β
(26)where K can be computed by using the result (A.2) of the appendix as
r r
1 r r 2 1 1 ~ ρQ W
δ-1 2
ρQ 2 p
r r r m,d r=0 δ+1 2
r
-δ δ
Γ m +a e ρ
K= *S ,
2 2 Q
(27) where1 r r r
δ m a v (28) and
2 r r r
δ 1 v m a (29) From (26) the marginal posterior density of r (r = 0,
1, . . , p) is obtained as
r r r r ~ βQ mr ar 1 -1r m,d v
r r
β e
g * β K *S A( m )
ρ β
(30)where
u u
1 u u
2 1
1
ρ Q
δ* 1 2
ρQ 2
d δ*
u u u
δ 1 2 r u=0
u A( m )
-δ* W
m a e ρ
, 2 2 Q (31) where
1 u u u
δ* m a v (32) and
2 u u u
δ* 1 v m a (33) Using the BPD (30) and the result (A.3) of the appen-dix, the HB estimator of r(r = 0, 1, 2, . . . , p) is given
by
r r2-1
1
r m,d r r
1/ 2 ρQ
δ 1
r
r
β K *S B( m ) m +a
W - δ 1
ρ
,
Q 2 2
(34) where
1 r r 1δ-1 2
ρQ 2 r r r
δ+1 2 r
Γ m +a e ρ
B( m ) A( m ) Q
(35)
Similarly, the posterior variance of βr (r = 0, 1, 2, . . . , p) is computed as
~ r r 2 1r m,d r r r r
1/ 2 ρQ
δ 2 1
r
r
V β K *S B( m ) m +a m +a 1
W - δ 2
ρ
,
Q 2 2
(36)The HB estimator of S and its posterior variance re-spectively are evaluated as
r r r
r r r 1
2 1
1 ~
ρ Q x t
ρ Q x t δ-1 2 p
δ
r r r
m,d r=0 δ+1 2
r r
S(t; x )
-δ
W
Γ m +a e ρ
*S ,
2 2
Q x t
(37) and
~r r r
r r r 1
2 1
1
m,d
ρ Q 2x t
ρ Q 2x t δ-1 2 p
δ
r r r
δ+1 2 r=0
r r 2
V(S t; x ) *S
-δ
W
Γ m +a e ρ
, 2 2 Q 2x t
S(t; x )
(38) The HB estimator of the HR for the patient having concomitant variable vector x = (x0, x1, . . . , xp) is givenby
p
r r r 0 h= xβ
(39)
where βr (r=0, 1, 2, . . . , p) is to be substituted from (34).
5. NUMERICAL ILLUSTRATION ON
LUNG CANCER PATIENTS
To illustrate the use of the model characterized by the
Eq.4, the survival data set on 137 advanced lung cancer patients previously studied by Prentice [21] is used. Pa-tients were randomized according to one of two chemo-therapeutic agents: standard and test. To study the possi-ble differential effects of therapy on tumor cell type, tumors were classified into four broad groups termed as squamous, small, adeno and large. The author used four covariates: performance status, time from diagnosis to study, age, and previous therapy to be denoted by x1, x2,
x3 and x4 respectively. Assuming the intercept to be zero
and taking noninformative prior quasi-density (NPQD) at (12) for (1, 2, 3, 4) the Bayes estimates of the
model parameters are obtained for different tumor types and the results for the standard and the test therapies are compared.
Table 1.Estimates of model parameters for different tumor types.
Estimates of i
Type of Tumor
Type of therapy i
Squamous Small Adeno Large
1 2.331 × 10⁻⁵ 1.841 × 10⁻⁵ 3.707 × 10⁻⁵ 1.027 × 10⁻⁵
2 4.274 × 10⁻⁵ 6.649 × 10⁻⁵ 6.690 × 10⁻⁵ 1.010 × 10⁻⁴
Standard 3 2.206 × 10⁻⁵ 1.484 × 10⁻⁵ 6.316 × 10⁻⁵ 1.520 × 10⁻⁵
4 2.091 × 10⁻⁴ 2.364 × 10⁻⁴ 8.790 × 10⁻³ 1.802 × 10⁻⁴
1 5.753 × 10⁻⁶ 3.352 × 10⁻⁵ 3.539 × 10⁻⁵ 1.739 × 10⁻⁵
2 5.041 × 10⁻⁵ 1.445 × 10⁻⁴ 2.934 × 10⁻⁴ 1.561 × 10⁻⁴
Test 3 7.354 × 10⁻⁶ 6.449 × 10⁻⁵ 3.584 × 10⁻⁵ 2.116 × 10⁻⁵
4 6.563 × 10⁻⁵ 8.231 × 10⁻⁴ 7.890 × 10⁻⁴ 2.201 × 10⁻⁴
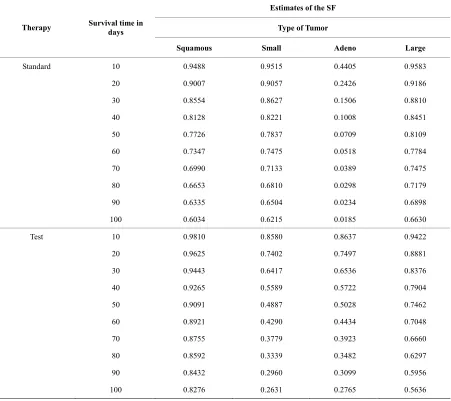
Table 2.Estimates of the survival function for different tumor types.
Estimates of the SF
Type of Tumor Therapy Survival time in days
Squamous Small Adeno Large
Standard 10 0.9488 0.9515 0.4405 0.9583
20 0.9007 0.9057 0.2426 0.9186
30 0.8554 0.8627 0.1506 0.8810
40 0.8128 0.8221 0.1008 0.8451
50 0.7726 0.7837 0.0709 0.8109
60 0.7347 0.7475 0.0518 0.7784
70 0.6990 0.7133 0.0389 0.7475
80 0.6653 0.6810 0.0298 0.7179
90 0.6335 0.6504 0.0234 0.6898
100 0.6034 0.6215 0.0185 0.6630
Test 10 0.9810 0.8580 0.8637 0.9422
20 0.9625 0.7402 0.7497 0.8881
30 0.9443 0.6417 0.6536 0.8376
40 0.9265 0.5589 0.5722 0.7904
50 0.9091 0.4887 0.5028 0.7462
60 0.8921 0.4290 0.4434 0.7048
70 0.8755 0.3779 0.3923 0.6660
80 0.8592 0.3339 0.3482 0.6297
90 0.8432 0.2960 0.3099 0.5956
[image:5.595.74.525.324.725.2]0 0.1 0.2 0.3 0.4 0.5 0.6 0.7 0.8 0.9 1
10 20 30 40 50 60 70 80 90 100
Survival time (Days)
E
s
ti
m
ate
s
o
f
th
e
S
F
[image:6.595.309.538.78.343.2]Test therapy Standard therapy
Figure 1. Estimates of the survival functions of standard and
test therapies for ‘squamous’ tumor cell.
0 0.1 0.2 0.3 0.4 0.5 0.6 0.7 0.8 0.9 1
10 20 30 40 50 60 70 80 90 100
Survival time (Days)
E
s
ti
m
a
te
s
o
f
th
e
S
F
[image:6.595.58.286.79.340.2]Test therapy Standard therapy
Figure 2. Estimates of the survival functions of standard and
test therapies for ‘small’ tumor cell type.
tumor types for the standard and test therapies are shown in Table 1. The estimates of the survival function S = S (t; x) for given vector x
= (60, 9, 63, 10) (say) of con-
0 0.1 0.2 0.3 0.4 0.5 0.6 0.7 0.8 0.9 1
10 20 30 40 50 60 70 80 90 100
Survival time (Days)
E
st
im
ate
s
o
f th
e
S
F
[image:6.595.58.285.376.641.2]Test therapy Standard therapy
Figure 3. Estimates of the survival functions of standard and
test therapies for ‘adeno’ tumor cell type.
0 0.2 0.4 0.6 0.8 1 1.2
10 20 30 40 50 60 70 80 90 100
Survival time (Days)
Es
ti
m
ate
s
o
f th
e
SF
Test therapy Standard therapy
Figure 4. Estimates of the survival functions of standard and
test therapies for ‘large’ tumor cell type.
[image:6.595.311.538.381.631.2]From the comparison of estimates for the two thera-pies, for given arbitrary concomitant vector x
for
squamous and adeno tumor cell types, the test therapy prolong the survival of patients. The test therapy comes out to be the most effective for adeno tumor cell type for this particular case.
6. ACKNOWLEDGEMENTS
The present work is respectful homage to my respected teacher Late Professor Sameer K Bhattacharya, Head, Department of Mathematics and Statistics, University of Allahabad India. The paper was written when author was working asAssistant Professor, Department of Social and Preventive Medicine, MLN Medical College, Allahabad. The help rendered by Dr. Nand Kishore Singh, Department of Mathematics and Statistics, University of Allahabad, at each stage of the present work is greatly acknowledged. The work in the present form was also not possible without critical evaluation and computer programming by Dr. AK Lal, Indian Institute of Technology, Kanpur India. The author is also thankful to Mr. Parminder Kumar, Data Entry Operator, GMCH-32, Chandigarh for his help in typing the manuscript.
REFERENCES
[1] Cox, D.R. (1964) Some applications of exponential or-dered scores. JRSS, Series B, 26, 103-110.
[2] Feigl, P. and Zelen, M. (1965) Estimation of exponential survival probabilities with concomitant information.
Biometrics, 21(4), 826-838.
[3] Zippin, C. and Armitage, P. (1966) Use of concomitant variables and incomplete survival information in the es-timation of an exponential survival parameter. Biometrics,
22, 665-672.
[4] Glasser, M. (1967) Exponential survival with covariance.
Journal of American Statistical Association, 62, 561-568. [5] Cox, D.R. and Snell, E.J. (1968) A general definition of
residuals, (with Discussion). Journal of the Royal Statis-tical Society B, 30, 248-275.
[6] Crowley, J. and Hu, M. (1977) Covariance analysis of heart transplants survival data. Journal of American Sta-tistical Association, 72(357), 27-36.
[7] Mantel, N. and Myers, M. (1971) Problems of conver-gence of maximum likelihood iterative procedures in multiparameter situation. Journal of American Statistical Association, 66(335), 484-491.
[8] Cox, D.R. (1972) Regression models and life tables, (with discussion), Journal of the Royal Statistical Society B, 34(2), 187-220.
[9] Byar, D.P., Huse, R., Bailar, J.C. and The Veterans Ad-ministration Cooperative Urological Research Group (1974) An exponential model relating censored survival data and concomitant information for prostatic cancer patients. Journal of National Cancer Institute, 52(2), 321-326.
[10] Greenberg, R.A. and Bayard, S. (1974) Selecting con-comitant variables using a likelihood ratio step-down procedure and a method of testing goodness of fit in an exponential survival model. Biometrics, 30(4), 601-608. [11] Bhattacharya, S.K., Singh, N.K. and Kumar, D. (1995)
Bayesian survival analysis of clinical data using a co-variate. Revista Brasileira de Probabilidade e Estadistica,
9, 141-156.
[12] Prentice, R.L., Peterson, A.V. and Marek, P. (1982) Dose mortality relationships in RFM mice following 137 ga- mma ray irradiation. Radiation Research, 90(1), 57-76. [13] Kalbfleisch, J.D., Krewski, D.R. and Van Ryzin, J. (1983)
Dose-response models for time to response toxicity data.
The Canadian Journal of Statistics, 11(1), 25-49.
[14] Bhattacharya, S.K. (1967) Bayesian approach to life testing and reliability estimation. Journal of American Statistical Association, 62, 48-62.
[15] Raiffa, H. and Schlaifer, R. (1961) Applied statistical decision theory. Harward University Press, Boston. [16] Berger, J. (1986) Multivariate estimation: Bayes,
empiri-cal bayes and stein approaches. Society for Industrial and Applied Mathematics, Philadelphia.
[17] Bhattacharya, S.K. and Tiwari, R.C. (1992) Hierarchical Bayesian reliability analysis using Erlang families of priors and hyperpriours. Microelectronics Reliability,
32(1-2), 241-247.
[18] Bhattacharya, S.K., Singh, N.K. and Tiwari, R.C. (1992) Hierarchical Bayesian survival Bayesian survival analy-sis based on generalized exponential model. Metron,
50(3), 161-183.
[19] Good, I.J. (1980) Some history of the hierarchical bayes-ian methodology in bayesbayes-ian statistics. Bernardo, J.M., De Groot, M.H., Lindley, D.V. and Smith, A.F.M., Eds., University Press, Valencia.
[20] Stangl, D.K. and Greenhouse, J.B. (1998) Assessing placebo response using Bayesian hierarchical survival models. Lifetime Data Analysis, 4(1), 5-28.
[21] Prentice, R.L. (1973) Exponential survival with censor-ing and explanatory variables. Biometrika, 60(2), 279- 288.
APPENDIX
The definition of Sm,d
notation and a mathematical
result on a special function used in the present work are presented here.
1) TheSm,d
Notation
Let X denotes a d x (p + 1) matrix of concomitant variables given below
10 11 1p
20 21 2p
d0 d1 dp
x x ... x
x x ... x
X =
x x ... x
(A.1)
and m
= (m0, m1, . . . . , mp) . For given combinations
of m0, m1, . . . . , mp, satisfying the condition:
m0 + m1 + . . . + mp = d (A.2)
m,d S
is given by the sum of all products of mr
ele-ments from rth column (r = 0, 1, 2, . . . , p) of the matrix
X, such that no two elements in the product term lie in same row of the matrix.
2) Integral for the Whittaker Function
The following variant of the integral representation ([22] p.319, Sec. 3. 383, Formula 4) has been used in the present work:
1-q-A q-A
,
2 2
A-1 -Bw
q-A-1 / 2 A-q-1 / 2 Bv/2
W q
0
w e dw = A e B v Bv
v+w