Inference of ecological and social drivers of human
brain-size evolution
Mauricio González-Forero1∗& Andy Gardner1
1School of Biology, University of St Andrews, Dyers Brae, St Andrews KY16 9TH, UK
*Corresponding author
The human brain is unusually large. It tripled in size from Australopithecines to
mod-ern humans1 and became almost six times larger than expected for a placental
mam-mal of human size2. Brains incur high metabolic costs3and accordingly a long-standing
question is why the large human brain evolved4. The leading hypotheses propose
ben-efits of improved cognition for overcoming ecological5–7, social8–10, or cultural11–14
chal-lenges. However, these hypotheses are typically assessed using correlative analyses, and
establishing causes for brain-size evolution remains difficult15, 16. Here we introduce a
metabolic approach that enables causal assessment of social hypotheses for brain-size
evolution. Our approach yields quantitative predictions for brain and body size from
for-malised social hypotheses given empirical estimates of the brain’s metabolic costs. Our
model predicts the evolution of adultHomo sapienssized brains and bodies when
indi-viduals face a combination of 60% ecological, 30% cooperative, and 10% between-group
competitive challenges, and suggests that between-individual competition has been
unim-portant. Moreover, our model indicates that brain expansion inHomowas driven by
eco-logical rather than social challenges, perhaps strongly promoted by culture. Our metabolic
approach thus allows for causal assessments that refine, refute, and unify hypotheses for
The leading hypotheses for the evolution of brain size make different suggestions as to which cognitive challenges have been most important in driving brain expansion. “Ecological-intelligence” hypotheses emphasize challenges posed by the non-social environment: e.g., food finding, caching, or processing5–7 (Fig. 1). In contrast, “social-intelligence” hypothe-ses emphasize challenges posed by the social environment: e.g., cooperating for resource extraction10, 15, manipulating others, avoiding manipulation or forming coalitions and
al-liances to out-compete others8, 9 (Fig. 1). Social challenges have been suggested to con-stitute particularly powerful drivers of brain expansion because they may have triggered evolutionary arms races in cognition8–10. Finally, “cultural-intelligence” hypotheses
empha-size challenges of learning from others, teaching, and doing so with accumulated cultural knowledge11–14. Empirical tests of these hypotheses customarily investigate
phylogenetically-controlled correlations between brain size (or the size of brain components) and candi-date selective factors (e.g., diet type5, 17, tactical-deception rate18, group size10, 19, and social-learning proclivity20). However, establishing causality has proven difficult: for example,
given a positive correlation, it is unclear whether large group sizes favour bigger brains or big brains enable larger group sizes16. Moreover, there is the quantitative problem of explaining not only why bigger brains are favoured, but also why they are favoured to the particularly large size observed in humans (≈1.3 kg for a body size of≈50 kg in females21, 22).
tis-sue. Part of the reproductive tissue’s energy consumption is for production and mainte-nance of offspring, while part of brain’s energy consumption is for production (learning) and maintenance (memory) of energy-extraction skills. Accordingly, at each age the individual has a certain skill level measured in information units (i.e., bytes). She extracts energy by using her skill level to overcomeecologicalorsocialenergy-extraction challenges. Success in an ecological challenge depends on her own skill level, while success in a social challenge depends on her skill level and that of her social partners. We consider three types of social challenge:cooperative, in which the individual’s skill level and that of a social partner of the same age (hereafter “peer”) interact to overcome a challenge;between-individual competi-tive, in which the individual uses her skill level against that of a peer to extract energy; and
between-group competitive, in which the individual’s skill level and that of a peer act together
and against the skills of another two peers (i.e., one coalition competing against another). We assume that during any small time interval, the individual faces energy-extraction chal-lenges, a proportionPj of which are of type j (collectively denoted byP, with j =1, . . . , 4
respectively indexing the four challenge types andP4
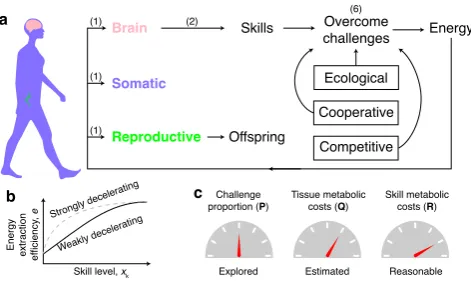
j=1Pj =1). GivenP, the growth strategy controls the amount of energy allocated to the production of each tissue throughout life, and we let the growth strategy evolve. The individual’s energy-extraction efficiency (EEE) thus depends on her skill level, that of social partners, and the challenges faced, and we consider two shapes for EEE (Fig. 2 and Extended Data Fig. 1). We use previously-published data for parameter estimates, including brain metabolic costs (Methods; Extended Data Figs. 2 and 3).
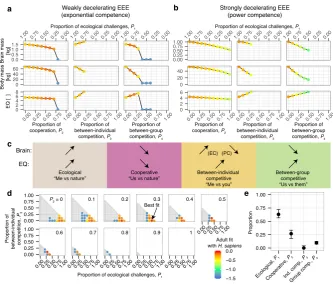
“encephal-size; Fig. 3a,b and Extended Data Fig. 4). In contrast, increasing the proportion of between-individual competitive challenges increases brain size if EEE is weakly-decelerating with skill (Fig. 3a), but decreases brain size if EEE is strongly-decelerating (Fig. 3b and Extended Data Fig. 4). However, although between-individual competition increases brain size with weakly-decelerating EEE, the result is larger brains and smaller bodies than those of mod-ern humans (Fig. 3a and Extended Data Fig. 4). Between-individual competition also de-creases body mass as it inde-creases the difficulty of energy extraction and thus limits the en-ergy available for body growth; consequently, between-individual competition increases EQ because body size decreases more strongly than brain size when the latter decreases. In-creasing the proportion of between-group competition decreases brain size but increases EQ because body size decreases more strongly than brain size [with weakly-decelerating EEE and submultiplicative cooperation (Figs. 3a); in the other cases, between-group competition has similar effects as between-individual competition (Extended Data Fig. 4)]. Moderately-frequent between-individual or between-group competition can lead to no allocation to brain and body growth (blue dots in Fig. 3a and Extended Data Fig. 4, and Extended Data Fig. 5a,d); additionally, moderately-frequent between-group competition in the presence of substantial cooperation can lead to arms races in brain size, which fail to yield stable, large brains [e.g., due to cycling in brain size or eventual collapse to no allocation into brain growth (Extended Data Fig. 5)]. This is because energy extraction becomes exceedingly dif-ficult in the presence of large-brained competitors such that investments in brain or body growth do not pay off.
param-eters (QandR) fixed (Fig. 3d,e; Supplementary Information section 5). We find near-perfect adult fits acrossHomo species (Fig. 4a and Extended Data Figs. 6–8). A near-perfect adult fit for H. sapiensoccurs with a large proportion of ecological challenges (≈60%), a mod-erate proportion of cooperative challenges (≈30%), a small proportion of between-group competitive challenges (≈10%), and a virtual absence of between-individual competitive challenges (≈0%) (Figs. 3e and 4a and Extended Data Figs. 6 and 9). In the resulting re-construction, the proportion of ecological challenges tends to increase from early to late
Homo, and a steep increase in EQ fromH. ergastertoH. heidelbergensisis due to a transition from strongly- to weakly-decelerating EEE (Fig. 4a). The adult best-fit eco-social scenario
forH. sapiensalso yields a predicted life history that closely matches the species’ life-history
timing (Fig. 4b and Extended Data Fig. 10). The resulting ontogenetic fit is high for body size, but lower for brain size early in ontogeny (Fig. 4b), perhaps due in part to our use of a power-law relationship between resting metabolic rate and body mass that underestimates resting metabolic rate early in ontogeny24. With the adult brain size resulting from the
best-fitting scenario forH. sapiens [x∗b(ta)=1.276 kg], the predicted adult skill level for energy extraction is 3.92 TB, which can be calculated with an equation transforming brain mass to skill level24 [ ˆx
k=skBbx∗b(ta)/Bk where ˆxk is the asymptotic skill level in adulthood; Eq. (5) in Methods]. For comparison, current rough estimates suggest a human-neocortex storage capacity of≈600 TB (Supplementary Information section 4.3)25.
individual competition plays little role as it does not lead to human-sized brains and bod-ies. Cooperation decreases brain size because it allows individuals to rely on their part-ners’ skills and thus decrease their own investment into costly brains (cooperation invites cheating), which is consistent with diminished brain sizes in cooperatively-breeding birds26 and mammals27, including primates28. For instance, among mole rats, naked mole rats
are the most specialized in cooperative breeding and have the smallest relative brain size29
(however, allomaternal care and brain size are positively associated in mammals30, but al-lomaternal care constitutes cooperation targeted at young vanishing in adulthood as op-posed to the peer-cooperation studied here). Similarly, between-group competition can decrease brain size probably because between-group competition involves cooperation be-tween group members, allowing individuals to rely on their partners’ skill. The result that exceedingly-frequent competition decreases absolute and relative brain size may be rele-vant to the observed decreased brain size in cetaceans with the largest group sizes19. Co-operation can also decrease body size in our model because when brain size is disfavoured so too can be body size. This is because a consequence of our model is that a key reason to grow somatic tissue is to make energy available for brain growth: increasing the mass of in-expensive somatic tissue can increase the energy available for tissue (and brain) growth due to the physical constraint imposed by the power-law relationship between resting metabolic rate and body mass24.
cognition towards cooperation. This would help explain aspects of human cognition that fa-cilitate cooperation11, even if cooperation has not been a driver of human brain expansion.
Additionally, since our analysis suggests that brain expansion inHomohas not been driven by peer cooperation or competition, our results may suggest that social complexity is a con-sequence rather than a cause for the human brain size — although we emphasize that our analysis is an illustrative starting point and future extensions are encouraged (see Supple-mentary Information section 9). Therefore, our results highlight the fundamental question of why ecological challenges would have favoured substantial brain expansion in humans but less so in other taxa10, 15. One clue is suggested by our finding thatH. sapiens-sized brains
and bodies obtain only under weakly-decelerating EEE (Figs. 3, 4 and Extended Data Fig. 6a): in other words, only when young individuals can maintain a substantial rate of increase in their efficiency of energy extraction as they acquire skills. One possibility is that culture (or cumulative culture) facilitates weakly-decelerating EEE if learning from the population’s pool of skills allows individuals to maintain a relatively high rate of increase in EEE as their skill level increases when young. More specifically, the evolution of progressively-elaborated social learning, teaching, and language11–14may have enabled young individuals to continue gaining skills with age, possibly promoting less strongly decelerating EEE. In this respect, our results are consistent with aspects of various cultural hypotheses for brain evolution13, 14and an explicit account of the effect of culture on EEE could help address whether culture (or cu-mulative culture) has enabled ecological challenges to drive brain expansion in humans in ways that have not occurred in other taxa.
1. Klein, R. G.The Human Career(The Univ. of Chicago Press, 2009), 3rd edn.
Na-ture293, 57–60 (1981).
3. Aiello, L. C. & Wheeler, P. The expensive-tissue hypothesis: the brain and the digestive system in human and primate evolution.Curr. Anthropol.36, 199–221 (1995).
4. Darwin, C. The Descent of Man, and Selection in Relation to Sex(J. Murray, 1871).
5. Clutton-Brock, T. H. & Harvey, P. H. Primates, brains and ecology. J. Zool.190, 309–323 (1980).
6. Gibson, K. R. Cognition, brain size and the extraction of embedded food resources. In Else, J. G. & Lee, P. C. (eds.)Primate Ontogeny, Cognition and Social Behaviour, 93–103 (Cambridge Univ. Press, 1986).
7. Rosati, A. G. Foraging cognition: reviving the ecological intelligence hypothesis. Trends
Cogn Sci21, 691–702 (2017).
8. Humphrey, N. K. The social function of the intellect. In Bateson, P. P. G. & Hinde, R. A. (eds.)Growing Points in Ethology, 303–317 (Cambridge Univ. Press, 1976).
9. Byrne, R. & Whiten, A. (eds.)Machiavellian Intelligence(Oxford Univ. Press, 1988).
10. Dunbar, R. I. M. The social brain hypothesis. Evol. Anthropol.6, 178–190 (1998).
11. Moll, H. & Tomasello, M. Cooperation and human cognition: the Vygotskian intelligence hypothesis.Phil. Trans. R. Soc. B362, 639–648 (2007).
12. van Schaik, C. P. & Burkart, J. M. Social learning and evolution: the cultural intelligence hypothesis.Phil. Trans. R. Soc. B366, 1008–1016 (2011).
13. Henrich, J.The Secret of our Success(Princeton Univ. Press, 2016).
15. Dunbar, R. I. M. & Shultz, S. Why are there so many explanations for primate brain evolution? Phil. Trans. R. Soc. B372, 20160244 (2017).
16. Powell, L. E., Isler, K. & Barton, R. A. Re-evaluating the link between brain size and behavioural ecology in primates.Proc. R. Soc. B284, 20171765 (2017).
17. DeCasien, A. R., Williams, S. A. & Higham, J. P. Primate brain size is predicted by diet but not sociality.Nat. Ecol. Evol.1, 0112 (2017).
18. Byrne, R. W. & Corp, N. Neocortex size predicts deception rate in primates.Proc. R. Soc. B271, 1693–1699 (2004).
19. Fox, K. C. R., Muthukrishna, M. & Shultz, S. The social and cultural roots of whale and dolphin brains.Nat. Ecol. Evol.1, 1699–1705 (2017).
20. Street, S. E., Navarrete, A. F., Reader, S. M. & Laland, K. N. Coevolution of cultural intel-ligence, extended life history, sociality, and brain size in primates. Proc. Natl. Acad. Sci. USA114, 7908–7914 (2017).
21. Kuzawa, C. W.et al. Metabolic costs and evolutionary implications of human brain de-velopment.Proc. Nat. Acad. Sci. USA111, 13010–13015 (2014).
22. Dekaban, A. S. & Sadowsky, D. Changes in brain weights during the span of human life: relation of brain weights to body heights and body weights. Ann. Neurol. 4, 345–356 (1978).
23. West, G. B., Brown, J. H. & Enquist, B. J. A general model for ontogenetic growth.Nature 413, 628–631 (2001).
evolu-25. Bartol Jr, T. M.et al. Nanoconnectomic upper bound on the variability of synaptic plas-ticity.eLife4, e10778 (2015).
26. Fedorova, N., Evans, C. L. & Byrne, R. W. Living in stable social groups is associated with reduced brain size in woodpeckers (Picidae).Biol. Lett.13, 20170008 (2017).
27. Clutton-Brock, T. Mammal Societies(Wiley, 2016).
28. Thornton, A. & McAuliffe, K. Cognitive consequences of cooperative breeding? A critical appraisal.J. Zool.295, 12–22 (2015).
29. Kruska, D. C. T. & Steffen, K. Encephalization of Bathyergidae and comparison of brain structure volumes between the zambian mole-ratFukomys anselliand the giant
mole-ratFukomys mechowii. Mamm. Biol.74, 298–307 (2009).
30. Isler, K. & van Schaik, C. P. Allomaternal care, life history and brain size evolution in mammals.J. Hum. Evol.63, 52–63 (2012).
Supplementary Information is available in the online version of the paper.
Acknowledgements We thank Laurent Lehmann for advice in the model set up, and for support at
the University of Lausanne where this project initiated. We also thank Piret Avila, Stephen H.
Mont-gomery, Simon B. Laughlin, Maurizio Falcone, Tim Clutton-Brock, and Michael B. Morrissey for
dis-cussions, and Andrew Whiten for feedback. MGF was funded by a Marie Skłodowska-Curie
Individ-ual Fellowship (No 701464) and AG was funded by a NERC Independent Research Fellowship (NE/
K009524/1). The contents of this paper reflect only the authors’ view and not the views of their
fun-ders.
Author Contributions MGF conceived and carried out the study. AG conceived implementing
the paper.
Author Information Reprints and permissions information is available at www.nature.com/reprints.
The authors declare no competing financial interests. Correspondence and requests for materials
Challenges
Ecological Social
Cooperative Competitive
Between individuals Between groups
[image:12.595.171.424.128.228.2]“Me vs nature” “Us vs nature” “Me vs you” “Us vs them”
Figure 1:Ecological and social hypotheses for brain expansion.Ecological hypotheses em-phasize challenges “against nature”, while social hypotheses emem-phasize challenges involv-ing social partners. Here we partition these hypotheses into four types of challenges that are expected to trigger different evolutionary processes.
Brain
Somatic
Reproductive Offspring
Skills challengesOvercome
Ecological
Cooperative
Competitive
Energy a
Strongly dece lerating
Skill level, xk
Energy extraction efficiency
, e
Weakly decel erating b
(1) (2)
(1)
(1)
(6)
c Challenge
proportion (P) Tissue metaboliccosts (Q) Skill metaboliccosts (R)
Explored Estimated Reasonable
[image:12.595.181.417.475.621.2]● ● ● ● ● ● ● ● ● ● ● ● ● ● ● ● ● ● ● ● ● ● ● ● ● ● ● ● ● ● ● ● ● ● ● ● ● ● ● ● ● ● ● ● ● ● ● ● ● ● ● ● ● ● ● ● ● 0.00 0.25 0.50 0.75
1.00 1.000.750.50 0.250.001.00 0.750.500.25 0.00
0.00 0.25 0.50 0.75 1.00 0.00 0.25 0.50 0.75 1.00 0.00 0.25 0.50 0.75 1.00 0.0 0.5 1.0 1.5 0 20 40 60 0 2 4 6 8 Brain mass [kg] Body mass [kg]
EQ [ ]
Weakly decelerating EEE
(exponential competence) Strongly decelerating EEE(power competence) Proportion of ecological challenges, P1
● ● ● ● ● ● ● ● ● ● ● ● ● ● ● ● ● ● ● ● ● ● ● ● ● ● ● ● ● ● ● ● ● ● ● ● ● ● ● ● ● ● ● ● ● ● ● ● ● ● ● ● ● ● ● ● ● ● ● ● ● ● ● 0.00 0.25 0.50 0.75
1.00 1.000.750.50 0.250.001.000.750.500.250.00
0.00 0.25 0.50 0.75 1.00 0.00 0.25 0.50 0.75 1.00 0.00 0.25 0.50 0.75 1.00 0.00 0.25 0.50 0.75 1.00 0 20 40 0 2 4 6 Proportion of cooperation, P2
Proportion of between-individual
competition, P3
Proportion of between-group competition, P4
Proportion of cooperation, P2
Proportion of between-individual
competition, P3
Proportion of between-group competition, P4 Proportion of ecological challenges, P1 a c b Brain: EQ: Ecological
“Me vs nature” “Us vs nature”Cooperative Between-individual competitive “Me vs you”
Between-group competitive “Us vs them” (EC) (PC) ● ● ●●●●● ● ● ● ● ●● ● ● ● ● ● ● ● ● ● ● ● ● ● ●●●● ● ● ● ● ●● ● ● ● ● ● ● ● ● ●●● ● ● ● ● ●● ● ● ● ● ● ● ● ●● ●●●●● ●● 0.00 0.25 0.50 0.75 1.00 0.00 0.25 0.50 0.75 1.00
0.000.250.500.751.00 0.000.250.500.751.00 0.000.250.500.751.00 0.000.250.500.751.00 0.000.250.500.751.00 ● ● ●●●●● ● ● ● ● ●● ● ● ● ● ● ● ● ● ● ● ● ● ● ●●●● ● ● ● ● ●● ● ● ● ● ● ● ● ● ●●● ● ● ● ● ●● ● ● ● ● ● ● ● ● ● ● ● ● ● ● ●● 0.00 0.25 0.50 0.75 1.00 0.00 0.25 0.50 0.75 1.00
0.00 0.25 0.50 0.75 1.00 0.00 0.25 0.50 0.75 1.00 0.00 0.25 0.50 0.75 1.00
−1.5 −1.0 −0.5 0.0 Adult fit with H. sapiens
Ecological, P1 Cooperative, P2 Ind. comp., P3 Group comp., P4 ● ● ● ● 0.00 0.25 0.50 0.75 1.00 e Proportion d
Proportion of ecological challenges, P1
Proportion of
between-individual competition,
P3
Best fit
P2 = 0 0.1 0.2 0.3 0.4 0.5
0.6 0.7 0.8 0.9 1
● ● ●●●●● ● ● ● ● ●● ● ● ● ● ● ● ● ● ● ● ● ● ● ●●●● ● ● ● ● ●● ● ● ● ● ● ● ● ● ●●● ● ● ● ● ●● ● ● ● ● ● ● ● ●● ●●●●● ●● 0.00 0.25 0.50 0.75 1.00 0.00 0.25 0.50 0.75 1.00
[image:13.595.130.464.128.415.2]0.000.250.500.751.00 0.000.250.500.751.00 0.000.250.500.751.00 0.000.250.500.751.00 0.000.250.500.751.00
Figure 3: Effects of challenge types on brain size, and best-fitting scenario for adult
H. sapiens. a–b,Effects of increasing the proportion of a challenge type while decreasing
the proportion of ecological challenges. Fora,weakly-decelerating EEE (exponential com-petence) andb,strongly-decelerating EEE (power competence). Dot colour is the adult fit
withH. sapiens’ brain and body mass [i.e.,−D(τa); Supplementary Information section 6].
Zero adult fit means perfect fit. c,Qualitative effects of challenge types on brain mass and EQ.d,Best fitting scenario forH. sapiens. Dots give the adult fit for every challenge combi-nation that was solvable. Shaded regions indicate the simplex wherePj can vary. The best
a Mya
0
0.5
1
1.5
2
H. sapiens H. neanderthalensis
H. erectus
H. heidelbergensis
H. ergaster
H. habilis
0 20 40 60
0 10 20 30 40
0.0 0.5 1.0 1.5
0 10 20 30 40
Adult fit: -0.04 Brain [kg]:
Body [kg]: EQ [ ]:
Observed: 0.60 32.0 3.85 0.85 56.0 3.55
-0.02 1.16
54.2 4.97
-0.01
-0.01 0.98
55.0 4.15 1.31
51.1 5.87
-0.03 -0.02
1.44 66.4 5.30
Age [years]
[kg]
Model H. sapiens
growth reproduction adulthood childhoodadolescence b
Body Brain
60% 30%10%
80% 20%
60% 40%
50% 50%
10% 60% 10%20%
Ecological Cooperative
Between-group competitive
Between-individual competitive EEE vs skill level:
weakly decelerating strongly decelerating
80% 20%
[image:14.595.173.424.162.440.2]Adult Adult
Figure 4:Best-fitting scenarios across adultHomo, and resulting predicted life-history for
H. sapiens. a, Best adult fitting scenarios across Homo(figure modified with permission
from Fig. 8.1 of ref.1). Pie charts and next-standing plots give respectively the challenge
combination and shape of EEE vs skill that yield the best adult fit using the sameQandR
Methods
Here we summarize our model; see Supplementary Information for the detailed method description. No experiments were performed for this study, and no empirical data were collected.
Model description. We consider a female population with overlapping generations and
deter-mines the challenge difficulty. During any small time interval, the individual faces chal-lenges, a proportionPj of which are of typej (withj =1, . . . , 4 respectively indexing the four
challenge types andP4
j=1Pj =1). For instance, P1=1 denotes that individuals face only ecological challenges, whileP1=P2=0.5 denotes that individuals face only ecological and cooperative challenges and with equal proportion. We define the growth-metabolic rate as the rate of heat release by a resting individual due to tissue production. Moreover, we de-fine the growth strategy as the fraction of the growth-metabolic rate due to the production of each tissue throughout life. Thus, the growth strategy generates an ontogenetic profile of brain and body size. We consider that the growth strategy evolves by natural selection, and study its evolution using standard evolutionary-invasion analysis; i.e., we consider the increase in frequency by selection of rare genetic mutations that control the growth strat-egy. There is a stable monorphic female brain size in the population when rare mutants of the growth strategy cannot invade the population; that is, such resident growth strategy is “uninvadable”31, 32. We obtain an uninvadable growth strategy using evolutionary-invasion
analysis for function-valued traits, since the growth strategy is a function of time (age). Be-cause skill level ultimately depends on brain size due to energy conservation principles24, the evolution of brain size causes the evolution of skill level. Accordingly, a cooperating partner’s skill level and the difficulty of competitive challenges are evolving environments, which constitutes the ultimate distinction between ecological and social challenges in our analysis. Such evolving environment implements the notion that sociality can yield evolu-tionary arms races in cognition as proposed by social hypotheses8–10.
Energy extraction efficiency. An important quantity in the model is the individual’s
individual’s EEE as a function of her skill level and that of cooperating or competing peers. To do this, we consider two mathematical functions commonly used in contest models: a “power competence” function that allows for strongly-decelerating EEE as the individual gains skills when she is young, and an “exponential competence” function that allows for weaker deceleration (Fig. 2b and Extended Data Fig. 1c). We also let the skills of cooperat-ing partners interact in an additive, multiplicative, or “submultiplicative” (geometric mean) way (the geometric mean is a good descriptor of the average skill in the pair if peers have disparate skill levels). Additionally, we assume that if a sufficiently young individual fails to overcome a challenge, then she can extract energy from an environment facilitated by her mother.
Parameters. The model has: 4 basic parameters, collectively denoted byP, that specify the
proportion of each social challenge, and whose effects we study here; 13 further parameters, collectively denoted byQ, that measure the brain’s and other tissues’ metabolic costs, brain’s and other tissues’ size at birth, and demography, and for which empirical estimates are available; and a final 9 parameters, collectively denoted byR, that measure skill metabolic costs, maternal provisioning, mutation size, and how skill level affects energy extraction, and for which we use reasonable values given the available data (Fig. 2c; Supplementary In-formation section 4). For example,R-parameters include the metabolic cost of memory and the values we use for this (in megajoules per year per terabyte) fall within an empirically-estimated range for resting energy consumption for stored motor patterns in cerebellum Purkinje cells in rats33. The exact values used forRare chosen within such reasonable ranges
as they yield a high ontogenetic fit between predicted and observed body and brain mass in
brain is thought to be the metabolic costs of brain, which are incorporated in the estimated
Qparameters. The values chosen for theR-parameters mean that the difficulty of ecological challenges is high but not exceedingly so, memory is metabolically expensive (although in the low end of the empirically-estimated range), and skills are moderately-effective at over-coming the challenges. Using suchQandR-parameter values, it was previously shown that ecological challenges alone can generate adult brain and body sizes of ancient human scale: of lateH. erectusscale with strongly-decelerating EEE and of Neanderthal scale with weakly-decelerating EEE24. Here we use the sameQandRparameter values and study the effects of
the social-challenge parametersP.
Key equations. We assume that the population is large and mostly constituted by
individu-als with a resident growth strategy and by vanishingly rare individuindividu-als with a mutant growth strategy. At aget, a focal mutant individual has a mass of tissuei (fori ∈{b, r, s} for brain, reproductive, and somatic) ofxi(t) (in kilograms) and a skill level ofxk(t) (in terabytes). The growth rate of tissuei ∈{b, r, s} is
˙
xi(t)=
1
Eiui(t)
"
Brest(t)− X i∈{b,r,s}
Bixi(t)
#
, (1)
where ˙xi(t) denotes the derivative ofxi(t) with respect tot. The term in square brackets is
the growth-metabolic rate [Bsyn(t)], which equals the resting metabolic rate,Brest(t), minus the maintenance metabolic rate,P
i∈{b,r,s}Bixi(t). The metabolic cost of producing
(respec-tively, maintaining) a mass unit of tissuei isEi (respectively,Bi). The growth strategy is the
fraction of the growth-metabolic rate due to the production of each tissue throughout life, and for the mutant it is denoted byui(t) for alltand alli ∈{b, r, s} (orufor short). We let the
growth strategy be the evolving trait. In turn, the mutant skill growth rate is
˙
xk(t)=
1
Ek
£
skBrest,b(t)−Bkxk(t)
¤
The brain metabolic rate isBrest,b(t), and the metabolic cost of gaining (respectively, main-taining) a skill unit isEk (respectively,Bk). The fraction of brain metabolic rate allocated to energy-extraction skills issk. Resting metabolic rate is a power function of body mass,xB(t), and a function of EEE, which we denote bye(xk(t),yk(t)):
Brest(t)=K e(xk(t),yk(t))xBβ(t), (3)
whereyk(t) is the skill level at agetof a resident individual. The brain metabolic rate is the sum of brain’s maintenance and growth metabolic rates:
Brest,b(t)=Bbxb(t)+Ebx˙b(t). (4)
An uninvadable growth strategyu∗i(t) for allt and alli ∈{b, r, s} (oru∗) is a best response to itself (similar to a Nash equilibrium) regarding the lifetime number of offspring it yields31, 32 (see Evolutionary differential game below). We denote the tissue mass and skill level re-sulting from an uninvadable growth strategy asx∗i(t) for allt and alli ∈{b, r, s, k} (orx∗for short).
Switching times. With the parameter values we use, the uninvadable growth strategies
typ-ically produce a life history with four critical ages where the growth strategy changes sud-denly (called switching times in optimal control terminology): the age of brain growth on-set tb0, which is when allocation to brain growth starts; the age of brain growth arresttb, when allocation to brain growth stops; the age at maturitytm, when allocation to growth of reproductive tissue starts; and the age at adulthoodta, when allocation to growth of non-reproductive tissues stops. These four ages are an output, not parameters, of the model.
˙
xk∗(t) tends to 0 asttends toT, whereTis the age of menopause. Substituting this and Eq. (4) into Eq. (2) yields the asymptotic skill level
ˆ
xk=sk
Bb
Bk
x∗b(ta). (5)
Equations for energy extraction efficiency. In Supplementary Information section 2.1 we
show that EEE can be written as
e(xk(t),yk(t))=
4
X
j=1
Pj
· c
j
cj+dj +
dj
cj+djϕ
¸
. (6)
The term in square brackets (denoted byej) gives the energy extraction efficiency when
facing a challenge of type j and is composed of two terms. The first term is the proportion of time the individual succeeds at the challenge, and the second term is the proportion of time the individual fails at the challenge but extracts energy from maternal provisioning. The individual’s competence at a j-challenge iscj and in general depends on her own and
on her social partners’ skill level. The difficulty of a j-challenge isdj and in general depends on the social and non-social environment (i.e., on the social partners’ skill level and the constant environment). Because the mutant is rare, her social partners are residents. The energy extraction efficiency from maternal provisioning isϕ, which decreases with age.
Using our assumption of domain-general skills, we let the competence function be independent of the challenge type,cj(Gj(xk,yk))=c(Gj(xk,yk)), whereGj(xk,yk) is a pro-duction function describing how the skills of the cooperating partners interact (e.g., in an additive, multiplicative, or submultiplicative way). We consider two forms for the compe-tence function:
c(Gj(xk,yk))=
Gγj(xk,yk) with power competence
exp[Gj(xk,yk)]γ with exponential competence,
whereγmeasures the effectiveness (decidability) of skills at the challenge. The production functionGj(xk,yk) is
Gj(xk,yk)=
xk forj ∈{1, 3}
xk+yk forj ∈{2, 4} with additive cooperation
xkyk forj ∈{2, 4} with multiplicative cooperation
p
xkyk forj ∈{2, 4} with sub-multiplicative cooperation .
(8)
The difficultydj of a challenge depends on the challenge type. For an ecological or a
cooperative challenge, the challenge difficulty isαwhich depends on the “ecological” envi-ronment, which we assume constant (this assumption can be relaxed in future extensions; Supplementary Information section 9). In turn, the difficulty of a competitive challenge de-pends on the skill level of the individual’s competitors. Since the mutant is rare, a mutant’s competitors are residents, so the difficulty of a competitive challenge is the competence of the resident,c(Gj(yk,yk)). In general, the difficulty of a type-j challenge is
dj(yk)=
α forj ∈{1, 2}
c(Gj(yk,yk)) forj ∈{3, 4}.
(9)
We let the energy extraction efficiency from maternal provisioning when the individual is of agetbe
ϕ(t)=ϕ0exp(−ϕrt), (10)
whereϕ0is the energy extraction efficiency from maternal provisioning at birth andϕr mea-sures the rate of decrease of maternal provisioning. The resulting equations forej for all
Evolutionary differential game. LetR0(u,v) be the expected lifetime number of offspring of a mutant with growth strategyuwhen the resident growth strategy isv. We assume that the population is kept at a constant size due to density dependence competition through fertility rather than survival. Hence, an uninvadable growth strategyu∗maximizes the mu-tant’s lifetime number of offspring when the mutant is resident34. That is, the mutant
satis-fies
u∗∈arg max
u∈UR0(u,u
∗), (11)
whereUis the set of feasible growth strategies. Assuming that the mortality rateµis con-stant (which can be relaxed in future extensions; Supplementary Information section 9) and that reproductive tissue is narrowly defined so it is not involved in offspring maintenance (e.g., defined as preovulatory ovarian follicles), the mutant’s lifetime number of offspring whenvis resident is
R0(u,v)∝
Z T
0
exp(−µt)xr(t)dt. (12)
Eq. (11) poses a differential game problem: it is a “game” between mutant and resident be-cause the mutant’s payoff [R0(u,v)] depends on the resident strategy, it is “differential” be-cause it depends on differential equations [Eqs. (1) and (2)], and it is “evolutionary” rather than a typical differential game because only the mutant’s payoff is maximized rather than both the mutant and resident’s payoffs. Because problem (11) involves maximization and its solutions are functions (u∗,x∗), this maximization poses an optimal control problem. We solve problem (11) numerically by iterating optimal control problems until convergence to a point where the mutant and resident strategies are indistinguishable to a chosen extent. To do so, we use the software GPOPS35.
Figure specifications. For Fig. 3a–b, plots are around only ecological challenges; that is, for
quali-tative effect determined in Fig. 3a–b of increasing the proportion of a social challenge as the proportion of ecological challenge decreases, or of increasing the proportion of ecological challenges as the proportion of cooperative challenges decreases. The patterns in Fig. 3a-c also hold around the best-fittingP∗forH. sapiens; that is, when for a given plot, the remain-ing twoPj’s are set to the values ofP∗(Extended Data Figs. 4b,c). “Missing” dots in Fig. 3d
arePj-combinations that did not converge to an uninvadable growth strategy [e.g., due to
cycling solutions, suggesting possible evolutionary branching (female dimorphism) in brain size] or that were unreachable from lack of convergence of nearby runs (Supplementary In-formation section 5). For Fig. 3a–e, cooperation is submultiplicative, and for Fig. 3d–e, com-petence is exponential (see Extended Data Fig. 4 for all cases).
Fig. 4a shows the hominin species for which we find a near-perfect adult fit (i.e., where the best adult fit is greater than the chosen threshold of −D(τa)= −0.05; Extended Data Figs. 6–8). For Fig. 4a, cooperation is submultiplicative (resp. additive) for weakly- (resp. strongly-) decelerating EEE. In Fig. 4b, dots are the values for an averageH. sapiensfemale as reported by ref.21. The resulting life periods in Fig. 4b are defined as “childhood”, where
Code availability. Code that supports the findings of this study is available in Zenodo with the identifier https://doi.org/10.5281/zenodo.1197479.
Data availability. Data of predicted brain size, body size, and skill level for the various
chal-lenge combinations as generated by this study and as used for Figs. 3 and 4 and Extended Data Figs. 4 and 6–8 have been deposited in Zenodo with the identifier
https://doi.org/10.5281/zenodo.1197479. Complete numerical solutions including growth strategies across the parameter sweep totalling 200 GB of data are available from the corre-sponding author upon request.
31. Lehmann, L., Mullon, C., Akçay, E. & Van Cleve, J. Invasion fitness, inclusive fitness, and reproductive numbers in heterogeneous populations.Evolution70, 1689–1702 (2016).
32. Lion, S. Theoretical approaches in evolutionary ecology: environmental feedback as a unifying perspective.Am. Nat.191, 21–44 (2018).
33. Howarth, C., Peppiatt-Wildman, C. M. & Attwell, D. The energy use associated with neural computation in the cerebellum.J. Cereb. Blood Flow Metab.30, 403–414 (2010).
34. Mylius, S. D. & Diekmann, O. On evolutionarily stable life histories, optimization and the need to be specific about density dependence.Oikos74, 218–224 (1995).
35. Patterson, M. A. & Rao, A. V. GPOPS-II: A MATLAB Software for solving multiple-phase optimal control problems using hp-adaptive Gaussian quadrature collocation methods and sparse nonlinear programming.ACM Trans. Math. Softw.41, 1–37 (2014).
0.00 0.25 0.50 0.75 1.00
0.0 2.5 5.0 7.5 10.0
0.00 0.25 0.50 0.75 1.00
0.0 2.5 5.0 7.5 10.0
0.0 0.5 1.0
0.0 2.5 5.0 7.5 10.0
Energy extraction efficiency, e Speed of
energy extraction efficiency, �e/�xk
Acceleration of energy extraction efficiency, �2e/�x
k2
Skill level, xk [TB]
Power competence Exponential competence
a
[ ]
[TB
-1]
[TB
-2]
Extended Data Figure 1: Shape of EEE vs skill. a–c, Plots of energy extraction efficiency
0.0 0.5 1.0 1.5
0 1 2 3 4 5
0 20 40 60
0 2 4 6
0.00 0.05 0.10
0 5 10 15 20
b
c
Iteration
d
e
f 0.00
0.25 0.50 0.75 1.00
0.00 0.25 0.50 0.75 1.00
0.00 0.25 0.50 0.75 1.00
0.00 0.25 0.50 0.75 1.00
0.00 0.25 0.50 0.75 1.00
0.00 0.25 0.50 0.75 1.00
0.00 0.25 0.50 0.75 1.00
0 10 20 30 40 0 10 20 30 40 0 10 20 30 40
●● ●●●●
●●● ●●●
●●●● ●
● ●
●●●●●●● ●●●●●●● ●
0.00 0.25 0.50 0.75 1.00
0 20 40 60
0.0 0.5 1.0 1.5
0 10 20 30 40 0 10 20 30 40 0 10 20 30 40
●● ●●●●
●●● ●●
●●●●● ●
● ●
●●●●●●●●●●●● ●● ●
0.00 0.25 0.50 0.75 1.00
0 20 40 60
0.0 0.5 1.0 1.5
0 10 20 30 40 0 10 20 30 40 0 10 20 30 40
●● ●●●●
●●● ●●
●●●●● ●
● ●
●●●●●●● ●●●●●●● ●
0.00 0.25 0.50 0.75 1.00
0 20 40 60
0.0 0.5 1.0 1.5
0 10 20 30 40 0 10 20 30 40 0 10 20 30 40
●● ●●●●
●●● ●●
●●●●● ●
● ●
●●●●●●●●●●●● ●● ●
0.00 0.25 0.50 0.75 1.00
0 20 40 60
0.0 0.5 1.0 1.5
0 10 20 30 40 0 10 20 30 40 0 10 20 30 40
● ●
●● ●●
●● ●
● ●
● ●●
●● ●
0 20 40 60
0 10 20 30 40
a Growth strategy
Iteration: (1)
(4)
(7)
(10)
(13)
(16)
(19)
Exponential competence
Submultiplicative cooperation, EC-SC P
1
= 0.9,
P2
= 0,
P3
= 0.1,
P4
= 0
Age [y] Brain, ub*
Soma, us*
Repr., ur*
Allocation to production of [ ]:
Model
H. sapiens
Brain, xb*(ta)
Skill level, xk*(ta)
Body, xB*(ta)
EQ maxt |u*(t)–v(t)|
Power competence
Exponential competence
Previous
implementation
Previous
implementation
Current
implementation
Current
implementation
Age [y]
Growth strategy [ ] Brain mass [kg] Body mass [kg] g
Age [y]
Body mass
[kg]
Model, xB* H. sapiens, XB
(1) (3) (2)
h
[kg]
[TB]
[kg]
[ ]
[ ]
tb0tbtm ta
tb0 tb
tm ta
Age when brain growth starts Age when brain growth stops
Age when reproductive growth starts (age at maturity) Age when non-reproductive growth stops (age at adulthood)
u*
Maternal provisioning:
Model
H. sapiens H. erectusH. neanderthalensis
Extended Data Figure 2: Method implementation. a, Typical result with convergence to an uninvadable growth strategy. For the (i)-th iteration, the growth strategy shown is the resident (v) whose best response (ue
∗) is shown next, which is the resident of the (i+1)-st
iteration. Convergence to a best response to itself (u∗) was declared visually (in a at it-eration 21). b–f, Reporting variables across the iterations ina. b–e, Resulting adult body mass, brain mass, skill level, and EQ through iterations. These values tend to converge more quickly than the growth strategy (a). f, Rather than visually declaring convergence, con-vergence should ideally be declared when the difference between mutant and resident is below a chosen threhold. However, numerical jittering prevents the use of this criterion. For example,fshows the maximum of|ue
∗(t)−v(t)|acrosstfor each iteration ina. Without
nu-merical jittering, this maximum should decrease as the growth strategy approaches a best response to itself. Yet, numerical jittering causes this maximum to be at least equal to the maximum mutation sizeδ=0.1. The maximum of|ue
∗(t)−v(t)|is occasionally greater than δbecauseue
∗andvhave different partitions overt. Thus, to calculate| e
u∗(t)−v(t)|, for each
t in thet-partitioning ofue
∗, we find the closesttin thet-partitioning ofvand calculate the
difference at these relatively close times; this may occasionally cause the difference to be larger thanδwhen strategies change suddenly witht. Alternative measures of convergence were similarly inadequate (e.g.,P
t|ue
∗(t)−v(t)|). g,We implement maternal provisioning
differently than before24to incorporate it when there are social challenges. The difference
●● ●●●● ● ●●●●●● ● ●● ●●●● ● ●● ●●●●● ●● ●●●●● ●● ●●●●● ●●●●●●●●● ●●●●●●●●● ●●●●●●●●● ●●●●●●●●●● ●●●●●●●●●● ●●●●●●●●●● ●● ●●● ●●●● ●● ●●●●●●● ●● ●●● ●●●● ● ●●●● ● ●● ● ●●●● ● ●● ● ●●●●● ● ● ●● ●● ● ● ● ● ● ● ● ● ● ● ● ● ● ● ● ●● ●● ● ●● ● ● ● ● ● ● ● ● ● ● ● ● ●● ●● ● ● ● ● ● ● ● ● ● ● ● ● ● ● ● ●●●● ● ●●●● ● ●●●● ●
0.0 0.5 1.0 1.5 0.00 0.25 0.50 0.75 1.00 0.00 0.25 0.50 0.75 1.00 0.00 0.25 0.50 0.75 1.00 0.0 0.5 1.0 1.5 0 250 500 750 1000 0 30 60 90 0 2 4 6 8 0.0 0.5 1.0 1.5 0 25 50 75 0 2 4 6 8 ● ●●● ●● ●●●●●● ●●● ●●● ●●●●●●● ●● ●●●●● ●●●●●●● ●●●●● ●●●●● ●●●●● ●●●●● ●●●● ● ●●●● ● ●● ●● ●●●●●●●●● ●●● ●● ●●●●●●●● ●●●●●●●●●●●●● ● ● ●●●●●● ● ● ● ● ● ●●●●●●● ● ● ●●●●●●●●● ● ● ●● ●● ● ● ● ● ● ● ● ●●● ●● ●● ● ● ● ● ● ● ● ●●● ●● ●●● ●● ● ● ● ● ●●● ●●● ●●●●●● ●●●●●●●●● ●●●●●●●●●
0.0 0.3 0.6 0.9 0.00 0.25 0.50 0.75 1.00 0.00 0.25 0.50 0.75 1.00 0.0 0.1 0.2 0.3 0.4 0.5 0 1 2 3 0 250 500 750 1000 0 10 20 30 40 50 0.0 2.5 5.0 7.5 0.0 0.3 0.6 0.9 0 20 40 60 80 0 2 4 6 8 ● ●●●●●●● ● ● ●●●●●●● ● ● ●●●●●●● ● ● ● ●●●●●●●●●● ● ● ●●●●●●●●●● ● ● ● ● ● ● ● ● ● ● ● ● ● ● ● ● ● ●●●●●●●●●● ● ● ●●●●●●●●●● ● ● ● ● ● ● ● ● ● ● ● ● ● ● ● ● ● ●●●●●●●●●● ● ● ●●●●●●●●●● ● ● ● ● ● ●●●●● ●●●●● ●●●●●●●● ● ● ● ● ● ● ●● ● ● ●●●●●●●● ● ●●●●● ● ● ● ● ● ●●●● ●●● ● ● ● ● ● ● ● ●●●● ●● ● ● ● ● ● ● ● ● ●●●●
200 250 300 350 0 1000 2000 3000 26 28 30 32 0 10 20 30 40 50 0 1 2 3 0 25 50 75 100 125 0.0 2.5 5.0 7.5 ● ● ● ● ● ● ● ●●●● ● ● ● ● ● ● ● ●●●● ● ● ● ● ● ● ●●●●● ● ● ● ● ●●●● ● ● ● 0 50
100 150 200 0 50 100 150 200 0 50 100 150 200 0 50 100 150 200 0 2 4 6 8 0 2 4 6 8 0 25 50 75 100 0 1 2 3 ● ●●●●●●●●●●● ● ● ● ● ●●●●●●●●●●● ● ● ● ● ●●●●●●●●●●● ● ● ● ● ● ●●●●●●●●●● ● ● ●●●●●●●● ● ● ● ● ● ● ● ● ● ● ● ● ●● ●● ● ● ●●●●●●●●●● ● ● ●●●●●●●● ● ● ● ● ● ● ● ● ● ● ● ● ●● ●● ● ● ●●●●●●●●●● ● ● ●●●●●●●● ● ● ● ● ● ● ● ● ● ● ● ● ●● ●● ●●●●●●● ● ● ● ● ● ● ● ●● ● ● ●●●●●●● ● ● ●● ●● ● ● ● ● ● ● ● ● ● ● ● ● ● ● ● ●● ●● ● ● ● ● ● ● ● ● ● ● ● ● ● ● ● ●● ●● ● ● ● ● ● ● ● ● ● ● ● ● ● ● ●
200 300 400 500 600 700 0 1000 2000 3000 25.0 27.5 30.0 32.5 0 30 60 90 0 1 2 3 4 0 50 100 150 0 3 6 9 ● ● ● ● ● ● ● ●●●● ● ● ● ● ●● ● ● ●●● ● ● ● ● ● ● ●●●●● ● ● ● ● ●●●●● ● ● 0 50
100 150 200 0 50 100 150 200 0 50 100 150 200 0 50 100 150 200 0 2 4 6 8 0.0 2.5 5.0 7.5 0 25 50 75 100 125 0 1 2 3 4
Brain mass [kg] Repr. mass [kg] Soma mass [kg] Skill level [TB] Brain mass [kg] Repr. mass [kg] Soma mass [kg] Skill level [TB]
Power competence Exponential competence
Brain mass [kg]
Body mass [kg]
EQ [ ]
Bb [MJ/(kg y)] Br [MJ/(kg y)] Bs [MJ/(kg y)] Bk [MJ/(TB y)] Bb [MJ/(kg y)] Br [MJ/(kg y)] Bs [MJ/(kg y)] Bk [MJ/(TB y)]
Brain mass [kg]
Body mass [kg]
EQ [ ]
Bb [MJ/(kg y)] Br [MJ/(kg y)] Bs [MJ/(kg y)] Bk [MJ/(TB y)] Bb [MJ/(kg y)] Br [MJ/(kg y)] Bs [MJ/(kg y)] Bk [MJ/(TB y)]
Br [MJ/(kg y)] Br [MJ/(kg y)] Br [MJ/(kg y)] Br [MJ/(TB y)]
Brain mass [kg] Body mass [kg] EQ [ ] Repr. mass [kg] Brain mass [kg] Body mass [kg] EQ [ ] Repr. mass [kg]
Br [MJ/(kg y)] Br [MJ/(kg y)] Br [MJ/(kg y)] Br [MJ/(TB y)]
α [TBγ] sk [ ] φ0 [ ] φr [1/y] γ [ ] Ek [MJ/TB] Bk [MJ/(TB y)] xk0 [TB] α [ ] sk [ ] φ0 [ ] φr [1/y] γ [TB-1] Ek [MJ/TB] Bk [MJ/(TB y)] xk0 [TB] Brain mass [kg]
Body
mass [kg]
EQ [ ]
Brain mass [kg]
Body mass [kg]
EQ [ ]
Br = 2700 MJ/(kg y)
Br = 2000 MJ/(kg y)
Br = 1000 MJ/(kg y)
Br = 100 MJ/(kg y) Br = 70 MJ/(kg y) Br = 60 MJ/(kg y)
Age [ ]
Growth strategy [ ] Mass (zoom) [kg] Mass [kg]
Brain, ub* Soma, us* Repr., ur* Allocation to production of [ ]:
Brain, xb* Soma, xs* Repr., xr* Mass of: Body, xB* Model, xi* H. sapiens, XB Adult fit with H. sapiens
a c e g ● ● ● ● ● ● ● ● 0.00 0.25 0.50 0.75 1.00 0.00 0.25 0.50 0.75 1.00 0.00 0.25 0.50 0.75 1.00
0.00 0.25 0.50 0.75 1.00 0.00 0.25 0.50 0.75 1.00 0.00 0.25 0.50 0.75 1.00
−1.5 −1.0 −0.5 0.0
Ontogenetic fit with H. sapiens ● ● ● ● ● ● ● ● 0.00 0.25 0.50 0.75 1.00 0.00 0.25 0.50 0.75 1.00 0.00 0.25 0.50 0.75 1.00
0.00 0.25 0.50 0.75 1.00 0.00 0.25 0.50 0.75 1.00 0.00 0.25 0.50 0.75 1.00
−1.5 −1.0 −0.5 0.0
i < –1.5 < –1.5 b d f h ● ● ●●●●●●●●●●●●●● ● ●●● ●●●●● ●●●● ●●●● ●
0 10 20 30 40 0 10 20 30 40 0 10 20 30 40 0 20 40 60 0.0 0.5 1.0 1.5 0.00 0.25 0.50 0.75 1.00 ● ● ●●●●●●●●●●●●●● ● ●●● ●●●●● ●●●● ●●●● ●
0 10 20 30 40 0 10 20 30 40 0 10 20 30 40 0 20 40 60 0.0 0.5 1.0 1.5 0.00 0.25 0.50 0.75 1.00 ● ● ●●●●●●●●●●●●●● ● ●●● ●●●●● ●●●● ●●●● ●
0 10 20 30 40 0 10 20 30 40 0 10 20 30 40 0 20 40 60 0.0 0.5 1.0 1.5 0.00 0.25 0.50 0.75 1.00 ●●●●●●●●●●●●●●●● ● ●●● ●●●●● ●●●● ●●●● ●
0 10 20 30 40 0 10 20 30 40 0 10 20 30 40 0 20 40 60 0 1 2 3 4 5 0.00 0.25 0.50 0.75 1.00 ●●●●●●●●●●●●●●●● ● ●●● ●●●●● ●●●● ●●●● ●
0 10 20 30 40 0 10 20 30 40 0 10 20 30 40 0 20 40 60 0.0 2.5 5.0 7.5 0.00 0.25 0.50 0.75 1.00 ●●●●●●●●●●●●●●●● ● ●●●●●●● ●●●● ●●●●● ●
0 10 20 30 40 0 10 20 30 40 0 10 20 30 40 0 25 50 75 0.0 2.5 5.0 7.5 10.0 0.00 0.25 0.50 0.75 1.00
tb0tbtmta
tb0 tb tm ta
Age when brain growth starts Age when brain growth stops Age at maturity
Age at adulthood ● ●●●●●●●●●●● ● ● ● ● ● ●●●●●●●●●● ● ● ●●●●●●●●● ● ● ● ● ● ● ● ● ● ● ● ● ● ● ● ● ● ● ● ● ●● ● ● ● ● ●● ● ● ● ● ● ● ● ● ● ● ● ● ● ● ●
200 300 400 500 600 700 0 1000 2000 3000 25.0 27.5 30.0 32.5 0 30 60 90 0.0 2.5 5.0 7.5 10.0 0 50 100 150 0 2 4 6 8 0.0 0.5 1.0 1.5 2.0 2.5 ● ●●●●●●● ● ● ● ●●●●●●●●●● ● ● ●●●●●●●●●● ● ● ● ● ● ● ● ● ● ● ● ● ● ● ● ● ● ● ● ● ●● ● ● ● ● ● ● ● ● ● ● ● ● ●●●●
Extended Data Figure 3: Effects of Q and R parameters. a-b,Effects of maintenance costs (Bi) on the corresponding tissue mass or skill level. Each Bi tends to decrease the value xi∗(τa) of the correspondingi, but not necessarily of the otheri [see (c-d)]. c-d,Effect ofBi
on adult brain mass, body mass, and EQ. With power competence (c), whenBb=310 and 340 MJ/(kg y), the predicted adult brain mass isxb∗(τa)=1.0298 and 0.9133 kg, respectively. With exponential competence (c), when Bb =310, 340, and 370 MJ/(kg y), the predicted adult brain mass isxb∗(τa)=1.542, 1.3973, and 1.2767 kg, respectively.e-f,Effects ofBrwhen
Bris small. WhenBrvaries between 70 and 2700 MJ/(kg y),Brhas no detectable effect on adult brain mass and EQ.g-h, Ontogenetic fit withH. sapiens around the used values for each of theRparameters (exceptδ). The ontogenetic fit is approximately maximized around the benchmark values chosen previously24which are also used here (except forϕ
0given our improved implementation ofϕ).i,Effect ofBron the predicted life history with exponential competence. Fori, in the left column, from top to bottom row, asBrdecreases, the alloca-tion to the growth of reproductive tissue during adolescence increases (ur∗betweentmand
ta) and adolescence shortens. Fori, in the central column, the increased allocation to the growth of reproductive tissue increases the mass of reproductive tissue, but brain mass does not change withBr forBr≥70 MJ/(kg y). For i, in the right column, as the mass of repro-ductive tissue increases, body mass increases slightly, which is more noticeable forBr≤100 MJ/(kg y). An exceedingly smallBr[<70 MJ/(kg y)] disrupts the predicted life history, which withBr=60 MJ/(kg y) is severely different from that ofH. sapiens(e.g., there is brain growth late in life and reproductive growth from birth). Similar results arise for still smallerBr. In
Additive cooperation Power competence Multiplicative cooperation ● ● ● ● ● ● ● ● ● ● ● ● ● ● ● ● ● ● ● ● ● ● ● ● ● ● ● ● ● ● ● ● ● ● ● ● ● ● ● ● ● ● ● ● ● ● ● ● ● ● ● ● ● ● ● ● ● ● ● ● ● ● ●
0.00 0.25 0.50 0.75 1.00 0.00 0.25 0.50 0.75 1.00 0.00 0.25 0.50 0.75 1.00 0.00 0.25 0.50 0.75 1.00 0 20 40 0 2 4 6 ● ● ● ● ● ● ● ● ● ● ● ● ● ● ● ● ● ● ● ● ● ● ● ● ● ● ● ● ● ● ● ● ● ● ● ● ● ● ● ● ● ● ● ● ● ● ● ● ● ● ● ● ● ● ● ● ●
0.00 0.25 0.50 0.75 1.00 0.00 0.25 0.50 0.75 1.00 0.00 0.25 0.50 0.75 1.00 0.0 0.5 1.0 1.5 0 20 40 60 0 2 4 6 8 Submultiplicative cooperation
Around best fitting eco-social scenario
● ● ● ● ● ● ● ● ● ● ● ● ● ● ● ● ● ● ● ● ● ● ● ● ● ● ● ● ● ● ● ● ● ● ● ● ● ● ● ● ● ● ● ● ● 0.0 0.5 1.0 1.5 0 20 40 60 0 2 4 6
0.00 0.25 0.50 0.75 1.00 0.00 0.25 0.50 0.75 1.00 0.00 0.25 0.50 0.75 1.00 Around ecological challenges
Brain mass
[kg]
Body mass
[kg]
EQ [ ]
Brain mass
[kg]
Body mass
[kg]
EQ [ ]
Brain mass
[kg]
Body mass
[kg]
EQ [ ]
Proportion of
cooperation, P2 individual competition, P3Proportion of between- Proportion of between-group competition, P4 cooperation, P2Proportion of individual competition, P3Proportion of between- Proportion of between-group competition, P4
Proportion of
cooperation, P2 individual competition, P3Proportion of between- Proportion of between-group competition, P4
Submultiplicative cooperation
Brain mass
[kg]
Body mass
[kg]
EQ [ ]
Exponential competence
Exponential competence
Adult fit with H. sapiens ● ● ● ● ● ● ● ● 0.00 0.25 0.50 0.75 1.00 0.00 0.25 0.50 0.75 1.00 0.00 0.25 0.50 0.75 1.00
0.00 0.25 0.50 0.75 1.00 0.00 0.25 0.50 0.75 1.00 0.00 0.25 0.50 0.75 1.00
−1.5 −1.0 −0.5 0.0
a
b
Around ecological challenges Power competence
AC
Ecological (me vs nature) Cooperative (us vs nature) Between-individual competitive (me vs you) Between-group competitive (us vs them)
Challenge type Brain Body EQ Brain Body EQ Brain Body EQ Brain Body EQ Brain Body EQ Brain Body EQ
MC SC AC Exponential competenceMC SC
Brain Body EQ SC Around best-fitting eco-social scenario EC ● ● ● ● ● ● ● ● ● ● ● ● ● ● ● ● ● ● ● ● ● ● ● ● ● ● ● ● ● ● ● ● ● ● ● ● ● ● ● ● ● ● ● ● ● ● ● ● ● ● ●
0.00 0.25 0.50 0.75 1.00 0.00 0.25 0.50 0.75 1.00 0.00 0.25 0.50 0.75 1.00 0.0 0.5 1.0 1.5 0 20 40 60 0 2 4 6 8 ● ● ● ● ● ● ● ● ● ● ● ● ● ● ● ● ● ● ● ● ● ● ● ● ● ● ● ● ● ● ● ● ● ● ● ● ● ● ● ● ● ● ● ● ● ● ● ● ● ● ● ● ● ● ● ● ● ● ● ● ● ● ●
0.00 0.25 0.50 0.75 1.00 0.00 0.25 0.50 0.75 1.00 0.00 0.25 0.50 0.75 1.00 0.00 0.25 0.50 0.75 1.00 0 20 40 0 2 4 6 ● ● ● ● ● ● ● ● ● ● ● ● ● ● ● ● ● ● ● ● ● ● ● ● ● ● ● ● ● ● ● ● ● ● ● ● ● ● ● ● ● ● ● ● ● ● ● ● ● ● ● ● ● ● ● ● ●
0.00 0.25 0.50 0.75 1.00 0.00 0.25 0.50 0.75 1.00 0.00 0.25 0.50 0.75 1.00 0.00 0.25 0.50 0.75 1.00 0 20 40 60 0 2 4 6 ● ● ● ● ● ● ● ● ● ● ● ● ● ● ● ● ● ● ● ● ● ● ● ● ● ● ● ● ● ● ● ● ● ● ● ● ● ● ● ● ● ● ● ● ●
Extended Data Figure 4:Effects of challenge types on brain size. Ina-b,outer rows are for the cooperation cases considered; outer columns are for the competence cases.ais around the pure ecological scenario (i.e., in a given plot forPj asP1decreases, the remaining two
Pj’s are set to zero). bis around the best fitting scenario forH. sapiens(i.e., in a given plot
forPj asP1decreases, the remaining twoPj’s are set to the best fittingP∗found in Fig. 3d
0.0 0.5 1.0
0 1 2 3
0 10 20 30 40 50
0 2 4 6
3 6 9
0.0 0.5 1.0 1.5
0 1 2 3 4
0 10 20 30 40 50
0 2 4 6
0 10 20
0 1 2
0 2 4 6 8
0 20 40 60 80
0 3 6 9
2 4 6
0.0 0.5 1.0
0.0 0.5 1.0 1.5 2.0
0 10 20 30 40 50
0 2 4 6
0 20 40 60
0.0 0.5 1.0 1.5
0 1 2 3 4
0 20 40
0 2 4 6 8
0 10 20 30
Exponential competence Submultiplicative cooperation, EC-SC
P1 = 0.4, P2 = 0.4, P3 = 0.2, P4 = 0
Power competence Submultiplicative cooperation, PC-SC
P1 = 0.2, P2 = 0.3, P3 = 0.1, P4 = 0.4
Exponential competence Multiplicative cooperation, EC-MC P1 = 0.5, P2 = 0.4, P3 = 0, P4 = 0.1
Exponential competence Submultiplicative cooperation, EC-SC
P1 = 0.3, P2 = 0.5, P3 = 0.2, P4 = 0
Power competence Submultiplicative cooperation, PC-AC
P1 = 0.3, P2 = 0.2, P3 = 0, P4 = 0.5
Iteration
Iteration
Iteration Iteration
Iteration
Model H. sapiens Brain, xb*(ta) Skill level, xk*(ta) Body, xB*(ta) EQ a
[kg]
[TB]
[kg]
[ ]
[kg]
[TB]
[kg]
[ ]
[kg]
[TB]
[kg]
[ ]
[kg]
[TB]
[kg]
[ ]
[kg]
[TB]
[kg]
[ ]
b c
Extended Data Figure 5: Typical results when there is convergence to no brain growth
or when there is no convergence to an uninvadable growth strategy. a–e, Adult values