The Elicitation Interview Technique: Capturing
People’s Experiences of Data Representations
Trevor Hogan, Uta Hinrichs and Eva Hornecker
Abstract—Information visualization has become a popular tool to facilitate sense-making, discovery and communication in a large range of professional and casual contexts. However, evaluating visualizations is still a challenge. In particular, we lack techniques to help understand how visualizations are experienced by people. In this paper we discuss the potential of the Elicitation Interview technique to be applied in the context of visualization. The Elicitation Interview is a method for gathering detailed and precise accounts of human experience. We argue that it can be applied to help understand how people experience and interpret visualizations as part of exploration and data analysis processes. We describe the key characteristics of this interview technique and present a study we conducted to exemplify how it can be applied to evaluate data representations. Our study illustrates the types of insights this technique can bring to the fore, for example, evidence for deep interpretation of visual representations and the formation of interpretations and stories beyond the represented data. We discuss general visualization evaluation scenarios where the Elicitation Interview technique may be beneficial and specify what needs to be considered when applying this technique in a visualization context specifically.
Index Terms—Qualitative evaluation, psychophenomenology, phenomenology, elicitation interview technique, thematic analysis
F
1
INTRODUCTION
Application areas of information visualization no longer just focus on the support of analytical tasks of domain experts, but include everyday, casual scenarios [37], rang-ing from personal reminiscrang-ing [43], [44], storytellrang-ing [40], browsing for personal interest or edutainment [4], [13], [45], to community-driven urban scenarios [3]. Studies that investigate people’s experiences with visualizations from a qualitative point of view, are important to deepen our understanding of the role of visualization in society, to inform design, and to inspire new research questions.
Recent large-scale literature surveys show that while evaluation is starting to play an important role in visual-ization research, studies predominantly address questions regarding user performance, usability of visualization fea-tures, and algorithms—studies that focus on open-ended questions regardinginsight and discoveryandexperiences with visualizations are relatively rare [17], [20]. When we talk about “experience” in this context, we mean personal re-sponses to a visualization system that go beyond interaction and usability aspects but focus on capturing hedonistic, emotional, and sensory reactions to the visualization as well as personal interpretations, meaning, and opinions that it may trigger. One possible reason why there is little work on subjective experiences with visualizations, processes of analysis, reasoning and knowledge discovery and commu-nication [20] is that we still lack evaluation methods that can
• Trevor Hogan is with Crawford College of Art and Design, Cork Institute of Technology, Ireland.
E-mail: [email protected]
• Uta Hinrichs is with the SACHI group, School of Computer Science, University of St Andrews, UK.
E-mail: [email protected]
• Eva Hornecker is a Professor of HCI at the Faculty of Media at the Bauhaus-Universit¨at Weimar, Germany.
E-mail: [email protected]
Manuscript received xxx.
derive reliable and rich data on these types of aspects. Capturing subjective experience in a scientific way is a challenge. Apart from the fact that people find it inherently difficult to describe their experiences, the validation of these accounts is also complicated due to issues such as post-hoc rationalisation and humans’ innate desire to embellish accounts with details that did not occur during the original experience [35]. Research fields, such as Human-Computer Interaction (HCI), have long since embraced experience research as an important aspect of design. The shift from evaluating performance to researching experience has stim-ulated a rich discourse around topics such as hedonics [11], affect [52], empathy [50], and enchantment [25]. Gaining an understanding of people’s experiences may not reveal de-tails about specific design elements; however, it does allow us to investigate how visualizations shape the way people feel and think as they interpret them. This knowledge can be used to reflect more effectively upon design decisions.
We believe that it is time to introduce and explore variations of qualitative evaluation methods that allow us to capture and understand analysis processes and experiences with static and interactive data representations. We start this by introducing the Elicitation Interview technique1, which
was originally designed by the psychologist Pierre Verm-ersch in an educational context. As a form of retrospective interviewing, this technique focuses on a particular experi-ence (e.g., reading and interpreting a data representation). In contrast to other interview techniques the Elicitation Interview is based on iterative questioning where the partic-ipant is encouraged to describe their experience repeatedly at finer levels of granularity. This includes asking about the (physical) context in which the experience took place and sensory aspects that accompanied it. Present tense is used during the interview to help the participant “re-enact”
the experience. The technique was specifically designed to capture rich experience accounts while minimizing biases introduced through post-rationalization [46]. It has been used in a range of contexts, for example, to capture expe-riences with technology [21], the unfolding of an intuitive experience [35], and to enable sufferers of epileptic seizures to become aware of unconscious behaviours immediately prior to the onset of an attack [33].
We claim that the Elicitation Interview technique is a valuable addition to current evaluation techniques used in visualization research. We have conducted a study that demonstrates the technique’s potential to capture subjective experiences with data representations. Our findings show that the Elicitation Interview brings to the fore people’s interpretations of individual representation aspects, and how they arrive at these interpretations by actively seeking for personal connections, rich meaning, and stories. This questions previous assumptions which claim that over- or miss-interpretation of visualizations can be avoided through design [1]. While the Elicitation Interview does not provide direct design considerations, it can help to unearth problems or strengths of a visualization design and point towards potential solutions. With this paper we contribute:
– The introduction and description of the Elicitation Inter-view technique from a visualization perspective.
– A study that exemplifies how the Elicitation Interview technique can be applied in the visualization context, and what types of findings can be derived from it.
– Practical considerations of how to apply this technique to evaluate information visualizations.
– A discussion of how the technique can be applied to different visualization evaluation scenarios and future research questions it brings to the fore.
2
STUDYING
EXPERIENCES OF
VISUALIZATIONS
Evaluation has become a prominent topic in visualization research, and previous literature describes a range of tech-niques that can be applied to studying visualization sys-tems. Carpendale provides a thorough overview of quan-titative and qualitative methods applicable to information visualization, outlining their strength and weaknesses [7]. Munzner discusses evaluation methods focusing on the different stages of the visualization design process [27]. Lam et al. have identified seven evaluation scenarios, including those that focus on understanding the data analysis process and those that aim at deepening our understanding of visualization techniques [20]. Based on these they provide an overview of possible evaluation goals, questions, and methods to facilitate the study design process.
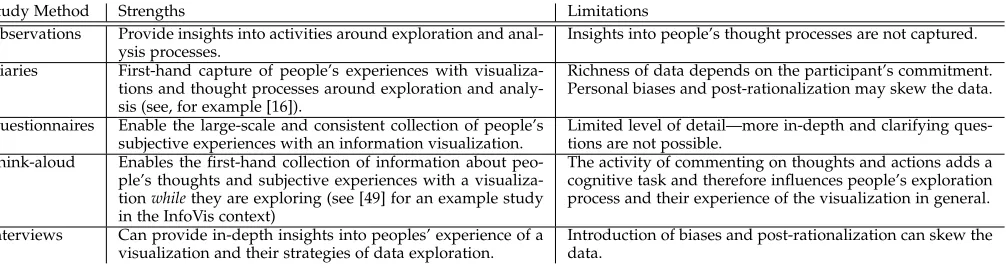
Common evaluation techniques that are used to investi-gate how people form insight and make discoveries using visualization include observations, diaries, questionnaires, think-aloud procedures, and interviews (see Table 1). All these techniques are not necessarily specific to the area of visualization, but have been used in this context to explore visual analysis processes, the usability, and (more rarely) subjective experiences with visualization systems. An in-depth discussion of these techniques is beyond the scope of this paper, and previous work provides an excellent overview [7], [20], [27]. Here we highlight that these tech-niques span a spectrum that ranges from techtech-niques eliciting
insights from observations that are then analyzed and inter-preted by a researcher, and techniques where participants are asked to directly comment on their experiences. The limitation of the first approach is the lack of insights on thought processes which cannot be observed; the latter runs the risk of introducing post-rationalization or biases through the participant and/or the researcher (see Table 1). We argue that the Elicitation Interview technique can help to gain in-depth insights into people’s approaches, processes, and subjective experiences of data anaylsis and interpretation of information visualizations while, at the same time, minimiz-ing the problem of post-rationalization.
As the name suggests, the Elicitation Interview tech-nique is a special form of interview. Interviews are a com-mon technique to gather opinions of participants after they have interacted with a visualization system or to learn about existing work strategies to inform the design of a visualization. The data acquired during an interview can be rich in insights, going beyond potential pre-assumptions of the interviewer and superficial opinions of the partici-pant. However, while interviews are frequently conducted to evaluate visualizations, we found that the type and interview approach are rarely specified—researchers rarely explain how exactly the interview was conducted, beyond stating its duration and, sometimes, its “structured”, “semi-structured”, or “open-ended” character. Furthermore, in-terview questions typically focus on usability aspects and do not explore actual experiences and insight generation processes [20]. Admittedly, these latter aspects are difficult to capture in an interview without introducing bias. To counteract this, interviews can be conducted in combina-tion with video recordings of participants’ interaccombina-tions [38]. Video-recall can increase the accuracy of the described expe-rience while also reminding the interviewee of details that would have otherwise been forgotten. However, watching the event unfold on video can stimulate new thoughts that were not evident during the original experience. The Elici-tation Interview technique differs from interview methods commonly applied in HCI and visualization by guiding the participant into a mental state where they come close to what they were actually thinking and feeling in-the-moment when they explored the visualization for the first time.
We do not wish to propose the Elicitation Interview tech-nique as a replacement of the existing methods described above. In many cases, depending on the research context, different techniques or a mixed-method approach is appro-priate [7], [20]. However, if the objective is to gather rich accounts of experience that correspond to the actual“lived experience”; about the process of data analysis and discovery, the Elicitation Interview can be a useful tool that allows us to gain access to the people’s subjective experiences beyond their attitudes, judgements, and observations. In the following sections, we introduce the background and key characteristics of Elicitation Interview technique.
3
THE
ELICITATION
INTERVIEW
TABLE 1
Evaluation techniques to investigate insight and subjective experiences of information visualizations.
Study Method Strengths Limitations
Observations Provide insights into activities around exploration and anal-ysis processes.
Insights into people’s thought processes are not captured.
Diaries First-hand capture of people’s experiences with visualiza-tions and thought processes around exploration and analy-sis (see, for example [16]).
Richness of data depends on the participant’s commitment. Personal biases and post-rationalization may skew the data.
Questionnaires Enable the large-scale and consistent collection of people’s subjective experiences with an information visualization.
Limited level of detail—more in-depth and clarifying ques-tions are not possible.
Think-aloud Enables the first-hand collection of information about peo-ple’s thoughts and subjective experiences with a visualiza-tionwhilethey are exploring (see [49] for an example study in the InfoVis context)
The activity of commenting on thoughts and actions adds a cognitive task and therefore influences people’s exploration process and their experience of the visualization in general.
Interviews Can provide in-depth insights into peoples’ experience of a visualization and their strategies of data exploration.
Introduction of biases and post-rationalization can skew the data.
that may have impacted on their education. Since then the method has been used in a range of contexts, includ-ing pedagogy [24], management [39], medicine [33], and therapy [18]. Petitmengin has used the technique to study intuitive experiences [35] and to investigate the structure of the auditory experience [32]. In HCI the Elicitation Inter-view has been applied by Light and Wakeman to explore the experience of text entry into a web interface [22]. More recently, Obrist captured accounts of people’s verbalizations of a tactile experiences by conducting a series of Elicita-tion Interviews [30]. Although these examples are situated across a diverse range of disciplines, they all share a similar motivation: to elicit precise and detailed information about people’s lived experience, whether this experience involves tactile perception, pedagogical tasks, listening to sounds, a moment of intuition, or interaction with technology. We argue that the Elicitation Interview can be beneficial to explore people’s experience with visualizations.
3.1 Theoretical Background
The Elicitation Interview technique is grounded in phe-nomenology, more specifically, psychophenomenology. Phe-nomenology, a philosophical movement that started in the early 20th century [15], [42], is generally described as the study of experience and consciousness in the way it occurs and appears to us. Phenomenological research seeks to describe what something feels like rather than explain the phenomenon that is being investigated, and aims to go beyond experiences of which people are immediately aware. While traditional phenomenological approaches tend to utilize rigorous introspective techniques to gain first-person accounts, such as think-aloud or diary studies [29], psy-chophenomenology attempts to gain an understanding of the phenomenology of someone else’s experience through retrospective, interpretive interviews. In these interviews, the participant is verbally guided back toward re-enacting the experience under investigation in order for them to provide an account (a detailed description) not only about the conscious acts that they are aware of but also those actions or cognitive processes that they may not have been aware of during the episode. For instance, when driving a car we focus on the road ahead but may not be aware of our body position, which may be tense and uncomfortable. Known as pre-reflective consciousness, this part of expe-rience is concealed by the absorption of attention in the
objective or content of the experience, and, as a result, is not spontaneously described by people when being interviewed about their experience of an activity or event. This human phenomenon is particularly evident when we engage in activities such as reading, writing, observing, listening, or analyzing data, as these are accompanied by cognitive pro-cesses that are often outside of our awareness [31]. Methods in psychophenomenology can help to bring these processes to our attention. From a visualization perspective, they can therefore help to shed light into sense-making processes, emotional, and sensory reactions that occur when we (vi-sually or interactively) explore and interpret a visualization.
3.2 Key Characteristics & Interview Phases
Through our review of existing literature on the Elicita-tion Interview technique [22], [23], [24], [30], [32], [35] and through our own practical experience we have identified a number of characteristics that need to be considered when applying this technique in a visualization context.
A fundamental element to consider before applying the Elicitation Interview technique is the type of experience to be investigated: this should be a singular lived experience. For instance, the technique can be used investigate people’s experience of a visualization situated precisely in space and time. However, it is less useful to explore people’s experi-ence of visualization in general as they tend to move away from describing a lived experience towards the expression of comments, justifications, explanations, and beliefs.
Once the researcher has chosen a singular experience, the mode of questioning used throughout the Interview is non-inductive and directive. Non-inductive, because the researcher/interviewer does not suggest any content, but asks “content-empty” questions such as: “when you do this, what do you do exactly?”. This type of questioning enables the researcher to obtain precise descriptions without imposing their own presuppositions [34]. However, the Elicitation Interview technique is directive, that is, throughout the in-terview the researcher firmly maintains the participant’s at-tention on a singular experience, and guides the exploration of these characteristics down to the depth required [31].
linear flow of questions. Last but not least, the interview style of an Elicitation Interview aims at minimizing judg-ments or retrospective rationalization on the part of the participant. For example, asking questions starting with “why” encourages judgmental conditions and can change the mood of the interview. If a reason for an answer is needed, then questions for the “how” and “what” can help to clarify statements while not interrupting the re-collection process or implying that a judgement is required from the participant. This is illustrated in the following extract when the participant is being guided to speak about the moment when they finished reading a visualization. Note that they are not being asked whythey finished but ratherhowthey knew that they were finished:
Interviewer: “How do you know when you have ended?
How do you know that you have completed?”
Participant:“Before I closed it down [...] I felt that if somebody was to ask me about the graph that the graph told a bit of a story, and it is a story that I would try to retell.”, [JS, see Fig. 3].
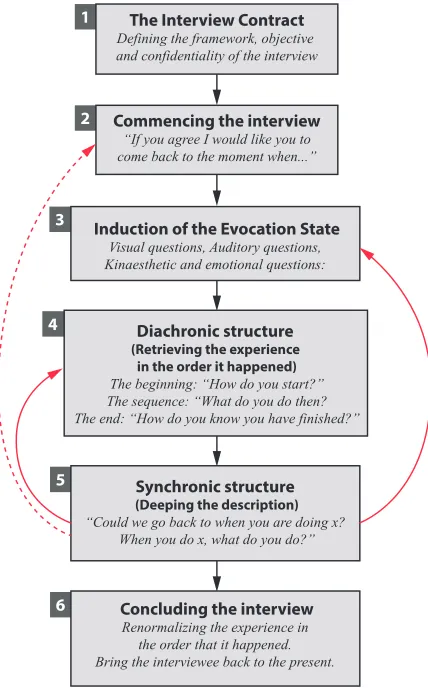
An Elicitation Interview typically follows a number of (iterative) phases (see Fig. 1), as described in the follow-ing. However, different study contexts differ in the study setup. In a visualization context, the interview may focus on a participant’s past experience with a visualization, or researchers could request the participant to engage with a visualization prior to the interview. The events in focus may occur immediately before the interview or much further back. In the Elicitation study we present here, we follow the traditional procedure as outlined in Fig. 1. A guide to conducting an Elicitation Interview is included as additional material to this paper2.
3.2.1 Agreement about Nature of Interview
As with all studies, it is important to gather the participant’s informed consent prior to the study. For an Elicitation Inter-view, this agreement (see Fig. 1 Phase 1) differs from typical consent forms, in that it makes the participant aware of the iterative nature of the interview which involves repeated and in-depth dwelling on certain experiences. To address this, the in-depth and iterative nature of the interview should be explained to the participant, and they should be made aware that they may withdraw from the interview at any stage if they start to feel uncomfortable with the questions. It is good practice to re-iterate this agreement at certain points during the interview by requesting permis-sion from the participant to probe a certain issue: “If it is ok with you, I would like to return to the point when you first became aware of X. Could you tell me how you felt at this time.”
3.2.2 Induction of the Evocation State
The goal of an Elicitation Interview is to collect a detailed account that describes the unfolding of an experience, while allowing the researcher to elicit further details about mo-ments during this experience. To do this, the researcher guides the participant toward a state of introspection which facilitates the (mental) re-enactment of the episode under investigation (e.g., a situation where the participant encoun-tered a visualization) (see Fig. 1, Phase 3). This state is typically achieved by asking the participant to see, hear,
2. http://tactiledata.net/elicitation/ (link to webpage that contains a web-based version of the guide and sample interview transcriptions)’
6 4
3 2
5
The Interview Contract
Defining the framework, objective and confidentiality of the interview
Commencing the interview
“If you agree I would like you to come back to the moment when...”
Induction of the Evocation State
Visual questions, Auditory questions, Kinaesthetic and emotional questions:
Diachronic structure (Retrieving the experience
in the order it happened)
The beginning: “How do you start?” The sequence: “What do you do then? The end: “How do you know you have finished?”
Synchronic structure (Deeping the description)
“Could we go back to when you are doing x? When you do x, what do you do?”
Concluding the interview
Renormalizing the experience in the order that it happened. Bring the interviewee back to the present.
[image:4.612.329.543.52.396.2]1
Fig. 1. The phases of the Elicitation Interview typically follow in order but may require iterations between phase 3, 4, and 5. There may also be occasions when the interviewer needs to reaffirm the original contract of agreement with the interviewee.
and feel whatever was happening at the time of the original event or activity. The participant is encouraged to retrieve the episode as if it was happening now. The following example illustrates the process of guiding the participant back to the event by stimulating various sensory channels:
Interviewer: “Can we go back to that moment when you read the data visualization..., so when was this?”
Participant:“Ah... quarter past 7 this morning.”
Interviewer:“Ok and where are you?”
Participant:“At work.”
Interviewer:“At work ok, so are you at a desk?”
Participant:“I was at my desk, yeah.”
Interviewer:“Ok, and when you are at your desk, are you sitting or standing?”
Participant:“Sitting...”
Interviewer:“Are you sitting upright?”
Participant:“Yeah...”
Interviewer: “So are you very straight, is your back very straight or...?”
Participant:“It could be that I am leaning forward on the desk or I am sitting up right. [bends forward and back in the chair]”
Interviewer:“And are your hands on the table or are they on your body?”
Interviewer:“So you are leaning on your hands?”
Participant: “Yeah, underneath my chin. [mimics the pose she was in]”
Interviewer: “Ok, and you have the computer screen in front of you... Is there anything else on the desk besides the computer screen?”
Participant:“[long pause] Yeah, I have my keyboard, I have my drink bottle, I have my coffee.”
Interviewer:“Where is your coffee, on the left, or...?”
Participant:“On the left...”
Interviewer:“And is it strong coffee?”
Participant:“Yes, strong and freshly made.”
Interviewer:“Can you smell it, now?”
Participant:“Yes very much so...”
The purpose of using such evocative language is to guide the participant into a state of mind, coined by Vermersch as evocation [47]. The state of evocation is recognizable by common cues familiar to most of us: when someone is re-counting a past event to others, their gaze may drift off into empty space and glaze over. Alongside these non-verbal clues, there are para-verbal clues that indicate whether a person is in a state of evocation or not, for example, a slowing of word flow and long pauses in the speech. There are also certain verbal cues that can serve as indicators; paramount is the transition from past to present tense. This is illustrated in the excerpt above, when the participant is asked about the contents of her desk. After a long pause she replies in the present tense: “I have my keyboard, I have my drink bottle, I have my coffee.”.
Individual non-verbal, para-verbal, or verbal cues may not confirm that a state of evocation has been reached. The researcher therefore has to be attentive to the participant demonstrating a combination of these cues. To help the participant to reach a state of evocation, it is advised that the participant sits in front of the researcher but slightly to the left or right. This enables them to stare into empty space without being obscured by the researcher.
To maintain a state of evocation in the participant throughout the interview, it helps to conduct the interview in the present tense. For instance, instead of asking the participant to recount their memory of the event, which may result in them replying in past tense: “I did this...I did that...”, the participant is invited to re-experience a situation as if they were there, for in-stance, by starting the interview with: “You are in front of your computer, please tell me what you are seeing now.” This encourages the participant to be in-the-moment and to recall the experience as it was lived by them in that particular moment. In a state of evocation a participant can mentally re-enact the past experience to the point where this experience becomes highly prominent and present for them, and the experience of being interviewed fades into background [48]. The ability of the researcher to attain and maintain a state of evocation in the partic-ipant is crucial to the success of the interview. When the researcher recognizes that the participant is emerging from the evocation state, the description of the experience can be reformulated, along with certain sensory details, in order to refresh the evocation of the past situation.
dynamic/diachronic experience: temporal structure
synchronic experienc
e: level of detail
different phases of experience beginning of experience
completion of experience Iterations
A
[image:5.612.327.543.53.200.2]B
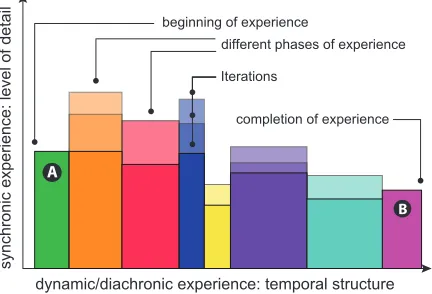
Fig. 2. Coloured blocks represent instances of a particular experience as they evolve over time (horizontal axis, diachronic dimension). These instances are re-visited during the Elicitation Interview to reveal their nature in more detail (synchronic dimension). The height of each block indicates how often a experience instance was re-visited.
3.2.3 Iterative Recall of the Experience
At the beginning of an Elicitation Interview, the participant is asked to think about a specific situation, in our case, a data visualization that they have encountered. It is this ex-perience that forms the basis of the interview. Typically, the participant is then guided to reveal thediachronicdimension of the experience, that is, how the experience unfolded over time (see Fig. 1, Phase 4). For example, a participant may be asked questions such as: “What is the first thing you do when you start reading the visualization?”, “What happens next?”. The horizontal axis shown in Figure 2 illustrate this diachronic experience dimension where each block represents an indi-vidual episode of this experience. Note that such episodes differ in length and may also overlap with each other.
After the first description of the experience which fo-cuses on its diachronic (temporal) dimension, the partici-pant is guided to reveal thesynchronicstructure (see Fig. 1, Phase 5), that is, the detailed characteristics and key as-pects of the experience, which are made up of specific moments or episodes (as represented by the colored blocks in Fig. 2). In this phase, the iterative nature of the interview comes into play: the participant is encouraged to repeatedly describe selected episodes of their experience at different levels of detail. In each iteration the granularity of these descriptions is refined. This phase involves questions such as: “You already mentioned that you have done X. How do you feel when you do X?”. This iterative process of asking the participant to go back to specific moments and to reveal increasingly finer details about the experience is one of the unique characteristics of the Elicitation Interview technique, and it is what facilitates the capturing of rich accounts of experience that can then be analyzed further.
3.3 Data Collection & Analysis
3.3.1 Reduction to Records of Pure Experience
No matter which method is chosen for the analysis of data gathered from Elicitation Interviews, the analysis should always begin with reducing the transcripts down torecords of pure experience. This is done by removing all retrospective comments and explanations by the participant. This process is illustrated in the following two extracts. Note that in both examples the participant has momentarily emerged from a state of evocation while making this judgment as they begin to directly look at the researcher. The underlined text in bold will be removed from the final transcript as the participant is clearly applying judgment.
Interviewer: “You mentioned already about a particular time when you had that light-bulb or ‘ah ha’ moment?”
Participant:“Yeah.”
Interviewer: “And is there a sound associated with it, can you hear someone saying ‘ah ha’?”
Participant:“Yeah, in my head, [starting into space]. I have some sort of... it’s not that loud...but it would happen in my head. It would say ‘ah ha’ or ‘there it is’... [stares directly at researcher]
I think this is the same sound I hear every time I get something right or like that...[gazes into space again] I feel some sort of confirmation in my head when I realize that that is where the trend is...”.
Evidence of applied judgement is also evident in the following extract.
Participant:“I looked at it, and the time that I spent at it. [long pause] I begin to feel more about the figures once you have had a chance to absorb what the figures are actually about. [turns to look at the interviewer]So let’s say that there are a hundred thousand people emigrated, and then you begin to think ‘My god there was one hundred thousand people left the country in that year!’. [long pause; stares into empty space] So once I begin to understand what the graph was trying to say, then the second phase of it is, when I begin to have feelings about what the actual figures say.” [EC, Fig. 3B].
Once the transcripts have been reduced to pure experi-ence they are sorted into the order in which the experiexperi-ence originally happened to help identify how the experience unfolded over time (diachronic structure).
3.3.2 Analysis Methods
Suitable analysis methods of data collected through an Elic-itation Interview depends on the focus of the research ques-tion. Qualitative analysis methods such as Content Analy-sis [19], Interpretative Phenomenological AnalyAnaly-sis [41], and Grounded Theory [9] lend themselves well to the exami-nation of such data. Discourse Analysis [36] has been used widely to analyze Elicitation Interview data [22], [23], [30]. However, it is primarily concerned with scrutinizing the verbal dialogue and does not address the non-verbal or para-verbal cues which are important aspects of a partici-pant’s responses to certain questions.
Based on our experience we recommend following a Thematic Analysis approach, a grounded approach that is primarily concerned with presenting an accurate portrayal of how people feel, think, and behave within a particular context [5], [10]. It is based on a set of procedures designed to identify, examine, and report patterns (themes) that emerge from the data. This analysis method complements
the non-inductive approach of the Elicitation Interview tech-nique. Thematic Analysis has a similar aim to psychophe-nomenology, in that it seeks to describe and understand the meanings that people give to their lived experiences and can help to identify patterns across qualitative data.
In the following section we describe the study we con-ducted to exemplify how the Elicitation Interview technique can be applied in the context of information visualization and what types of insights it can help reveal.
4
THE
STUDY
We conducted a study to explore how the Elicitation Inter-view technique can be used to gather accounts of people’s experience with static data visualizations. We sought to mainly investigate (1) how people interpret a visualization, and what thought processes are in place from the time they begin to (visually) explore it until they feel that they are finished, and (2) if there any similarities in the way that people describe their experience with exploring these data visualizations. We were primarily interested in the types of insight the technique can provide about people’s interpre-tation of visualizations, how these experiences unfold over time (diachronic structure), and how key moments manifest themselves as part of the exploration (synchronic structure). To answer these questions we asked participants to interpret a given visualization and interviewed them about their experience using the Elicitation Interview technique. Participants chose a visualization from a collection of 18 that we made available one week before the interview was conducted (see three examples in Fig. 3 and the additional material for a full list). All the visualizations were collected from rebuttable sources (e.g., governmental bodies) and contained topics that are relevant to a broad cross section of society. Examples include a line graph chart showing un-employment rates across the EU (see Fig. 3.A), the numbers and age distribution of emigrants coming to Ireland from 1987–2012 (see Fig. 3.B), or the economic status of women in Ireland in 2011 (see Fig. 3.C).
As this is a first study to explore and exemplify how the Elicitation Interview can be applied in a visualization context, we chose to focus on static data representations— including interactivity adds a further layer of complexity that may obscure the discovery about interpretation. We do however, acknowledge the importance of interactivity in visualization, and we are in the process of planning future studies that will use the Elicitation Interview technique to capture people’s experience of more complex visualizations.
4.1 Participants
Ten participants (four females) between 22 and 62 years (mean 36.7, SD 12.5) took part in the study. Participants had diverse professional backgrounds, including a business analyst, a solicitor, a retired accountant, a designer, a teacher, a web developer, an HCI researcher, a media producer, and two post graduate media students.
4.2 Procedure & Data Collection
Fig. 3. (A) Ireland and the EU: Unemployment rates, 2002–2012 (Central Statistics of Ireland (CSO) Ireland and Eurostat), (B) Ireland: Emigration 1987–2012 (CSO Ireland), (C) Principal economic status of Irish women, 2011 (CSO Ireland).
it as they could. The interviews were conducted in a quiet location that was agreed upon between the researcher and the participant in the days leading up to the interview, such as, in the office space normally occupied by the participant. All interviews were conducted by the same researcher.
Following the procedure described in Section 3.2, each interview commenced with an explanation of the purpose of the research and outlining the terms of the interview. The interview started by asking the participant a series of questions that were aimed at guiding them back to the place and time when they first read the visualization. This included questions such as: “When did you first read the visualization? Where were you at the time?”. The line of questioning then progressed to more sensory questions that encouraged participants to describe in detail their immedi-ate environment when they originally read the visualization. This included questions such as: “Are there any sounds in the room?” or “Please describe what else you see on your desk?”. As mentioned earlier, the purpose of these types of questions is to guide the participant toward a state of evocation.
The interview then continued with questions encourag-ing the participant to recall how the experience with the visualization unfolded (see Section 3.2.3). During this pe-riod the researcher noted particularly interesting experience episodes, such as moments when new insight was discov-ered. Once the participant had recounted the experience in the order in which it originally occurred, the interviewer returned to these moments of interest and and asked the participant re-enact them in more detail, focusing on their thoughts and feelings at the time.
The interviews lasted just under 30 minutes on average. Interviews were video- and audio-recorded resulting in a total of just under five hours of material for transcrip-tion. To allow for further immersion in the data, the same researcher who conducted the interviews also transcribed them. Interview transcriptions also included gestures by the participant so that the non-verbal and para-verbal cues could be analyzed alongside the verbal dialogue (see a full transcript of one interview in the additional material).
4.3 Data Analysis
The transcribed interview recordings formed the basis for our data analysis that, as described earlier, followed the ap-proach of Thematic Analysis [5], [10]. Our apap-proach follows six phases: (1) reduction, (2) familiarization, (3) thematic coding, (4) extracting themes, (5) reviewing themes, and (6) defining and naming themes.
Reduction. First, we reduced the transcripts down to accounts of pure experience. As stated earlier (see Sec-tion 3.3.1), at times during the interview the participant may emerge from a state of evocation, applying some judgment or rhetoric that was not part of the original experience. During the reduction phase we removed all participant statements that indicated some sort of rationalization. This left us with accounts that described what the participant was seeing, hearing, feeling, and thinking at the time when they read the data visualization. Included as additional material is a sample transcript from the study, which has been reduced to an account of pure experience.
Familiarization.After the reduction phase, we read the transcripts repeatedly to familiarize ourselves with the data even more. As with many qualitative study approaches, this is an essential phase of the data analysis as it allows the researcher to gain an overview of the data, which later enables the identification of thematic codes (see, e.g., [2]).
Thematic Coding.We then derived an initial set of the-matic codes from the data. Thethe-matic codes can be defined as parts of the data relevant to the research questions and that capture the qualitative richness of the phenomenon [5]. This process involves line-by-line open-coding, which, in our case, was carried out by the same researcher who con-ducted the interviews. After careful coding of all transcripts, 82 preliminary codes were assigned to 232 extracts. Another researcher then validated these codes, and minor adjust-ments were applied before the list of codes was finalized.
[image:7.612.67.546.45.157.2]illustrate the types of insights that this technique enables.
5
CAPTURING
EXPERIENCES WITH
INFOVIS
The themes that emerged from our analysis (see Table 2) provide examples of the types of insights enabled by the Elicitation Interview technique. These include a deep inter-pretation of individual visual components of the representa-tions (Theme A), participants making connecrepresenta-tions between the data represented in the visualization and events of their personal lives (Theme B), participants experiencing their explorations as a dialogue with the visualization and/or its creators (Theme C), and participants’ higher level con-templations about the meaning of the visualizations and the represented data (Theme D). Since a full description of all ten themes would exceed the space limits of this paper, we highlight four that exemplify different types of experiences as captured using the Elicitation Interview technique.
5.1 Deep Interpretation of Visuals
The Elicitation Interviews led to numerous instances where participants commented on their interpretation of visual elements (e.g., shape or color) in the representations (Theme A, see Table 2). All participants, at various stages of the interviews, mentioned the importance of color to form meaning from the visualizations. In many cases it was the first visual variable that they studied to make sense of the visualization. This is illustrated in the following extract where the participant is recounting the first thing he did when reading the visualization: “I look at the colors first, they are the first thing that catches my eye... so after I look at the colors, I look at the color code, what’s that called again? The key, that explains what the colors mean. And after that I looked at the plain text to figure out what it was all about from then on .”, [JC, Appendix A1]. This process was echoed by other participants. Interestingly one participant’s statement suggests that interpreting the colors is a separate process from reading the visualization: “The first thing I do is check the colors and lines before I start to read what it is all about, just to get at the information quickly. There are some blue lines here and green ones here... [short pause, pointing out in space] and then I start to read it.”, [VM, Appendix A5].
Participants also focused on elements such as position and texture to help them make sense of the visualization. For example, one participant studied the line path to in-terpret trends in the data: “I look for, what would you call it, maybe anomalies or inconsistencies in the line movement, that stood out because they are not following a symmetric pattern.”, [JC, Appendix A3]. Another participant found the use of some visual elements impeded her from understanding the underlying information: “The first thing I notice while looking at the data visualization is the confusing... the kind of patterns of the data visualization... So even before I even read the data itself I find the way that the patterns fitted together in the circle, in the pie chart... it looks a bit dizzy.”, [JS, Fig. 3C].
These statements illustrate that the interpretation of vi-sual variables was often the first cognitive task that partic-ipants engaged in when starting to read the visualizations. This raised curiosity and led to initial insights, but was often also already connected to an emotional experience (indicated by expressions such as “confusing” and the feel-ing of “dizzyness”, as highlighted in the statement above).
Interviews are typically utilized to explore the utility of the visualization and the effectiveness of particular visual variables—statements similar to the above are therefore not unusual if we ask people how they understand and interpret a visualization. However, as we illustrate in the following paragraphs, the focus of the Elicitation Interview technique on “in-the-moment” experiences and its iterative character can also trigger rich perspectives on people’s experiences with simple data representations that go beyond what we can gather from traditional interview strategies.
5.2 Revealing a Process of Personal Contextualization
Six out of our ten participants revealed that they connected the data represented in the visualization to personal sit-uations in their lives (Theme B, Active Seeking for Per-sonal Connections). This theme was derived from explicit references of participants to personal circumstances in re-lation to the represented data. It is important to highlight that we did not prompt participants to comment on these personal perspectives, but these were revealed when we asked participants to go back to the situation in which they read the visualization, and what they thought and felt like at the time. For instance, participants used their personal circumstances or those of their family or friends to contextualize aspects of the visualization. This is illustrated in the following statement: “Between 2007 and 2008 it jumped, and that would have been when I started college and then my father was out of work.”, [MMC, Fig. 3A].
Personal references were also used to help make sense of the visualization and to verify that the presented topics were understood correctly: “I start looking to make sure I understand the chart to think about my own situation and people I know in my surroundings.”, [JS, Fig. 3C]. Contemplating how the visualization applied to her own circumstances, prompted another participant to critically question the suitability of data categories presented in the visualization: “When I am looking through it, it is putting women into different classifica-tions, and I was like: ‘Oh, where would I fall?’, and I see that I fall basically into several of them so I was saying: ‘Do I actually fall into none of them?’”, [DH, Fig. 3C].
TABLE 2
List of themes (in bold) and codes that emerged during the analysis of the transcripts. The numbers in the themes column refer to the number of participants who the codes were applied to.
Themes{codes} Descriptions Illustrative Quotes
(A) Interpretation Processes of Visuals Experiencing colour (9), Experiencing pat-tern (2), Shapes and lines (2)
[image:9.612.48.563.91.468.2]Sense that the visual variables, including colour, shape, position and pattern has impacted on the interpretation and understanding of the visualization.
– “It [the visualization] is using a different part of my brain, if I was using an excel sheet, I’d find it more boring and more serious, whereas with colours it’s easier to see and to read out a pattern quickly .” [JC, Appendix A3]
(B) Active Seeking for Personal Connec-tions
Personalizing (6)
Forming a personal connection to the data source based on personal experiences, at-tempting to contextualize the data by placing themselves into the representation. In a way this has to do with making the visualization relevant for oneself.
– “To make sure I understand the chart to think about my own situation and people I know in my surroundings.”[JS, Fig. 3C]
– “When I am seeing ‘2005’, I am thinking where I was in 2005.” [JC, Appendix A3]
(C) Presence of a Dialogue with the Data/Vis Creators
Data communication (6), Use of “they” (5)
A social encounter with the data visualization? A pres-ence of the quasi “other” referring to “it” and “they”. This includes a sense of dialogue between the data and/or the creators of the visualization.
– “It just took a couple of minutes of trying to absorb what the thing was saying and what the implications are for that personally.” [EC, Fig. 3B]
– “I think, I knew what they were trying to tell me. The other stuff, I had to filter out.” [VF, Appendix A4]
(D) Finding Meaning
Beyond the data (3), Empathy (2), More than numbers (2)
Looking or searching for the meaning of what is being presented in the visualization. Connecting to the data on an emotional level and empathizing with the data.
– “When I am looking at the information, the information means something more than just a graph.” [EC, Fig. 3B] – “I was looking toward, or maybe, beyond at what they were trying to communicate with the graph.” [MMC, Fig. 3A]
(E) Fulfilment
Fulfilment (8) Completion (2), Achievement (2)
A feeling of completion and fulfilment which may also involve as sense of achievement.
– “Well, I have a feeling of completion, like that I have finished it that there is nothing else that I can get out of this.” [JC, Appendix A1]
– “It was at this time that I felt satisfied and I had achieved something.” [EC, Fig. 3B]
(F) Absorbing the Data Absorption (2)
Sense of absorbing as much information from the visu-alization as is possible.
– “It also felt like I was hungry before, but now I have eaten something and I feel full and I don’t have any more appetite to eat anymore of this, I felt that, yeah it’s enough.” [VM, Appendix A5]
(G) Sense of Understanding
Understanding (5) Making sense (meaning) (5)
The moment when meaning has been formed, confirm-ing that they understand the information communi-cated through the visualization.
– “I felt that I had understood the figures, there was no need for me to look back at the figures again.” [MMC, Fig. 3A] - – “It made sense on a number of levels.” [BD, Fig. 3B]
(H) Asking “Why”
Questioning (3) Internal reasoning (3)
Asking questions and seeking answers. The processes involved in reasoning and rationalizing about the data.
– “I tried to come up with a reason why could it be so low [R: eh em] and that?s what I mean I reason in my own head.” [JS, Fig. 3C]
(I) Personal Data Affect
Feelings (1), Affect (3), Positive feeling (1), Lack of trust (1)
The personal affect of the visualization, how does it make them feel. A sense that the representation has engendered positive or negative feelings and whether they trust what is being represented.
– “I felt that I had understood it on an intellectual level and on a level that is more deeper where there are people you know that have been affected by what you are reading.” [MMC, Fig. 3 A]
(J) Using Previous Knowledge
Contradicting expectations (5), Surprise (3), Confirming (1)
Meeting or contradicting expectations informed by pre-vious knowledge of the topic, which may lead to a sense of surprise.
– “that one kind of surprised me that it was a smaller percentage of housewives than I thought.” [DH, Fig. 3C]
personal relevance and clearly influenced his experience of the visualization. Along these lines, one participant summa-rized: “It is the things that are important to you that lets you connect with the graph. You know, 2008 was a big year for me, but whoever created the graph, 2008 may not have been so special. These things I see but no one else sees; they let you contextualize that graph so they are ‘my graph’ within their [the designer’s] graph.”, [MMC, Fig. 3A].
5.3 Presence of a Dialogue with the Data
Re-iterating on participants’ process of reading and inter-preting the visualizations and on their experiences and emotional reactions as part of this process also revealed that participants sometimes felt like engaging in a form of dialogue with the data and/or with the creator(s) of the visualization (Theme C), as the following extract illustrates: “It just took a couple of minutes of trying to absorb what the thing was saying and what the implications are for that personally.”, [EC, Fig. 3B]. The expression “what the thing was saying” implies a form of communication, and teh statement also illustrates attempts to extract personal meaning from the visualization (Theme C).
We found some variations of this “Dialogue with Data” theme. For instance, when talking about his experience with
a bar graph that represents the number of young people in Ireland with a third-level education (see Appendix A1), one participant described engaging in a form of communication with the data representation, but this time the visualization seemed to be doing more than justsaying; to him it appeared to try to explain something: “I noticed that there was some kind of trend which was increasing over time, so I took that as being the information that it was trying to explain to me.”, [CB, Appendix A1]. Statements by another participant implied a more complex relationship to the data visualization, as he described a sense of mistrust in the data triggered by noticing irregularities in the trend noticed in the graph: “I tried to look at it very critically then—is it telling me the truth or is it not telling me the truth.”, [MMC, Fig. 3A]. Interestingly, this participant never expressed his criticism toward the graph creators, but solely to the visualization itself, personifying it to a certain extent.
thought was intended by the graph designers.
5.4 Finding Meaning Beyond the Data
We found that the personal connections that participants often sought for in the data representations (Theme B) some-times resulted in rich interpretations that went beyond what was actually being presented (Theme D). Participants, for example, mused about the implications of the represented data: “I thought of what is happening behind the graph, you know, how many people does this affect? Like, when Ireland is at 12%... Who are those 12%? To me this is just a figure, but to them this is their livelihood. That it is not just a graph; there is a lot more going on behind it.”, [MMC, Fig. 3A].
This emotive response is echoed by another participant when he was talking about his experience while reading the graph shown in Figure 3B: “When I saw the trend, and I understood what it is saying... Suddenly, then, there is a phase when I am looking at the information and the information means something more than just a graph.”, [EC, Fig. 3B]. He explained further what he took from the graph, and how he would communicate his insights: “I am surprised at the fact that there were people actually emigrating from the country in much greater numbers than I thought, so that is what I am left with now, rather than the memory of the figures [numbers]... I felt that if somebody was to ask me about the graph, that the graph told a bit of a story and it is a story that I would try to retell.”, [EC, Fig. 3B].
For some participants, this revelation of meaning beyond the data manifested itself in vivid pictures. One participant described literally seeingold people and families boarding aeroplanes in front of his inner eye while he was reading a bar graph representing the emigration rates from Ireland (see Fig. 3B); another participant described seeing a clear moving image of a woman working in the kitchen that manifested in her head while she was reading a pie chart representing the economic status of Irish women in 2011 (see Fig. 3C). These examples illustrate that even plain graphs and charts, intended or not, communicate rich stories that are triggered and influenced by the personal background, experiences, and attitudes that the person interpreting the visualization brings into the analysis process.
The themes and statements described above illustrate the variety and depth of some personal experiences and interpretation processes of the provided data representa-tions that we were able to gather through relatively brief (30 min.) Elicitation Interviews. Again, we did not prompt participants to interpret their reading activity of the data visualizations in this personal way, but these aspects nat-urally came up when participants were prompted to “re-live” the situation in which they read the visualizations for the first time. Along these lines, this vignette of findings shows how an Elicitation Interview can bring to the fore personal experiences as they evolve during the reading and interpretation of a data visualization. While such findings may not directly point toward implications for design, they shed light into how insights develop when reading a visu-alization. In the following section we critically discuss the Elicitation Interview as a technique for studying personal experiences in the context of visualization.
6
DISCUSSION
Some of the aspects that we have outlined in our findings parallel current themes in the visualization community. For
instance, utilizing visualizations to tell stories is an active topic [40], and the notion of engaging in a “dialogue with data” has been discussed in the context of interactive vi-sualizations [51]. The Elicitation Interview technique can facilitate studying these aspects from an experience point of view by providing a rigorous method of collecting rich examples of how insight is formed from reading (and po-tentially interacting with) a visualization. In this section we discuss the types of findings the Elicitation Interview technique can support in relation to different visualization contexts. We provide practical considerations of how to apply the technique for visualization evaluation, and end a discussion of future research questions that this approach raises, for example, how it compares to and can be combined with other qualitative evaluation techniques.
6.1 Insights about Design and Representation Aspects
Although the Elicitation Interview technique has been suc-cessfully applied to gather specific design recommendations for interface design [23], its strength lies facilitating the col-lection of data on how people think and feel while reading data visualizations. In this way it can help investigate how insight is generated and discoveries occur during this pro-cess. A better understanding of how people experience and interpret visualizations on a personal level can inform the design process at least indirectly. Our findings, for instance, revealed that color is an important visual variable that participants usually tried to actively decipher first. Remarks about visual variables and marks were common (Theme A). Furthermore, the fact that some participants tried to take in the visualization as a whole first, before starting to decipher its meaning and focus on individual components shows that the overall impression of a visualization already influences people’s subsequent interpretation and sensemaking.
6.2 Revealing Experiences & Interpretation Processes
how interpretative processes influence people’s experience and meaning-making of information visualizations.
6.3 The Elicitation Interview in Visualization Evaluation
The study described in this paper serves as an example of how the Elicitation Interview technique can be applied in the context of information visualization. It provides a glimpse of the type of findings that can be derived from Elic-itation Interviews. We argue that this type of interview will be beneficial to help understand data analysis processes and to evaluate visualizations, the two main areas of information visualization evaluation [20]. In the following we present various scenarios where the Elicitation Interview can be applied within the visualization context. We then discuss the potential of the Elicitation Interview technique based on the evaluation scenarios that Lam et al. have identified as part of their literature survey on visualization evaluation [20].
6.3.1 Evaluating the Experience of Visualizations
As Lam et al. point out, there is a lack of research that stud-ies people’s subjective experiences of and opinions about visualizations [20]. These types of studies are important in a range of professional or casual visualization contexts, for example education, in the home, or in the health sector, just to name a few. Yet, such evaluations are not easy to conduct. As we have demonstrated, the Elicitation Interview technique is one way to conduct these types of studies. It can help to evaluate how people experience visualization systems, beyond usability issues, taking into account hedo-nistic, emotional, and sensory reactions. Findings derived from Elicitation Interviews can help to inform interaction and visual design, but, more importantly, foster our under-standing of internal thought processes as part of (casual or professional) data analysis and exploration.
6.3.2 Understanding Environments and Work Practices
Studies that provide an understanding of people’s work practices as well as activities in non-work related scenarios are important in order to estimate the (potential) role of vi-sualizations in these contexts. They can help the derivation of design considerations and requirements for information visualization. However, it can be difficult for people to formulate and describe processes that they engage in on an everyday basis. Certain activities, for instance, those that are performed frequently, may seem trivial and remain un-reported. The Elicitation Interview, with its focus on guiding participants into a mental state where they re-enact certain experiences, can help to gather details not only about the types of activities people engage in, but also how these are conducted and how participants experience them. Insights generated in this way can guide the exploration of new application areas for visualizations.
6.3.3 Evaluating Visual Data Analysis and Reasoning
The Elicitation Interview technique can also be applied when studying how a visualization supports data anal-ysis processes and data reasoning. A lot of application areas of visualization are characterized by loosely defined research questions or problems and involve fluid open-ended data explorations where a variety of approaches may be applied [20]. For instance, research in the humanities but also in other domains is not based on clearly defined
hypotheses, but, instead, questions and stories evolve as domain experts explore document collections around cer-tain topic areas [12]. Because of the complexity of these processes and discoveries, qualitative evaluation methods are required that can capture the variety of approaches. Here, the Elicitation Interview technique can be beneficial, as it is designed to unearth even subtle and unexpected discoveries and related analysis processes and how these are influenced by the visualization at hand and people’s personal background and attitudes.
6.3.4 Evaluating Communication through Visualization
The impact of a visualization is evaluated based on its ability to communicate information. This communication process is deeply personal: as our small vignette of findings has shown, different people will interpret a visualization in different ways, based on their personal background, assumptions, and preferences. No matter how plain a vi-sualization is designed, it can trigger personal memories, associations, and rich emotions. The Elicitation Interview technique can bring these to the fore in form of genuine accounts of experiences. Furthering our research in this area is important, especially as visualizations are now frequently used in casual contexts such as libraries, museums, or at home, and we need to deepen our understanding of how everyday people may interpret visualizations, and how visualizations affect people’s experiences in-situ.
Recent surveys have found that in particular the last three evaluation scenarios are heavily underrepresented in current InfoVis and SciVis literature [17], [20]. One reason for this may be the lack of techniques that can provide genuine and rich insights into people’s experiences and analysis processes. The Elicitation Interview technique can be considered as a valuable addition to qualitative evalua-tion methods that can address these scenarios. We hope that the community will pick up on it and add to the discussion of how it can be applied in different areas of visualization (including InfoVis, SciVis and Visual Analytics) and in com-bination with other evaluation methods.
6.4 Practical Considerations
The Elicitation Interview technique provides visualization researchers with a valuable tool to capture experience and offers unique insights into cognitive processes involved. However, it should have become clear that special attention has to be paid to how the interview is conducted, and we have named a number of procedures that need to be applied (agreement with participant, interview in present tense, maintaining a state of evocation in the participant). As well as the interview protocol, there are other issues that need to be considered when conducting an Elicitation interview, namely the physical setting the
is therefore not more time or resource intensive than other qualitative research methods, in some ways, it may be even be easier to gain practice. Much like most other qualitative methods, the Elicitation Interview technique rewards such efforts by producing a vast amount of rich data, which, and this, again, is a downside of all qualitative research approaches, has to be processed as part of a time consuming and, at times, qualitative analysis process.
Context. While we imagine the Elicitation Interview technique to be valuable across the different areas of vi-sualization contexts, including InfoVis, SciVis and Visual Analytics, it has to be considered that the technique may not be applicable in all situations or visualization contexts. For instance, the Elicitation Interview requires time and is therefore not appropriate to gather feedback from people in an ad-hoc manner. Also, the selection of participants has to be carefully considered. Some people may feel un-comfortable with the style in which the Elicitation Inter-view is conducted, as it involves in-depth questions about emotional aspects of the experience. In extreme cases, such an interview can trigger unexpected or strong emotions in participants which may require the discontinuation of the interview. For instance, during our pre-study we en-countered a difficult situation where a participant became extremely distressed when recounting her experience of reading a visualization that evoked an emotional event in her life. This potential for strong emotional reactions has to be considered during the study design, in particular when recruiting participants. Also, participants have to be informed about this as a potential risk of their participation.
Choice of Study Scenario When illustrating the key characteristics of an Elicitation Interview we highlighted that focusing on a particular experience is a fundamental element to the successful application of the technique. How-ever, deciding upon what singular experience to investigate depends on the context and purpose of the study. The procedure we followed in our study involved creating an experience by providing the interviewees with a choice of visualizations to read before the interview took place. The reason we offered the participants this amount of time was mainly due to practical concerns, as we wanted to be assured that they would have enough time to read the visualizations. Other studies have shown that the technique can be also be applied successfully over a shorter period of time, sometimes immediately before the interview [30]. An Elicitation Interview can also be used to investigate an experience that was not seeded by the researcher. For example, the technique could facilitate the investigation of moments when a visualization had an impact on a person life in order to provide a better understanding of how visualization can effect people.
Physical Setting. The interview should take place in quiet location to allow the interviewee to concentrate on reenacting the original experience. Although it is not a perquisite, it helps the process of reenactment to conduct the interview in the same location as where the event or activity in focus took place.
Props. Using the Elicitation Interview in pedagogical and therapeutic contexts has shown that using props during the interview may help to reach and maintain a state of evo-cation. For instance, holding an object such as a childhood
toy during the interview may help a participant to reenact a childhood event. It is not clear, however, how this practice transfers to the visualization context. For example, provid-ing the participant with the actual item under investigation, in our case the data visualization itself, may introduce bias or rationalization on the part of the interviewee. Future studies are required to investigate this aspect further.
Individual vs. Group Interviews.To our knowledge the Elicitation Interview technique has only ever been used with individual participants; the in-depth and personal character of the interview technique does not seem to lend itself to group scenarios. However, in collaborative visualization scenarios it could be interesting to explore experiences of group members individually using the Elicitation Inter-view technique and compare these findings with aspects that come out of regular interviews or focus groups with all members together. This points to the potential of the Elicitation Interview technique to be combined with other interview styles and evaluation methods, which, in general, is an interesting area for future research.
Data Analysis and Presentation of Results.The analysis and presentation of findings gathered from an Elicitation Interview is similar to that of common qualitative methods such as interviews or video analysis. It is key to follow a rigorous qualitative approach (see analysis approaches discussed in Section 3.3), and the involvement of multiple coders in this process will help to verify themes that emerge from the data. When it comes to presenting the results of an Elicitation Interview, it is important to support and illustrate the argument with direct quotes from participants. Quantitative data in the form of, for example, the number of participants who discussed a particular topic, can help to en-hance results. If ethical concerns allow this, the transcribed interview data can be made publicly available to allow other researchers to better comprehend the presented results and conduct follow-up studies. However, while we can make the data collection and analysis process as transparent as possible, it will be difficult to fully reproduce an Elicitation Interview—as with all qualitative research methods the particular in-situ study context and the in-the-moment con-nection between participant and the interviewer may bring some insights to the fore that will not come up otherwise. This is in the nature of qualitative studies and can be consid-ered a limitation. However, it is such types of studies which enables rich and direct accounts of participants’ experiences which cannot be collected otherwise.
6.5 The Elicitation Interview in Comparison
Our example study is the first to apply the Elicitation Interview in the context of visualization evaluation and was mostly conducted to explore the potential of this technique. Future studies will have to investigate in more detail its strengths and limitations, in particular in comparison to other qualitative evaluation techniques, such as think-aloud protocols, regular post-session interviews, or video-guided interviews. To this point we can only speculate that the Elicitation Interview technique can be advantageous over think-aloud protocols as it does not interfere with ongoing thought processes during the activity in focus.

![Fig. 3C]– “When I am seeing ‘2005’, I am thinking where I was in2005.” [JC, Appendix A3]](https://thumb-us.123doks.com/thumbv2/123dok_us/8697890.380980/9.612.48.563.91.468/fig-c-i-seeing-i-thinking-jc-appendix.webp)
