Abstract— In medical applications, TP53 have proven to be extremely complex bio markers. Since TP53 germline mutations are the underlying cause of Li-Fraumeni syndrome (LFS), which is a rare autosomal dominant cancer predisposition syndrome therefore classifying TP53 based on family history becomes a growing concern in medical research. Even though TP53 has been the most extensively sequenced tumor gene, still P53 research has not gained much attention in finding the best classifier. Moreover early detection of P53 mutation occurrence will identify the cancer risk. This paper mainly focuses on finding the best classifier for TP53 mutants with reduced features. In this paper, relevant features from IARC TP53 germline dataset are filtered using three feature selection algorithms, and then various classification algorithms are applied on these reduced features. Finally, performance evaluation is done for all the above classifiers. The results revealed that Random forest tree (Rnd tree) classifier as the best classifier as it produces 100% accuracy.
Index Terms— Classifier, feature construction, feature selection, relevance analysis, TP53 mutants
I. INTRODUCTION
ATA mining and knowledge discovery in the databases
is a new interdisciplinary field, merging ideas from statistics, machine learning, databases and parallel computing. It involves scientists from a wide range of disciplines, including mathematicians, computer scientists and statisticians as well as those working in fields such as machine learning, artificial intelligence, information retrieval and pattern recognition. Data mining is the step of the knowledge discovery in databases (KDD) process concerned with the algorithmic means by which patterns or structures are enumerated from the data under acceptable computational efficiency limitations [2].
Before mining, the data has to be cleaned as it removes errors, ensures consistency and takes missing values into account. Data mining may use quite simple statistical techniques or it may use highly sophisticated data analysis.
S. Poonkuzhali is with the Department of Computer Science & Engineering,, Rajalakshmi Engineering College, Affiliated to Anna University, Chennai ,Tamil Nadu, India, phone: +91 9444836861; (e-mail: poonkuzhali.s@ rajalakshmi.edu.in).
R. Geetha Ramani , Professor and Head of the Department of Computer Science & Engineering, Rajalakshmi Engineering College, Affiliated to Anna University, Chennai, Tamil Nadu, India (e-mail: [email protected]).
R. Kishore Kumar is with the Department of Computer Science & Engineering, , Affiliated to Anna University, Chennai, Tamil Nadu, India (e-mail: [email protected]).
Feature extraction or feature relevance analysis plays a major role in mining very large datasets especially while classifying medical datasets
In this research work various classification algorithms are applied over reduced features on the IARC P53 germline dataset for classifying p53 mutants based on family history. Whenever there exists mutations in the P53 gene it causes the protein P53 to be inactivated, which in turn increases the risk of cancer. These germline mutations causes Li-Fraumeni syndrome which is an inherited cancer predisposition syndrome by a combination of tumors, including breast cancer, brain tumors etc. Most families fulfilling the classical diagnostic criteria harbor TP53 germline mutations [1]. However, TP53 germline mutations may also occur in less obvious phenotypes. As a result, different criteria are used to decide which features leads to TP53 mutation.
In the proposed work IARC TP53 germline datasets are taken from the International Agency for Research on cancer TP53 repository for classifying TP53 mutants using feature relevance analysis. First feature construction is done using discrete to continuous converter. Followed by that feature selection through Fisher, ReliefF and Runs filtering is done. Then classification algorithms such as Random forest tree (Rnd Tree), Naïve Bayes, ID3, K-NN, Multilayer perceptron, etc. are applied on the reduced dataset. Finally performance evaluation is done to evolve the best classifier.
Outline of the paper: Section 2 presents related works; section 3 presents analysis of TP53 mutants; section 4 presents experimental results and performance evaluation and section 5gives conclusion.
II. RELATEDWORKS
The spectrum of mutations and the methods for mutation detection, the tumors associated with inheritance of a germline mutation, and some of the ethical and clinical problems in patients with a germline TP53 mutation are discussed in the literature [14]. Paper [5] analyses somatic inactivating mutations of the p53 gene and its importance of the p53 pathway in tumor suppression which has been shown to be crucial for the prevention of tumor formation. In paper [3], relative frequency and morphology of cancers in carriers of germline TP53 mutations are analyzed using two-sided P-values. Here, Cancer types with P-values of less than 0.02 were regarded as showing a strong association with TP53 germline mutations. Paper [7] concludes that all p53-positive families having at least one
Efficient Classifier for TP53 Mutants using
Feature Relevance Analysis
S. Poonkuzhali, R. Geetha Ramani, R. Kishore Kumar
member of the family with sarcoma, brain tumor, breast cancer, or ACC younger than the age of 50, were strongly associated with LFS and p53 mutations, which concluded that families without at least one member with a core cancer are highly unlikely to have a p53 mutation. Also cancer types not typically associated with LFS like cancers of the ovary, pancreas, and prostate were observed in patients with germline p53 mutations and all p53 positive patients had at least one member of the family with sarcoma, brain tumor, breast cancer, or ACC. Cancer phenotype [4] in families carrying germline missense mutations in the core DNA binding domain was characterized by a higher cancer incidence especially of breast cancer and brain tumors, compared with families carrying protein truncating or other inactivating mutations . Paper [10], focuses primarily on the LFS-associated breast cancer and adrenocortical carcinoma, sarcoma, brain tumor, and acute leukemia and examines the occurrence of other types of cancer in p53 mutation carriers and their first-degree relatives with nearly 50% likelihood of being a carrier. A TP53 germline mutation, R337H leads to adrenocortical tumors and also breast tumor genesis, thus the TP53 R337H germline mutation predisposes to a larger spectrum of tumors, similar to the one reported for other TP53 mutation [1]. Paper [13] specified that due to TP53 mutation a number of other cancers like melanoma, germ cell tumors, Wilms' tumors, gastric and pancreatic carcinomas and lung cancer may occur at an increased rate
III. ANALYSIS OF TP53 MUTANTS
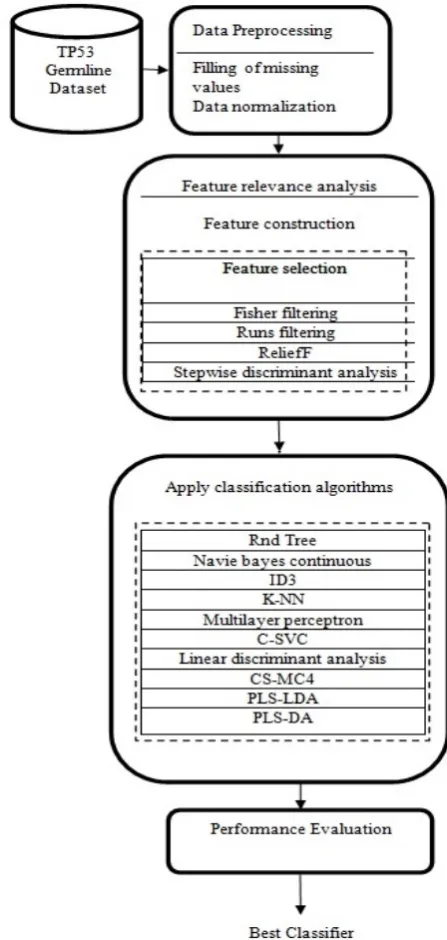
The architectural design of the proposed system is given in Fig 1 and each block is explained in the following sections.
A. Input Dataset
The TP53 Germline Dataset contains 34 attributes (33-input attributes,1-target attribute) and 2483 instances. The training dataset consists of 80% of the original dataset and the testing data consists of 20% of the original dataset. The dataset specifies information on families fulfilling the definition of Li-Fraumeni and Li-Fraumeni related syndromes and on individuals carrying aTP53 germline mutation. Criteria for inclusion are the following: a) individuals carrying a sequenced TP53 germline mutation, affected or not by a cancer, b) individuals affected by a cancer and belonging to a family defined as LFS or LFL, presenting or not a germline mutation. The description of the attributes of this TP53 germline dataset [15] is given in Table 1.
B. Data Preprocessing
Nowadays, most of the data in the real world are incomplete containing aggregate and missing values, noisy data containing errors, outliers and duplicated documents, inconsistent data containing discrepancies in codes and names. As the quality decision depends on quality mining which is based on quality data, pre-processing becomes a very important tasks in any mining related activity. Major tasks in data pre-processing are data cleaning, data
[image:2.595.316.540.104.575.2]integration, data transformation and data reduction. In this dataset data cleaning is done to fill up the missing values with its corresponding mean values.
Fig. 1 Architectural design of the proposed system Algorithm of the Proposed System
Step 1: Extract the input dataset (IARC TP53 germline dataset).
Step 2: Preprocess the extracted dataset.
Step 3: Apply feature selection algorithms to extract the relevant features.
Step 4: Apply various classifiers on this training dataset. Step 5: Select the best classifier based on the error rate. Step 6: Apply the regression technique for the best classifier to predict the class label on the test dataset.
TABLEI
FEATURE DESCRIPTION OF TP53 GERMLINE DATASET (REF-[15]) Feat
ure No.
Feature Name Description
1 Family_ID Unique family identification number.
2 Family_Code Name or number given in the original publication or an arbitrarily-assigned name, usually the 3 first letters of the first author's name and the publication date.
3 Country Country in which the patient was living at the time of surgery otherwise the country corresponding to the address of the hospital is entered.
4 Class Family classification: LFS = strict clinical definition of Li-Fraumeni syndrome.
LFL = Li-Fraumeni like for the extended clinical definition of Li-Fraumeni FH= family history of cancer which does not fulfil LFS or any of the LFL definitions.
No FH= no family history of cancer; 5 Generations_analy
zed
Number of generations analyzed in the family.
6 Germline_mutatio n
A TP53 germline mutation has been identified.
7 MUT_ID Unique identifier of each gene variation reported in the database.
8 ExonIntron Location of the mutation in the introns or exons in TP53 gene.
9 Genomic_nt Genomic nucleotide position of the mutation based on the Genbank NC_000017
(7512445..7531642) reference sequence. 10 Codon_number For mutations in exons, codon number at
which the mutation is located (1-393). If a mutation spans more than one codon, only the first (5') codon is entered. For mutations in introns, 0 is entered 11 Type Nature of the mutation.
12 Description For substitutions, nucleotide change read from the coding strand by convention. For deletions and insertions, the number of bases deleted (del) or inserted (ins) is given. For more complex mutation events, a full description is given.
13 c_description Mutation nomenclature according to HGVS standards with the coding sequence as reference.
14 WT_codon For mutations in exons, normal base sequence of the codon in which the mutation occurred.
15 Mutant_codon Base sequence of the mutated codon. 16 WT_AA Wild-type amino acid encoded at the
codon in which the mutation occurred. 17 Mutant_AA Mutated amino acid encoded at the
codon in which the mutation occurred 18 Effect Effect of the mutation. The terms
occurring in this column are: missense (change of one amino-acid), nonsense (stop codon), FS (frameshift), silent (no change in the protein sequence), splice other
18 ProtDescription Mutation description at the protein level as recommended by HGVS
19 Individual_ID Unique identification number for an individual included in the database. It is automatically assigned by the database system.
20 Individual_code Code or number given in the original publication or an arbitrarily-asigned code, usually the family code followed by the position of the individual in the
family tree.
21 FamilyCase Family case in the pedigree, such as proband (index case), mother, father. 22 Generation Position of the individual in the family
tree.
23 Sex Sex of the individual.
24 Germline_carrier TP53 mutation status of the individual: confirmed= the individual has been tested for the presence of the mutation and the mutation has been found;obligatory= the individual has not been tested for the presence of the mutation but must be carrier based on the mutation status of the other individuals in the pedigree; 50%prob.= there is a chance of 50% that the individual is a mutation carrier; negative= the individual has been tested for the presence of the mutation and the mutation has not been found; NA= the individual has not been tested for the presence of the mutation.
25 Mode_of_inherita nce
Parent from which the mutation has been inherited. P=paternal, M=maternal, M&P=maternal and paternal, de novo= new mutation that has not been inherited, na=not known.
26 Dead Living status of the individual at time of follow-up. 0=alive; 1=dead
27 Unaffected Disease status of the individual at time of follow-up. 0 = affected by cancer; 1 = not affected by cancer.
28 Age Age of the individual at the time of follow-up.
29 Topography The topography corresponds to the primary site of the tumor and the site of metastasis is indicated in brackets in the tumor origin field.
30 Morphology Tumor type, including morphology and/or histologic type.
31 Age at diagnosis Age of the individual at the time of diagnosis of the tumor.
32 Ref_ID Reference number indicating the publication in which the mutation is described in the GermlineRefR15 file. 33 p53mut_ID Unique identifier of each gene variation
reported in the germline database.
C. Feature Relevance analysis
Feature relevance analysis has been an active and fruitful field of research area in pattern recognition, machine learning, statistics and data mining communities. The main objective of feature selection is to choose a subset of input variables by eliminating features, which are irrelevant or of no predictive information. Feature selection has proven in both theory and practice to be effective in enhancing learning efficiency, increasing predictive accuracy and reducing complexity of learned results. Feature selection in supervised learning has a main goal of finding a feature subset that produces higher classification accuracy.
Feature Construction
Choosing good features to represent objects can be crucial to the success of supervised machine learning algorithms. Good high-level features are those that concentrate information about the classification task. Feature Construction attempts to discover relations between the existing features and creates new features that reflect those relations
Fisher filtering is a supervised feature selection algorithm [16] which processes the selection independently from the learning algorithm. It follows univariate Fisher's ANOVA ranking which ranks the inputs attributes according to their relevance without considering the redundancy aspects of input attributes.
Runs filtering [16] are a non parametric test for predictive attribute evaluation. It is an univariate attribute ranking from runs test. It is a supervised feature selection algorithms based upon a filtering approach i.e. processes the selection independently from the learning algorithm. This component ranks the inputs attributes according to their relevance without considering redundancy aspect. A cutting rule enables to select a subset of these attributes.
ReliefF algorithm [16] detects conditional dependencies between attributes and provides a unified view on the attribute estimation in regression and classification. It is not limited to two class problems, is more robust and can deal with incomplete and noisy data.
STEPDISC (Stepwise Discriminant Analysis) [16] procedure performs a stepwise discriminant analysis to select a subset of the quantitative variables for use in discriminating among the classes. The set of variables that make up each class is assumed to be multivariate normal with a common covariance matrix. The STEPDISC procedure can use forward selection, backward elimination, or stepwise selection.
After performing feature relevance analysis, various classification algorithms are applied over this training dataset before filtering irrelevant attributes as well as on the relevant attributes after filtration.
D. Classification Algorithms
Naïve Bayes
The Naïve Bayes Classifier [17] technique is based on the Bayesian theorem and is particularly suited inputs which has dimension high. Despite of its simplicity, It can often outperform more sophisticated classification methods. The Naive Bayes continuous which works similarly with continuous variable as input.
ID3
In ID3 decision tree, each node corresponds to splitting attribute. It uses information gain to determine the splitting attribute. The attribute with the highest information gain is taken as the splitting attribute. Information gain is the difference between the amount of information needed to make a correct prediction before and after splitting. Information gain can also be defined as the different between the entropy of the original segment and the accumulated entropies of the resulting split segments. Entropy is the measure of disorder found in the data. ID3 can handle high-cardinality predictor variables. A high-cardinality predictor is a variable which has different possible values thus having different possible ways of performing a split.
K-NN
The k-nearest neighbor algorithm (k-NN) [17] is a method for classifying objects based on closest training examples in an n-dimensional pattern space. When given an unknown tuple the classifier searches the pattern space for the k training tuples that are closest to the unknown tuple. These k training tuple are the k nearest neighbour of the unknown tuple.
Multilayer Perceptron
It is the most popular network architecture [19] in today world. The units each perform a biased weighted sum of their inputs and pass this activation level through a transfer function to produce their output. The units are arranged in a layered feed forward topology. The network has a simple input-output model, with the weights and thresholds. Such networks can model functions of almost arbitrary complexity, with the number of layers, and the number of units in each layer, determining the function complexity. The important issues in Multilayer Perceptron are the design specification of the number of hidden layers and the number of units in these layers.
LDA
Linear discriminant analysis (LDA) [16] is a classical statistical approach developed by R.A Fisher for classifying samples of unknown classes, based on training samples with known classes. LDA is closely related to ANOVA (analysis of variance) and regression analysis, which also attempt to express one dependent variable as a linear combination of other features or measurements Rnd Tree
A Random forest tree [18] consists of a collection or ensemble of simple tree predictors, each capable of producing a response when presented with a set of predictor values. For classification problems, this response takes the form of a class membership, which associates, or classifies, a set of independent predictor values with one of the categories present in the dependent variable. For regression problems, the tree response is estimated for the dependent variable given by the predictors.
PLS-DA & PLS – LDA
PLS-DA is a regression technique [16] usually designed to predict the values taken by a group of dependent variables from a set of independent variables. For the prediction of continuous target variable, the PLS regression can be adapted to the prediction of one discrete variable - i.e. the supervised learning framework in different ways .which is referred as "PLS Discriminant Analysis". In PLS-LDA (PLS Linear Discriminant Analysis) is similar to PLS-DA where the number of descriptors is moderately high in relation to the number of instances.
IV. EXPERIMENTAL RESULTS AND PERFORMANCE
EVALUATION
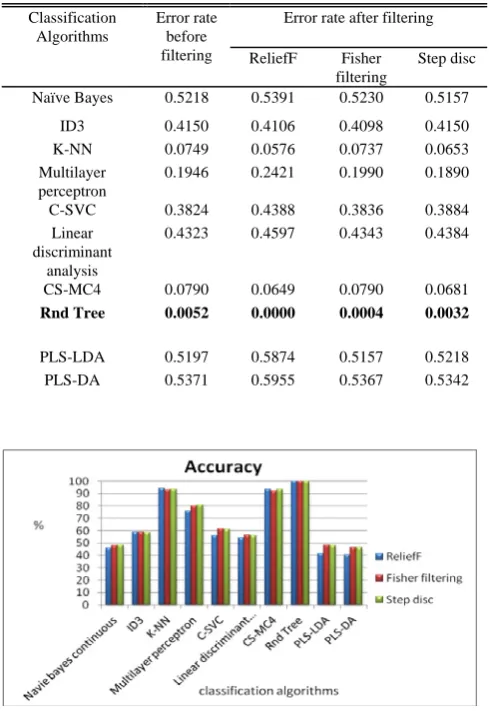
continuous or discrete attributes. For this dataset, the input attributes are transformed into continuous attributes using disc to cont function, then the filtering algorithms such as Fisher filtering, Runs filtering, ReliefF filtering and Stepwise Discriminant Analysis are applied to the feature constructed dataset and the results are given in Table II. Then classification algorithms such as Naive Bayes, ID3, K-NN, multilayer perceptron, C-SVC, Linear discriminant analysis, CS-MC4, Rnd tree, PLS-LDA, PLS-DA are applied to each of the above filtering algorithms and the results are given in Table III.
ReliefF filtering produces above 100% accurate results for Rnd –tree algorithms; above 90% accuracy for CS-MC4 and K-NN classifier. Fisher filtering produces 99% accuracy for Rnd-tree algorithm; above 80% for multilayer perceptron filtering and above 90% accuracy for K-NN algorithm. Stepwise discriminant analysis provides above 99% for Rnd –tree algorithm and above 90% accuracy for CS-MC4 and K-NN classifiers and above 80% for multilayer perceptron classifier. From the results, the Rnd tree classification is considered as a best classifier, as it produced 99% accuracy through all the three classifiers. Regression analysis is performed on this best classifier to predict the class label of the training dataset.
A. Error rate
Error rate of a classifier was defined as the percentage of the dataset incorrectly classified by the method. It is the probability of misclassification of a classifier
B. Accuracy
Accuracy of a classifier was defined as the percentage of the dataset correctly classified by the method. The accuracy of all the classifiers used for classifying this TP53 germline dataset are represented graphically in Figure 2
C. Recall
Recall of the classifier was defined as the percentage of errors correctly predicted out of all the errors that actually occurred. The recall of the best classifier Rnd Tree is given in Figure 3.
D. Precision
Precision of the classifier was defined as the percentage of the actual errors among all the encounters that were classified as errors.
The terms positive and negative refer to the classifier's prediction, and the terms true and false refer to classifier’s expectation
TABLEIII
ERRORRATEOFTP53CLASSIFICATION Classification
Algorithms
Error rate before filtering
Error rate after filtering
ReliefF Fisher filtering
Step disc
Naïve Bayes 0.5218 0.5391 0.5230 0.5157
ID3 0.4150 0.4106 0.4098 0.4150
K-NN 0.0749 0.0576 0.0737 0.0653
Multilayer perceptron
0.1946 0.2421 0.1990 0.1890
C-SVC 0.3824 0.4388 0.3836 0.3884
Linear discriminant
analysis
0.4323 0.4597 0.4343 0.4384
CS-MC4 0.0790 0.0649 0.0790 0.0681
Rnd Tree 0.0052 0.0000 0.0004 0.0032
PLS-LDA 0.5197 0.5874 0.5157 0.5218
PLS-DA 0.5371 0.5955 0.5367 0.5342
Fig 2-Accuracy for the classifiers listed in Table-II TABLEII
FEATURESELECTION S.
No
Feature selection algorithm No of attributes
Before splitting
After splitting
1 Fisher filtering 33 31
2 Runs filtering 33 33
3 ReliefF 33 17
4 Stepwise discriminant analysis
[image:5.595.304.549.332.688.2]Fig 3-Recall of Rnd Tree Classifier
V. CONCLUSION
As TP53 mutations are the underlying cause of LFS, which leads to breast cancer, brain tumors, and adrenal cortical carcinomas. Therefore, analysis of TP53 mutants accurately becomes an important issue among the medical research group. This paper helps in finding the best classifier for IARC TP53 germline dataset through feature relevance analysis. The evolved classifier has produced 100% accuracy for the Random forest tree classifier using ReliefF feature selection algorithm and it also accurately classified the test dataset.
ACKNOWLEDGMENT
This research work is a part of the All India Council for Technical Education(AICTE), India funded Research Promotion Scheme project titled “Efficient Classifier for clinical life data (Parkinson, Breast Cancer and P53 mutants) through feature relevance analysis and classification” with Reference No:8023/RID/RPS-56/2010-11, No:200-62/FIN/04/05/1624..
REFERENCES
[1] Achatz MI, Olivier M, Calvez FL, Martel-Planche G, Lopes A, Rossi BM, Ashton-Prolla P, Giugliani R, Palmero EI, Vargas FR, Rocha JC, Vettore AL, Hainaut P. The TP53 mutation, R337H, is associated with Li-Fraumeni and Li-Fraumeni-like syndromes in Brazilian families. Cancer Letters 2007 Jan 8; 245(1-2):96-102.
[2] Arun K Pujari, Data Mining Techniques, University Press 2001 [3] Birch JM, Alston RD, McNally RJ, Evans DG, Kelsey AM, Harris M,
Eden OB, Varley JM. Relative frequency and morphology of cancers in carriers of germline TP53 mutations. Oncogene 2001 Aug 2;20(34):4621-8.
[4] Birch JM, Blair V, Kelsey AM, Evans DG, Harris M, Tricker KJ, Varley JM. Cancer phenotype correlates with constitutional TP53 genotype in families with the Li-Fraumeni syndrome. Oncogene. 1998 Sep 3;17(9):1061-8.
[5] Bond GL, Hu W, Bond EE, Robins H, Lutzker SG, Arva NC, Bargonetti J, Bartel F, Taubert H, Wuerl P, Onel K, Yip L, Hwang SJ, Strong LC, Lozano G, Levine AJ. A single nucleotide polymorphism in the MDM2 promoter attenuates the p53 tumour suppressor pathway and accelerates tumour formation in humans. Cell 2004 Nov 24;119(5):591-602.
[6] Bougeard G, Baert-Desurmont S, Tournier I, Vasseur S, Martin C, Brugieres L, Chompret A, Bressac-de Paillerets B, Stoppa-Lyonnet D, Bonaiti-Pellie C, Frebourg T. Impact of the MDM2 SNP309 and p53 Arg72Pro polymorphism on age of tumour onset in Li-Fraumeni syndrome. J Med Genet. 2006 Jun;43(6):531-533.
[7] Gonzalez KD, Noltner KA, Buzin CH, Gu D, Wen-Fong CY, Nguyen VQ, Han JH, Lowstuter K, Longmate J, Sommer SS, Weitzel JN. Beyond Li Fraumeni Syndrome: clinical characteristics of families with p53 germline mutations. J Clin Oncol. 2009 Mar 10;27(8):1250-6.
[8] Han J and Kamber M, Data Mining: Concepts and Techniques, Morgan Kaufmann Publications, second edition 2006.
[9] Lalloo F, Varley J, Moran A, Ellis D, O'dair L, Pharoah P, Antoniou A, Hartley R, Shenton A, Seal S, Bulman B, Howell A, Evans DG. BRCA1, BRCA2 and TP53 mutations in very early-onset breast cancer with associated risks to relatives. Eur J Cancer. 2006 May;42(8):1143-50.
[10] Nichols KE, Malkin D, Garber JE, Fraumeni JF Jr, Li FP. Germ-line p53 mutations predispose to a wide spectrum of early-onset cancers. Cancer Epidemiol Biomarkers Prev. 2001, pp 83-87.
[11] Olivier M, Goldgar DE, Sodha N, Ohgaki H, Kleihues P, Hainaut P, Eeles RA. Li-Fraumeni and related syndromes: correlation between tumor type, family structure, and TP53 genotype. Cancer Res. 2003 Oct 15;63(20):6643-50.
[12] Tabori U, Malkin D. Risk stratification in cancer predisposition syndromes: lessons learned from novel molecular developments in Li-Fraumeni syndrome. Cancer Res. 2008 Apr 1;68(7):2053-7. Review. [13] Varley JM, Evans DG, Birch JM. Li-Fraumeni syndrome--a molecular
and clinical review. Br J Cancer. 1997;76(1):1-14.
[14] Varley JM. Germline TP53 mutations and Li-Fraumeni syndrome. Hum Mutat 2003 Mar;21(3):313-20.
[15] International Agency for Research on cancer(IARC),TP53 germline mutation database http://www-p53.iarc.fr/Germline.html
[16] Tanagra-Data Mining tutorials http://data-mining- tutorials. .blogspot.com.
[17] StatSoft Electronic Statistics Textbook http://www.statsoft.com/textbook.
[18] R. Geetha Ramani, G. Sivagami, Parkinson Disease Classification using Data Mining Algorithms, International Journal of Computer Applications (0975 – 8887) Volume 32– No.9, October 2011. [19] Shomona Gracia Jacob, R.Geetha Ramani, Discovery of Knowledge
Patterns in Clinical Data through Data Mining Algorithms: Multi-class Categorization of Breast Tissue Data, International Journal of Computer Applications (0975 – 8887) Volume 32– No.7, October 2011.
S.Poonkuzhali received B.E degree in Computer Science and Engineering from University of Madras, Chennai, India, in 1998, and the M.E degree in Computer Science and Engineering from Sathyabama University, Chennai, India, in 2005. Currently she is pursuing Ph.D programme in the Department of Information and Communication Engineering at Anna University – Chennai, India. She has presented and published 20 research papers in international conferences & journals and authored 5 books. She is a life member of ISTE (Indian Society for Technical Education) ,IAENG (International Association of Engineers), and CSI (Computer Society of India).
R . Geetha Ramani is Professor & Head in Department of Computer Science and Engineering, Rajalakshmi Engineering College, India. She has more than 15 years of teaching and research experience. Her areas of specialization include Data mining, Evolutionary Algorithms and Network Security. She has over 50 publications in International Conferences and Journals to her credit. She has also published a couple of books in the field of Data Mining and Evolutionary Algorithms. She has completed an External Agency Project in the field of Robotic Soccer and is currently working on projects in the field of Data Mining. She has served as a Member in the Board of Studies of Pondicherry Central University. She is presently a member in the Editorial Board of various reputed International Journals.