Land Use Forecasting based upon Travel
Behaviour Pattern - A Case Study of Nasik
Mr. Rahul Choudhari1, Prof. Shishir Dadhich2
1, 2
Sandip university Nasik, India
Abstract: The city as a whole is considered a composite system, as it consists of frequent interactive sub systems. Land use and transportation are considered to be the most important subsystems among all. Travel is a derived demand of land use design, while Transportation also affects land use. Land use based urban growth is also one of the main aspect in the urban development studies and it is driven by population explosion and transportation development. To derive the relation between different land use and travel performance is very difficult as well as dynamic. The main objective of this research is to decide future land use by accessing impact of land use change on trip attraction for the study area Nasik City. Nasik City is located in the state of Maharashtra on the Western part of India. It is one of the fastest growing cities with rapid growth rate of migration from all over the country. At present the city is spread over an area of 2681 sq. km. As a result of rapid urbanization and population detonation in the past decade, land use of the Nasik city has knowledgeable the dynamic change. To decide future land use by accessing force of land use change on trip attraction, the present study has been taken up.
Keywords: Land use, Transportation, Nasik City, trip.
I. INTRODUCTION
Nasik is the third largest urban area in the state of Maharashtra covering an area of about 267.48 square kilometers (i.e. 26747.75 hectares) with a population of 1.48 million as per 2011 census. Nasik Municipal Corporation includes 25 villages out of which Vihitgaon, Vadner and PimpalgaonKhamb are partly included. With increasing migration to urban areas, increasing population brings with it rapid motorization leading to congestion and pollution. To alleviate the existing and future transport problems of Nasik, it is essential to develop a Comprehensive Traffic and Transport Plan that provides a long phrase vision and mobility solutions for the citizens of Nasik.
In most of the little sized Indian cities, there will be a significant increase in the modal shares of private transport modes such as cars and motorized two-wheelers. Also, the share of the public transport modes (5%) and non-motorized modes (38%) is falling in many of these cities. According to a report available with the Ministry of Urban Development, Govt. of India (2008), the percentage mode share of public transfer for small cities with population less than five hundred thousand was very low and also predicted it to be much lower in future (2% in 2031). In the year 2031, the share of non-motorized modes would be 26% in these cities. In India, many towns of medium size are rapidly growing and travel patterns observed in these cities are significantly changing. These changes may be attributed to the change in the socio-economic, and land use characteristics. Land use planning has significant impacts on many travel related parameters. Appropriate land use planning results in in general reduction of travel (expressed in vehicles or persons kilometre travelled) and a significant modal shift from personalized modes to public or no motorized transport modes. In the past, various researchers have analyzed the land use effects on travel behaviour.
A. Travel Demand Modelling And Forecasting
The main focus of the study is to build up a long-term transportation strategy for Nasik with the help of an urban transport planning model. The process of replicating the “real world” transportation classification and forecasting the state of the system for the possibility year is generally referred to as Transport Demand Modeling. Often this is done by the use of highly developed position of the art computer packages such as CUBE, EMME2, TRANSCAD, TRANPLAN etc. built overtly for such purposes.
The data that would affect the travel patterns are changes in the transportation system (e.g., new roads, wider roads, Metro etc); changes in the earth use (e.g., more residential development, more employment, SEZ etc.); and changing demographics (satellite towns, increasing per capita income, right to use to confident motor vehicle modes, etc.). The base network is developed in GIS using current roadway inventory data. Socio-economic data such as family circle size, sports car availability, employment data and other census data are also utilize.
B. Urban Mobility Strategies
The mobility goals for Nasik need to be addressed from side to side a multipronged approach. Solutions for complex transport improvements cannot be achieved by a single strategy. The next strategy need to be adopted in tandem to meet the various goals set for Nasik.
1) Land Use and Transport Strategy
2) Development of Mobility Corridors
3) Public Transit Improvement Strategy
4) Non-Motorized Transport Strategy
5) Freight Management Strategy
6) Traffic Engineering Measures
7) Travel Demand Management Strategy
8) Technological Strategy
It is important to note that each of the above strategies is equally important and the order of listing does not imply precedence. Each of the broad strategy includes sub strategies of immense importance. The strategies when implemented through specific projects shall fulfill the goals and objectives of this CTTP. The sections below discuss these strategies.
II. LITERATURE REVIEW
1) Todor Stojanovski: The lack of mobility choices in many Swedish neighborhoods and cities designed for automobiles hinders the possibilities to shift towards more sustainable travel alternatives. Urban designers and planners can help with redesigning these neighborhoods and creating built-up forms that encourage walking, cycling and increased use of public carrying if they are informed about the environmental routine and carbon implications of moving systems in existing and newly planned neighborhood. This paper proposes a mobility choices model based on urban form and accessibility factors commonly used in urban planning and design practices. The mobility choices model produces heat maps and visually informs about the integration with walking, cycling, public transportation and private car, modal shares, carbon emissions and transportation energy use. This in sequence can (potentially) trigger urban transformation or redesign to better integrate sustainable travel alternatives in these neighborhoods and contribute to more sustainable cities. Many houses can have an excellent environmental performance as buildings but they can be located at a distance where it is impossible to walk, cycle or use public transportation. The benefits of energy efficient and carbon neutral home then disappear with extensive travel and commuting by automobile.
declines at first, but rebounds through the surveillance period in all frontier types after 2012.Further research is needed to better comprehend the role of the altering political environment in driving these medium as well as short-term transformations in land-use and land-cover change. Furthermore, policy-makers, worldwide cooperation, and civil society must seek strong integration between value chain based governance measures and effective environmental law enforcement.
3) S Niranjan, Mahesh Kumar Chenna, Amit Bhandari &Supraja K: This document has been prepared for the ”Comprehensive Traffic and Transportation Plan for Nasik” and should not be relied upon or used for any other project without an independent check being carried out as to its suitability and prior written authority of UMTC being obtained. UMTC accepts no responsibility or liability for the consequence of this document being used for a purpose other than the purposes for which it was commissioned. Any person using or relying on the document for such other purpose agrees, and will by such use or reliance be taken to confirm his agreement to indemnify UMTC for all loss or damage resulting there from. UMTC accepts no responsibility or liability for this document to any party other than the person by whom it was commissioned.
4) Syed Fazal Abbas Baqueri , Won Do Leeb, LukKnapena, Tom Bellemansa, Davy Janssensa, Ansar-Ul-HaqueYasara, Geert Wetsa: A multitude of studies have been motivated on the organization between land use, urban settings and transport infrastructure to assist policy makers in sustainable planning. Alike, incorporation of cross-border trips have been an integral part of transportation demand models through external surveys. The present study seeks to explore the Incoming Cross Border Traffic (ICBT) into a study area based on the characteristics of a study area that attracts cross-border trips from outer surface region. This paper presents an examination of cross-border trips in Karachi Metropolis, largest city of Pakistan, through Household Individual Survey (HIS-2010) and land use data from option resources. Results reveal that land use particulars, socioeconomic characteristics and travel attribute of individuals significantly influence cross-border trips and this effect varies spatially. Work, shopping and Education trips are discussed through separate models in this paper with a number of practical insights to policy makers for sustainable development of city. This study contribute in elucidating travel behaviour through land use parameters and also persuade professionals to integrate estimation of cross-border trips by socioeconomic parameter, in bring forecasting models.
5) Konstadinos G. Goulias: Planning for transportation requires analysis, modeling, and simulation of the use and performance of transportation systems. The ultimate objective is to design efficient infrastructure and services to meet our needs for accessibility and mobility, but also to implement policies improving sustainability. At the center of this design are analytical methods requiring understanding of human actions. Understanding human behavior requires us to collect data, and analyze and develop synthetic models of human agency in its most important dimensions and most simple constituent parts. This includes but is not limited to understanding individual development along life-cycle paths and the complex interface between an individual and the anthropogenic, accepted, indocile environments. Travel behavior analysis aims to understand how traveler values, norms, attitudes, and constraints lead to observed behavior. Traveler values and attitudes refer to motivational, cognitive, situational, and dispositional factors that determine human behavior.
III.STUDY AREA PROFILE
Vehicle is the main component of the transport system. Vehicle is used for ease and for time reduction purpose .Therefore vehicle are increasing day by day in number become use of communication social purpose also. Our Nasik city in Maharashtra is fastly growing city among the country as well as planet and it is declared asmetrocity earlier than some years. The present situations ban the BS-3 engines greater than before sudden traffic. And like kumbhmela sudden increase in traffic in kumbhmela period. So need the supervision of traffic and underneath the safe driving and to solve the problem of traffic.
In the Nasik in Maharashtra state different types of vehicle’s like four wheeler’s , three wheeler’s , two wheeler’s ,cycle’s , etc. Nasik has grown city from a population of 1077236 in 2001 to 15 lakh’s in 2011. The current population is approximately 1.48 million Nasik city enlarge rate are most as measure up to to other so that population effect are traffic so daily transfer are increases.
A. Demographic Characteristics
As per the 2011 census, the total population of the entire area of Nasik Municipal Corporation, was 14,86,053 souls as against the 2001 census population of 10,77,236 souls, indicating the growth rate of 37.95% during 2001-2011 decade. Similarly, population for 1991 was 7, 33,000 souls indicating decadal growth of 46.96%. Following Table shows decadal population growth.
Table 3.1: Population Growth of Nashik City from 1921.
YEAR TOTAL POPULATION ABSOLUTE GROWTH GROWTH IN PERCENTAGE
1921 38230 8132 27.02
1931 45744 7514 19.65
1941 52386 16642 14.52
1951 97042 44656 85.24
1961 131103 34061 35.10
1971 176091 44988 34.32
1981 262428 86337 49.03
1991 733000 394497 50.33
2001 1077236 420311 63.98
2011 1486053 689233 69.74
Figure 2. Population Growth
Table 3.2: Growth of Area Boundary of Nashik City over the Years.
YEAR
AREA (SQ.KM) TOTAL POPULATION
1881 13 8132
1931 20 45744
1951 47 97042
1981 147 262428
2011 259 1486053
2001 250 1077236
IV.DATA COLLECTION
A. Inventory Data
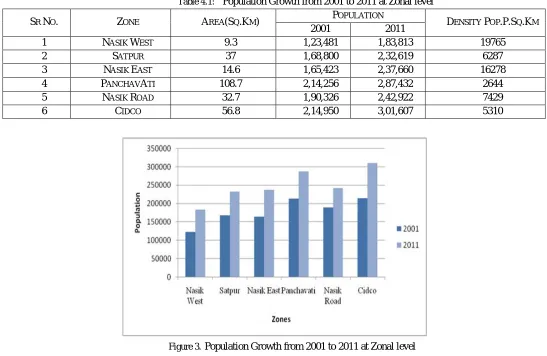
Table 4.1: Population Growth from 2001 to 2011 at Zonal level
SR NO. ZONE AREA(SQ.KM) POPULATION DENSITY POP.P.SQ.KM
2001 2011
1 NASIK WEST 9.3 1,23,481 1,83,813 19765
2 SATPUR 37 1,68,800 2,32,619 6287
3 NASIK EAST 14.6 1,65,423 2,37,660 16278
4 PANCHAVATI 108.7 2,14,256 2,87,432 2644
5 NASIK ROAD 32.7 1,90,326 2,42,922 7429
[image:5.612.32.579.101.457.2]6 CIDCO 56.8 2,14,950 3,01,607 5310
Figure 3. Population Growth from 2001 to 2011 at Zonal level
V. DATA ANALYSIS
Since then, due to population detonation and rapid urbanization growth rate, land use of Nasik city has undergone drastic change. While the change is land use has affected overall people movement throughout the city. To decide future land use by access impact of land use change on trip attraction for the study area, existing land use and trip hold behaviour is to be analyzed in detail.
A. Household Characteristics
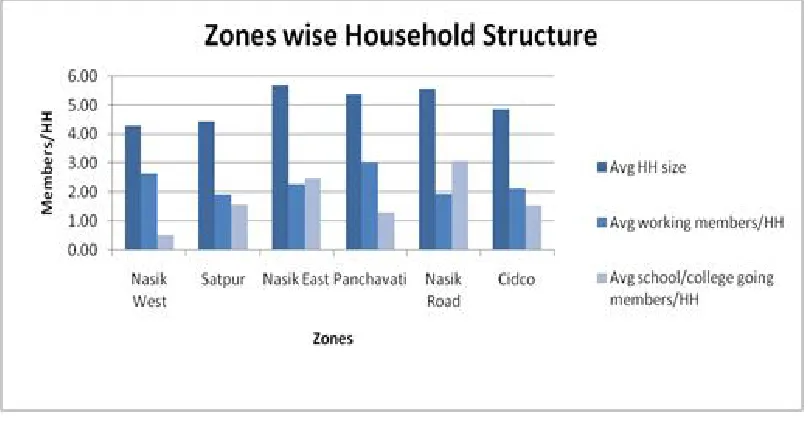
[image:5.612.37.580.603.715.2]The household structure such as number of working members, number of school /college going members plays a very important role in the trip making behaviour of the individual household. In the study area it is observed that the average family size is between 4 to7. Table 5.1 shows the range of family size, average working members and average school going members per household.
Table 5.1: Zone wise Household Structure
ZONE AVG HH SIZE AVG WORKING
MEMBERS/HH
AVG SCHOOL/COLLEGE GOING MEMBERS/HH
NASIK WEST 4.30 2.64 0.52
SATPUR 4.45 1.91 1.58
NASIK EAST 5.70 2.27 2.48
PANCHAVATI 5.39 3.06 1.30
NASIK ROAD 5.58 1.94 3.09
Figure 4. Zone wise Household Structure
VI.VEHICLE OWNERSHIP PATTERN
[image:6.612.37.581.379.709.2]The data collected for vehicular ownership/HH at zonal level is analyzed and presented in Table no.- 5.2. It is observed that the range of 2 wheeler ownership lies between 1.58 in North zone to 2.35 in West zone. While 4 wheeler ownership is also high in West zone i.e 0.77. The city level scenario depicts.
Table 5.2: Zone wise vehicular ownership/HH
ZONE CAR/HH WHEELER/HH BICYCLE/HH
NASIK WEST 2.36 0.96
SATPUR 2.18 0.64
NASIK EAST 2.39 0.82
PANCHAVATI 2.55 0.67
NASIK ROAD 2.33 0.52
CIDCO 2.48 0.88
VII. PURPOSE WISE TRIP GENERATION
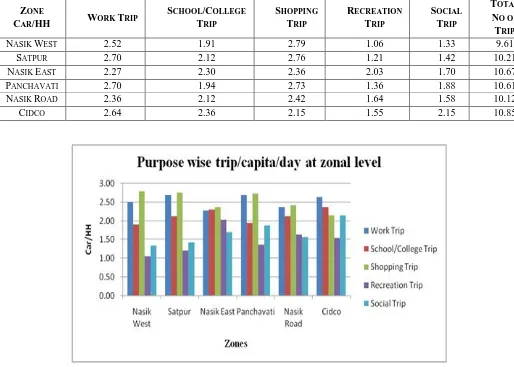
[image:7.612.51.565.150.517.2]In the study area it is observed that trip generation generally takes place for the purpose like work, study, shopping, recreation and social. From the examination it is observed that most daily trips takes place for the work and study purpose. The Table No 5.3 below shows the purpose wise trip/ capita at zonal level.
Table 5.3: Purpose wise trip/capita/day at zonal level
ZONE
CAR/HH WORK TRIP
SCHOOL/COLLEGE TRIP
SHOPPING TRIP
RECREATION TRIP
SOCIAL TRIP
TOTAL NO OF TRIP
NASIK WEST 2.52 1.91 2.79 1.06 1.33 9.61
SATPUR 2.70 2.12 2.76 1.21 1.42 10.21
NASIK EAST 2.27 2.30 2.36 2.03 1.70 10.67
PANCHAVATI 2.70 1.94 2.73 1.36 1.88 10.61
NASIK ROAD 2.36 2.12 2.42 1.64 1.58 10.12
CIDCO 2.64 2.36 2.15 1.55 2.15 10.85
Figure 6. Purpose wise trip/capita/day at zonal level
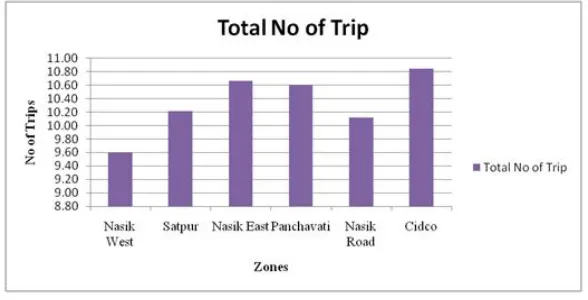
VIII. TOTAL TRIPS/HH/DAY AT ZONAL LEVEL
The Table No 5.3 shows the total number of trips occurring per household at zonal level. It is found that maximum number of trips/HH counting all purpose is very high in Cidco zone i.e. 10.85 trip/HH and low in Nasik West i.e. 9.61 trips/HH. The graph 5-5 represents the range of trips/HH; it lies between 5.6 to 8.6.
Table 5.4: Total Trips/HH/Day at Zonal level
ZONES TOTAL NO OF TRIP AVG HH SIZE
NASIK WEST 9.61 4.30
SATPUR 10.21 4.45
NASIK EAST 10.67 5.70
PANCHAVATI 10.61 5.39
NASIK ROAD 10.12 5.58
[image:7.612.31.580.598.698.2]Figure 7. Total Trips/HH/Day at Zonal level
IX.CONCLUSIONS
The present study is passed out to estimate land use for partly developed or undeveloped area based on trip attraction examination for the learning area of Nasik City. The study comprise two major analysis, i) Land use analysis and ii) Trip attraction analysis. Based on this two analysis various trip hold models are residential. The whole study is summarized in the following major heads, a) Household Characteristics, b) Vehicular Ownership Pattern, c) Purpose of Trip generation and Total Trip at Zonal level concluded here after
A. The household structure such as number of working members, number of school /college going members plays a very important
role in the trip production behaviour of the human being household. In the study area it is observed that the average family size is between 4 to7. Table 5.1 shows the range of family size, average working members and average school going members per household.
B. The data together for vehicular ownership/HH at zonal level is analyzed and presented in Table no.- 5.2. It is observed that the series of 2 wheeler ownership lies between 1.58 in North zone to 2.35 in West zone. While 4 wheeler ownership is also high in West zone i.e 0.77. The city level scenario depicts.
C. In the study area it is observed that trip generation generally takes place for the purpose like work, study, shopping, recreation and social. From the analysis it is experimental that maximum daily trips takes place for the work and study purpose. The Table No 5.3 below shows the purpose wise trip/ capita at zonal level.
D. The Table No 5.3 shows the total number of trips occurring per household at zonal level. It is found that maximum number of
trips/HH including all purpose is very high in Cidco zone i.e. 10.85 trip/HH and low in Nasik West i.e. 9.61 trips/HH. The graph 5-5 represents the range of trips/HH; it lies between 5.6 to 8.6.
REFERENCES
[1] Chandra R. Bhat and T. Keith Lawton “Passenger Travel Demand Forecasting” Committee on Passenger Travel Demand Forecasting, 2012.
[2] David Kriger ,Rhys Wolff, Ahmad Subhani and Donald Cleghorn “ Trends In Urban Travel: Implications For Planning And Forecasting” Success Stories in Urban Transportation Planning Practices , 2011.
[3] IshakChe Abdullah, Fatimah Yusof ,SitiMazwinKamaruddin, Abdul Rauf Abdul Rasam “Travel Behaviour And Landuse Planning: The Planning Of Mosque In Shah Alam, Selangor” Procedia - Social and Behavioral Sciences , Vol. 105, Pp.No - 723 – 733, 2013.
[4] Johannes Schieleina and Jan Börnera,b “Recent Transformations Of Land-Use And Land-Cover Dynamics Across Different Deforestation Frontiers In The Brazilian Amazon” Land Use Policy , Vol – 76 , Pp.No – 81-94, 2018.
[5] Joyce M Dargay and Mark Hanly “The Impact Of Land Use Patterns On Travel Behaviour” European Transport Conference Strasbourg, France ,2003. [6] Konstadinos G. Goulias “Travel Behavior Models” Draft of a Chapter for Handbook of Behavioral and Cognitive Geography, 2016.
[7] ParthaPratim Sarkar and C. Mallikarjuna “Effect Of Land Use On Travel Behaviour: A Case Study Of Agartala City” Procedia - Social and Behavioral Sciences, Vol – 104, Pp. No - 533 – 542, 2013.
[8] S Niranjan, Mahesh Kumar Chenna, Amit Bhandari &Supraja K “Development Of Scenarios And Urban Mobility Plan Report” Urban mass transit, 2017. [9] Syed Fazal Abbas Baqueri , Won Do Leeb, LukKnapena, Tom Bellemansa, Davy Janssensa, Ansar-Ul-HaqueYasara, Geert Wetsa “Estimating Incoming
Cross-Border Trips Through Land Use Data Resources - A Case Of Karachi City” Procedia Computer Science, Vol – 83, Pp.No - 270 – 277, 2016.