ISSN Print: 2151-1950
DOI: 10.4236/jgis.2019.111002 Feb. 1, 2019 17 Journal of Geographic Information System
Web-GIS Based Visualization System of
Predicted Ground Vibration Induced by
Blasting in Urban Quarry Sites
Youhei Kawamura
1, Yoshio Moriyama
1, Hyongdoo Jang
21Department of Earth Resource Engineering and Environmental Science, Akita University, Akita, Japan 2Minerals, Energy and Chemical Engineering, WASM, Curtin University, Kalgoorlie, Australia
Abstract
Blasting is routinely carried out at various resource extraction sites, even in urban areas. As a consequence of this, residents around urban quarry sites are affected by ground vibration induced by blasting on a regular basis. In this study, a prediction and visualization system for ground vibrations is devel-oped for the purpose of reducing the adverse psychological effects of blasting. The system consists of predicting ground vibration using an Artificial Neural Network (ANN) and visualizing it on an online map using Web-GIS. A pre-diction model using ANN that learned the optimum weight by taking 50 sets of data indicated a regression value of 0.859 and a Mean Square Error (MSE) of 0.0228. Compared with previous researches, these values are not bad re-sults. Peak Particle Velocity (PPV) was used as a metric to measure ground vibration intensity. A color contour is generated using GIS tools based on the PPV value of each prediction point. The system is completed by overlaying the contour onto a basic map in a website. The basic map shows the sur-rounding area through the use of Google Maps data. This system can be used by anyone with access to the internet and a browser, requiring no special software or hardware. In addition, mining operations can utilize the data to modify blasting design and planning to minimize ground vibration. In con-clusion, this system has the potential to alleviate the worries of surrounding residents caused by ground vibrations from blasting due to the fact that they can personally check the predicted vibration around their locale. Further-more, since this data will be publicly available on the internet, it is also possi-ble that this system can contribute to research in other fields.
Keywords
ANN, Prediction Model, PPV, Web-GIS, Ground Vibration Visualization
How to cite this paper: Kawamura, Y., Moriyama, Y. and Jang, H. (2019) Web-GIS Based Visualization System of Predicted Ground Vibration Induced by Blasting in Urban Quarry Sites. Journal of Geographic Information System, 11, 17-31.
https://doi.org/10.4236/jgis.2019.111002
Received: December 27, 2018 Accepted: January 29, 2019 Published: February 1, 2019
Copyright © 2019 by author(s) and Scientific Research Publishing Inc. This work is licensed under the Creative Commons Attribution International License (CC BY 4.0).
DOI: 10.4236/jgis.2019.111002 18 Journal of Geographic Information System
1. Introduction
Blasting is one of the excavating technique and the operation that breaks rocks using explosive. Blasting is routinely carried out at various resource extraction sites. As a consequence, when an instantaneous blast is caused by using large amounts of explosives, ground vibrations will propagate from the site to the ad-jacent areas. Besides, blasting generates problems such as fly rock, dust and fumes. The company which is running the site needs to exercise caution and ap-ply solutions so that these problems do not adversely affect the surrounding en-vironment. Specifically, in this study area, there are residential areas around a quarry site, so they must pay exceptionally more attention to these problems. Even if residential houses and other structures are not significantly affected, the ground vibration induced by blasting can induce anxiety and/or discomfort to residents. One of the main reasons for this effect is that there is only little infor-mation that nearby residents know about currently ongoing blasting operations. In previous researches on residents’ response to ground vibration induced by blasting, it has been observed that mental stress such as anxiety of the sur-rounding residents can be alleviated by providing blasting information prior to blasting activity [1]. In previous researches on ground vibration induced by blasting, these have been done that are aimed to develop a ground vibration pre-diction model by using nonlinear expressions and artificial intelligence [2] [3]
[4] [5]. However, few researches have been conducted for the purpose of
devel-oping a system that can reduce the influences on neighboring residences using prediction of ground vibration that is induced by blasting [6] [7].
In this research, we constructed a system that visualizes ground vibration on a map, using the Mikurahana quarry site located in the town of Hachirogata in Akita Prefecture, Japan as the experiment site. At first, as a construction proce-dure of this system, prediction model of ground vibration is generated by using Artificial Neural Network (ANN)1 that is one of the artificial intelligence. Then,
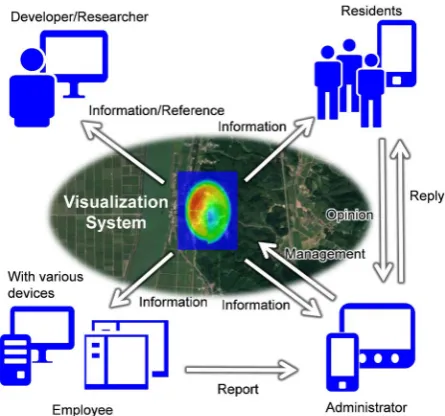
it will be possible to predict at multiple points around the quarry site using gen-erated prediction model. A contour that represents ground vibration intensity is drawn by using Geographic Information System (GIS) that integrates geospatial information. Finally, the contour is visualized on the map in the web area using Web-GIS. With this, any person who has access to a web browser can see the map. GIS and Web-GIS are already being used for land use maps, geology and hazard maps, and are used for disaster simulation and research on dynamic management system of resource extraction sites [8] [9] [10] [11] [12]. The pro-posed system design is shown in Figure 1. By visualizing the predicted vibration intensity of the ground vibration that is to be induced by blasting on the map found in an online website, anyone can access the information with a browser, and the predicted vibration intensity of the ground vibration at each point in the vicinity of the upcoming blast can be known. Using this system, there is a possi-bility of reducing the mental stress experienced by the surrounding residents.
1Application of artificial intelligence that mathematically simulates the logical processes of the
DOI: 10.4236/jgis.2019.111002 19 Journal of Geographic Information System
Figure 1. System design
Also, since the system is relatively eased to implement and use, it can be utilized in various fields such as operations management and further research.
2. System Overview
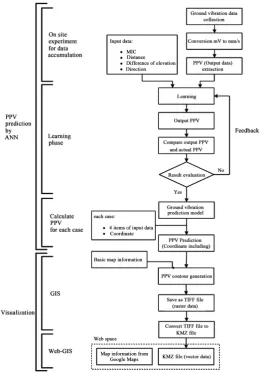
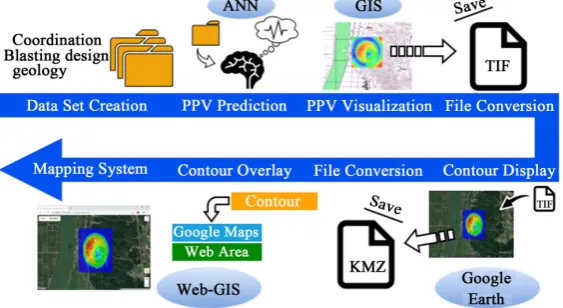
The implementation procedure of the system is shown in Figure 2. It is possible that construction procedure is intuitively understanding because of Figure 2. The detailed data handling is shown in Figure 3. Data handling consists of “PPV prediction by ANN” part and “Visualization” part. Further, “PPV prediction by ANN” is divided into “On site experiment for data accumulation”, “Learning phase” and “Calculate PPV for each case”. In the data accumulation, the Ground vibration data is first collected by on-site accelerometers. The ground vibration data obtained at the voltage value (V or mV) and finally converted into the ve-locity. Peak Particle Velocity (PPV)2 is extracted from velocity data [13]. The
collected data is fed to the ANN which is one of the machine learning method, and a prediction model of ground vibration induced by blasting is generated in the learning phase. Prediction of PPV in specific conditions (latitude/longitude, blast design, geographical condition etc.) is estimated using the prediction model in the PPV calculation. Also, “Visualization” part is divided into “GIS” and “Web-GIS”. In the GIS part, utilizing GIS and its ability to handle geospatial in-formation and overlay it along with other various inin-formation on the map, it is possible to visualize the predicted PPV linked to the latitude and longitude on a digital map. Specifically, ground vibration is expressed as color contours based on the PPV value of each predicted PPV. In order to use map created by GIS, a dedicated application is required, so it can be used only within a limited range in the Web-GIS part. Therefore, in order to expand the range, the map is generated and hosted online using Web-GIS. In the subsequent chapters, the measurement
2Peak value of particle velocity. It is used as a general index for evaluating ground vibration intensity
DOI: 10.4236/jgis.2019.111002 20 Journal of Geographic Information System
Figure 2. System implementation procedure.
[image:4.595.242.507.333.707.2]DOI: 10.4236/jgis.2019.111002 21 Journal of Geographic Information System
of ground vibration, the generation of prediction model using ANN, and the vi-sualization system by Web-GIS will be explained in detail.
3. Measurement of Ground Vibration and Generation of
Prediction Model Using ANN
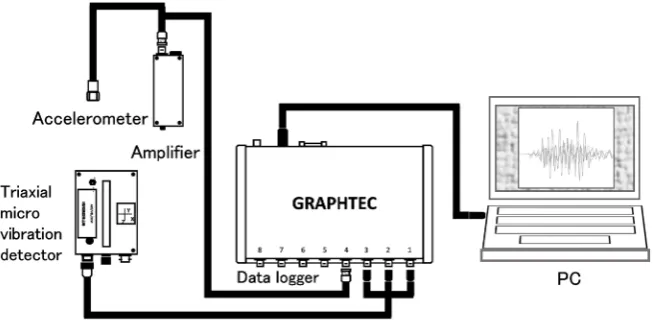
In the vicinity of the Mikurahana quarry site, there are residences located 10 - 20 meters from the quarry site. Under this circumstance, the study has been con-ducted at the Mikurahana quarry site as a feasible experiment site. Schematic diagram of apparatus to measure ground vibration is shown in Figure 4. Two types of sensors were used, a tri-axial micro vibration detector and a mono-axial accelerometer, collecting the ground vibration data. The points where measure-ments were made around the quarry site are indicated by yellow markers in
Figure 5. Ground vibration measurement is acquired as a voltage value (V or
mV), and is multiplied by a calibration coefficient inherent to the tri-axial micro vibration detector to convert this voltage value to acceleration (mm/s2). The
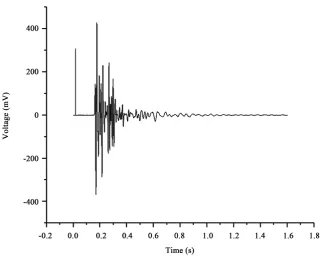
[image:5.595.211.538.525.685.2]mono-axial accelerometers with a different calibration coefficient are adjusted to the same coefficient as the tri-axial detector by using an amplifier. The ground vibration data is finally converted into velocity and PPV by taking integration, and is then used as a general index for evaluating ground vibration intensity. Since velocity is not affected by changes in geological conditions unlike accelera-tion and displacement, consistency and predictability are can be maintained even if conditions such as rock type and distance change [14]. Figure 6 shows an example of ground vibration data measured at the Mikurahana quarry site in terms of voltage values. The vertical axis of the graph represents the voltage val-ue, and the horizontal axis represents the measurement time, respectively. One measurement duration was set to 1.6 seconds. The sampling frequency was 10 kHz. A speed-time graph was prepared using a spreadsheet software and PPV was interpolated from the speed-time graph. Using Maximum Instantaneous Charge (MIC)3, distance, direction, elevation difference values as input data and
Figure 4. Schematic diagram of ground vibration measurement apparatus.
DOI: 10.4236/jgis.2019.111002 22 Journal of Geographic Information System
Figure 5. Points of ground vibration measurement.
Figure 6. Example of measured ground vibration data.
measured PPV as output data (target), a prediction model of ground vibration induced by blasting using ANN was generated using MATLAB. Idea of MIC is amount of explosive that detonating simultaneously within 8 milliseconds. The ANN is an application of artificial intelligence that mathematically simulates the logical processes of the human brain. In particular, the concept of ANN belongs in machine learning, and by accumulating and learning from data as “know-ledge”, it is a system that can perform certain simulations such as classification and regression. Since a prediction model using ANN shows relatively higher performance as compared to standard empirical estimation, ANN was used to generate the prediction model in this research [2] [3] [4] [5]. For example, coef-ficient of determination (R2) was 0.7987 when using nonlinear expressions and
[image:6.595.213.535.243.500.2]in-DOI: 10.4236/jgis.2019.111002 23 Journal of Geographic Information System
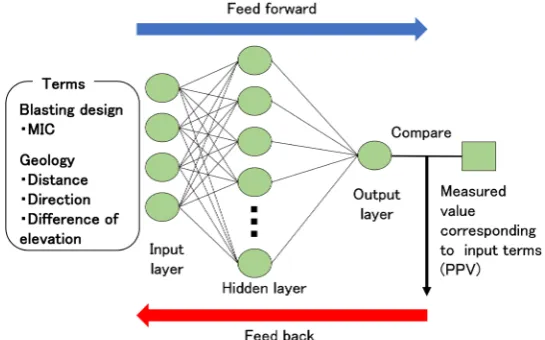
dicated. The prediction model using ANN is high prediction performance be-cause it can generate a prediction model specialized for the site. 50-sets of data consisting of input data and output data were prepared as data sets. This data set was separated into learning data, test data and verification data at a ratio of 30:10:10. Figure 7 shows a conceptual diagram of a prediction model of ground vibration using ANN. In this research, a three-layered neural network with a single hidden layer was designed. The learning procedure of the neural network is shown below. In the input layer, each value of the respective data is considered input. Weight is applied when proceeding to the hidden layer, and their sum value is outputted to the hidden layer. The predicted PPV is then sent to the output layer based on the total value of the hidden layer. Comparison between the predicted PPV with the measured value (measured PPV) then takes place. This result is then fed back to the neural network where the system improves prediction accuracy by changing the weight so that the error from comparison becomes progressively smaller. The weight is a parameter that determines the importance of the data. The weight is initially set as an appropriately fitted value. The cycle of data input, prediction, comparison and feedback modifies the weight so as to reduce the error. In other words, it could be said that the neural network is “learning” to optimize the weight.
Equation (1) shows the basic calculation model of the neural network. Values of previous layers are multiplied by coefficients and added together.
(k 1) (k 1)
(
(k 1) ( )k (k 1))
l + =
σ
+ W + l +b +(1)
The value attached to each symbol as an exponent denotes the number of the layers. This is a recurring formula for obtaining the value l(k+1) of the (
k + 1) layer from the value l( )k of the k layer. Where W is the weight and b is a bias that does not affect the nodes of the previous layer. σ is an activation function, and it has the function of adjusting the value
(
Wl b+)
, before it is sent to the [image:7.595.237.510.534.704.2]next layer. Weight W of Equation (1) is learned iteratively using learning data to make it the optimum value.
DOI: 10.4236/jgis.2019.111002 24 Journal of Geographic Information System
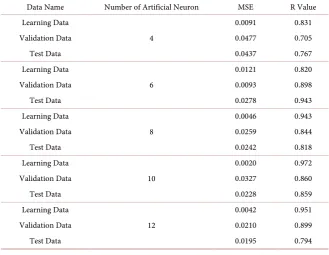
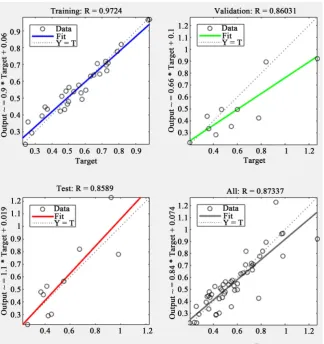
[image:8.595.209.539.474.729.2]After teaching the neural network using learning data, performance evalua-tion and generalizaevalua-tion of the neural network using test data and verificaevalua-tion data is done. Both the test data and the verification data are used to further im-prove the neural network. The evaluation result is displayed as a numerical value of regression and Mean Square Error (MSE). A value closer to 1 is desired for the regression value, and a value closer to 0 is desirable for the MSE. The num-ber of artificial neurons in the hidden layer (4, 6, ∙∙∙, 12) is divided and compared them to determine the optimum number of artificial neurons. Table 1 shows the comparison results of each prediction model. Based on the regression ratio and the MSE, it can be seen that the prediction model with 10 hidden layer artificial neurons showed the best performance. Figure 8 shows a regression analysis graph of a prediction model in which the number of artificial neurons in the hidden layer is 10. The vertical axis shows the predicted PPV (mm/s) based on the input, and the horizontal axis shows the measured PPV (mm/s) correspond-ing to the input. In this graph, a plot of each data and an approximate line are drawn, and it shows the correlation between the predicted PPV and the meas-ured PPV. The regression rate is higher as the approximate line and the plot overlap. The regression ratio of each data is 0.972 for learning data, 0.860 for ve-rification data, 0.859 for test data and 0.873 for all data sets. These regression rates close to 0.9, which in itself is desirable, but it is not as high of a regression ratio as compared with previous research. The average value of correlation coef-ficient cited from five previous researches is 0.981 [5] [13] [15] [16] [17]. The suspected reason for this discrepancy is data shortage. Despite this, it was de-cided that the data was sufficient for generating a prediction model with10 hid-den layer artificial neurons as a proof-of-concept.
Table 1. Comparison result of prediction model.
Data Name Number of Artificial Neuron MSE R Value Learning Data
4
0.0091 0.831
Validation Data 0.0477 0.705
Test Data 0.0437 0.767
Learning Data
6
0.0121 0.820
Validation Data 0.0093 0.898
Test Data 0.0278 0.943
Learning Data
8
0.0046 0.943
Validation Data 0.0259 0.844
Test Data 0.0242 0.818
Learning Data
10
0.0020 0.972
Validation Data 0.0327 0.860
Test Data 0.0228 0.859
Learning Data
12
0.0042 0.951
Validation Data 0.0210 0.899
DOI: 10.4236/jgis.2019.111002 25 Journal of Geographic Information System
Figure 8. Regression analysis graph.
4. Predicted Vibration Visualization System Using Web-GIS
Technology
DOI: 10.4236/jgis.2019.111002 26 Journal of Geographic Information System
Figure 9. Overview of creation of predictive vibration visualization system using Web-GIS.
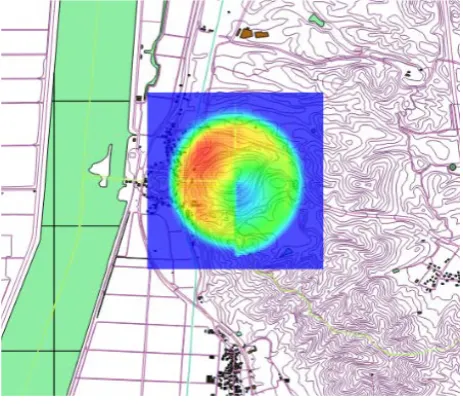
Secondly, the predicted PPV values at multiple points around the Mikurahana quarry site are visualized on a map using tool of GIS. Basic map information around the Mikurahana quarry site used in GIS was downloaded from the web-site of Geographical Survey Institute, Japan. Using the basic map information viewer, basic map information was converted to a shapefile and imported to GIS. The CSV files containing the prediction results for PPV values were also im-ported. Figure 10 shows the prediction result of PPV values displayed as mark-ers on the basic map. The different marker colors are denoting each of the 5 of the CSV files that were imported. Contours were created based on PPV values at each point using a function that converts marker information, which is vector data, to raster data. Figure 11 shows the PPV contour created. The closer the contour is to blue, the smaller the vibration, and the closer it is to red, the great-er the vibration. Since, PPV is proportional to ground vibration intensity, it can be said that the contour also represents the ground vibration intensity. As de-scribed above, since the prediction performance of the prediction model is not high, there is an irregularity in the contour color distribution.
In order to solve this problem, the study deems it necessary to increase the amount of data. Since the negative values reflect the magnitude of the numerical value irrespective of the sign, it is treated as 0, and the correction processing is performed so that the outside range of the minimum vibration (blue) has the same color. Although predicted vibration could be visualized, in this state, a person without access to GIS tools cannot see the visualized result of predicted vibration. Therefore, it is necessary to construct a system that anyone can use by overlaying visualized contours on the web-based map. Prediction vibration of ground vibration is visualized on the web-based map using Web-GIS. The basic map to be used on the website was acquired from Google Maps. Contours gen-erated with GIS needed to be converted to Keyhole Markup Language (KML)4
file format for ease of use in Hyper Text Markup Language (HTML) language.
4One of markup languages and it is used to display geographic data in Google maps and Google
DOI: 10.4236/jgis.2019.111002 27 Journal of Geographic Information System
Figure 10. Markers based on predicted PPV.
Figure 11. Contour of PPV.
To achieve this problem, contour raster data is converted into Tagged Image File Format (TIFF) and displayed once on Google Earth. Then, the contours dis-played in Google Earth are converted to KMZ5 file format. Here, the KMZ file is
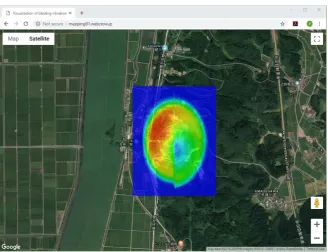
composed of a main KML file and possibly some support files, which are pack-aged as a Zip file. A folder named KMZ was created in the same hierarchy as the index.html file for the purpose of editing the Web area, and KMZ file is then saved in that folder. Finally, a program that calls the basic map from the Google map was written in HTML language in the index.html file as well as a program to read the KMZ file from the KMZ folder. As a result, contours can be overlaid on the basic map, and so the ground vibration prediction visualization can now be seen on the website, as shown in Figure 12. This figure is a system example that was visualized a predicted vibration under a particular condition. Also, URL
[image:11.595.258.490.299.501.2]DOI: 10.4236/jgis.2019.111002 28 Journal of Geographic Information System
Figure 12. Screen shot of predictive vibration visualization system using Web-GIS (URL: http://mapping01.webcrow.jp/).
of website attached to figure title. Contour shape has been transformed by over-laying contours created with GIS on the website. This is considered to be caused by the fact that the spatial reference system of GIS and Google Maps is different and the coordinates are shifted. Here, it is shown that the difference in vibration level due to the change of blasting conditions taking a residential house around the Mikurahana quarry site as an example. The contour blasting condition of
Figure 11 is MIC 24.8 kg, distance 16.6 m - 830.1 m, difference of elevation 23
m, direction 0˚ - 180˚. The distance indicates the distance from the blasting point to the predicted point. The direction indicates the deviation of the direc-tion of the predicted point when the perpendicular of the normal plane is taken as 0 degrees when viewed from the blasting point. Only the value of MIC was changed to compare the vibration level transmitted to the residential house. It is possible to change MIC by changing the number of blast holes and the detona-tion interval of blast holes. The condidetona-tions for MIC of 22 kg and 20 kg were tak-en. Screenshots of making contour under each blasting condition and enlarging a specific residential house as a comparison object is shown in Figure 13.
DOI: 10.4236/jgis.2019.111002 29 Journal of Geographic Information System
Figure 13. Enlarged view of the target residential house under each blasting condition and legend of color contours.
5. Conclusion
In resource extraction sites, especially urban quarries, blasting is carried out on a regular basis. Residents around urban quarry sites are routinely affected by ground vibration induced by blasting. In this study, a prediction and visualiza-tion system for ground vibravisualiza-tion induced by blasting is developed for the pur-pose of reducing this adverse effect of blasting. As mentioned before, anyone with access to a browser and an internet connection can view the visualization of the predicted ground vibration. The Mikurahana quarry site and the adjacent areas are visible through the contour background so that the residents around the quarry site can know how strong ground vibration is predicted to be in their location from the contour color at a glance. Due to its implementation using Google Maps albeit with some limitations, it is possible to zoom in on the map and verify locations. This piece of information may possibly be used to alleviate worries the surrounding residents may have from the ground vibration induced by the blasting of urban quarry site. As mentioned in Chapter 4, the employees can check the predicted vibration level and correct the blast design. With this, they can maximize the efficiency while minimizing the ground vibration on res-idential areas. Furthermore, it is possible that this system is announced a piece of blasting information to the surrounding residents in advance. Therefore, the possibility that the mental stress that the surrounding residents receive can be reduced is increased. It is a system that may be widely used not only for visuali-zation of ground vibrations induced by blasting of resource extraction sites but also for research in other fields.
Conflicts of Interest
The authors declare no conflicts of interest regarding the publication of this pa-per.
References
[1] Klæboea, R., Amundsen, A.H., Madshus, C., Norén-Cosgriff, K.M. and Turu-nen-Rindel, I. (2016) Human Reaction to Vibrations from Blasting Activi-ty—Norwegian Exposure-Effect Relationships. Applied Acoustics, 111, 49-57. https://doi.org/10.1016/j.apacoust.2016.03.021
https://www.sciencedirect.com/science/article/pii/S0003682X16300548
DOI: 10.4236/jgis.2019.111002 30 Journal of Geographic Information System Ground Vibration Equations for Rocks Using Mechanical and Geological Proper-ties. Journal of Rock Mechanics and Geotechnical Engineering, 8, 341-349. https://www.sciencedirect.com/science/article/pii/S167477551600024X
[3] Mesec, J., Kovac, I. and Soldo, B. (2010) Estimation of Particle Velocity Based on Blast Event Measurements at Different Rock Units. Soil Dynamics and Earthquake Engineering, 30, 1004-1009. https://doi.org/10.1016/j.soildyn.2010.04.011
https://www.sciencedirect.com/science/article/pii/S0267726110000904
[4] Fouladgar, N. and Hasanipanah, M. (2017) Application of Cuckoo Search Algo-rithm to Estimate Peak Particle Velocity in Mine Blasting. Engineering with Com-puters, 33, 181-189. https://link.springer.com/article/10.1007/s00366-016-0463-0 [5] Monjezi, M., Ghafurikalajahi, M. and Baharami, A. (2011) Prediction of
Blast-Induced Ground Vibration Using Artificial Neural Networks. Tunnelling and Underground Space Technology, 26, 46-50.
https://doi.org/10.1016/j.tust.2010.05.002
https://www.sciencedirect.com/science/article/pii/S0886779810000799
[6] Moriyama, Y. and Kawamura, Y. (2017) Proposal of Ground Vibration Induced by Blasting Mapping Technology in Urban Quarry Site Using Web-GIS. MMIJ & EARTH 2017, PY2-86.
[7] Moriyama, Y. and Kawamura, Y. (2018) Visualization System of Blasting Induced Ground Vibration in an Urban Quarry Using ANN and Web-GIS. MMIJ 2018, 3601-05-04.
[8] Wang, Y.Q. (2014) MeteoInfo: GIS Software for Meteorological Data Visualization and Analysis. Meteorological Applications, 21, 360-368.
https://doi.org/10.1002/met.1345
https://rmets.onlinelibrary.wiley.com/doi/full/10.1002/met.1345
[9] Hashemi, M. and Alesheikh, A.A. (2013) GIS: Agent-Based Modeling and Evalua-tion of an Earthquake-Stricken Area with a Case Study in Tehran, Iran. Natural Hazards, 69, 1895-1917.
https://link.springer.com/article/10.1007/s11069-013-0784-x
[10] Leh, M., Bajwa, S. and Chaubey, I. (2013) Impact of Land Use Change on Erosion risk: An Integrated Remote Sensing, Geographic Information System and Modeling.
Land Degradation & Development, 24, 409-421. https://doi.org/10.1002/ldr.1137 https://onlinelibrary.wiley.com/doi/full/10.1002/ldr.1137
[11] Gu, Q.H., Lu, C.W., Guo, J.P. and Jing, S.G. (2010) Dynamic Management System of Ore Blending in an Open Pit Mine Based on GIS/GPS/GPRS. Mining Science and Technology, 20, 132-137.
https://www.sciencedirect.com/science/article/pii/S1674526409601745
[12] Choi, Y. and Nieto, A. (2011) Optimal Haulage Routing of Off-Road Dump Trucks in Construction and Mining Sites Using Google Earth and a Modified Least-Cost Path Algorithm. Automation in Construction, 20, 982-997.
https://doi.org/10.1016/j.autcon.2011.03.015
https://www.sciencedirect.com/science/article/pii/S0926580511000422
[13] Khandelwal, M. and Singh, T.N. (2009) Prediction of Blast-Induced Ground Vibra-tion Using Artificial Neural Network. International Journal of Rock Mechanics and Mining Sciences, 46, 1214-1222. https://doi.org/10.1016/j.ijrmms.2009.03.004 https://www.sciencedirect.com/science/article/pii/S1365160909000574
DOI: 10.4236/jgis.2019.111002 31 Journal of Geographic Information System https://www.sciencedirect.com/science/article/pii/S1365160911000670
[15] Khandelwal, M. and Singh, T.N. (2006) Prediction of Blast Induced Ground Vibra-tions and Frequency in Opencast Mine: A Neural Network Approach. Journal of Sound and Vibration, 289, 711-725. https://doi.org/10.1016/j.jsv.2005.02.044 https://www.sciencedirect.com/science/article/pii/S0022460X05001823
[16] Saadat, M., Khandelwal, M. and Monjezi, M. (2014) An ANN-Based Approach to Predict Blast-Induced Ground Vibration of Gol-E-Gohar Iron Ore Mine, Iran.
Journal of Rock Mechanics and Geotechnical Engineering, 6, 67-76. https://doi.org/10.1016/j.jrmge.2013.11.001
https://www.sciencedirect.com/science/article/pii/S1674775513001157
[17] Mohamed, M.T. (2011) Performance of Fuzzy Logic and Artificial Neural Network in Prediction of Ground and Air Vibrations. International Journal of Rock Me-chanics and Mining Sciences, 48, 845-851.