BINARY LOGISTIC REGRESSION ANALYSIS ON ADDMITING STUDENTS USING JAMB SCORE
*Kabiru Tukur and
Jodhpur National University, Narnadi, Jhanwar Road,
ARTICLE INFO ABSTRACT
This research work was carried out using the record of applicants whose apply for admission into Kano University of Science and Technology, Wudil. The researcher apply the Binary logistic regression analysis technique to form a model that will be fit for t
significance of the two independent variables that is Gender and Jamb scores of the students on the dichotomous dependent variable (admitted/not admitted) for the student. And the analysis indicated that the gender is no
0.05 while jamb score is significance in the predicting the dependent variable because it’s p less than 0.05 and by looking at the goodness of fit I found out that
not 0.05 and at least one of the independent variable (jamb score) is significant.
Copyright © 2016 Kabiru Tukur and Abdullahi Ubale Usman
permits unrestricted use, distribution, and reproduction in any medium, provided the original work is properly cited.
INTRODUCTION
Many research problem calls for the analysis and prediction of a dichotomous outcome whether a student will succeed in college, whether a child should be classified as learning disable, whether a teenager is prone to engage in risky behaviour, and so on. Traditionally, these research questions were addressed by either ordinary least squares (OLS) regression or linear discriminate function analysis. Both techniques were subsequently found to be less than ideal for handling dichotomous outcomes due to their s
assumption that is linearity, normality, and continuity for OLS regression and multivariate normality with equal variances and covariance for discriminate analysis. Generally, logistic regression is well suited for describing and testing hypotheses about relationships between a categorical outcome variable and one or more categorical or continuous predictor variables. In the simplest case of linear regression for one
predictor or Independent variable 1 (student’s Jamb Score),
one categorical predictor or Independent variable
a student) and one dichotomous outcome or Dependent variable (the student being recommended for admission into university or not), the plot of such data results in two parallel
*Corresponding author: Kabiru Tukur
Jodhpur National University, Narnadi, Jhanwar Road, Boranada, Rajasthan, India.
ISSN: 0975-833X
Article History:
Received 25th October, 2015
Received in revised form
28th November, 2015
Accepted 18th December, 2015
Published online 31st January,2016
Key words: Jamb score, Gender, Recommendation, Logistic regression, Likelihood ratio, Log likelihood.
Citation: Kabiru Tukur and Abdullahi Ubale Usman
Journal of Current Research, 8, (01), 25235-25239.
RESEARCH ARTICLE
BINARY LOGISTIC REGRESSION ANALYSIS ON ADDMITING STUDENTS USING JAMB SCORE
Kabiru Tukur and Abdullahi Ubale Usman
Jodhpur National University, Narnadi, Jhanwar Road, Boranada, Rajasthan, India
ABSTRACT
This research work was carried out using the record of applicants whose apply for admission into Kano University of Science and Technology, Wudil. The researcher apply the Binary logistic regression analysis technique to form a model that will be fit for t
significance of the two independent variables that is Gender and Jamb scores of the students on the dichotomous dependent variable (admitted/not admitted) for the student. And the analysis indicated that the gender is not significance in predicting the dependent variable as its p
0.05 while jamb score is significance in the predicting the dependent variable because it’s p less than 0.05 and by looking at the goodness of fit I found out that
not 0.05 and at least one of the independent variable (jamb score) is significant.
Kabiru Tukur and Abdullahi Ubale Usman. This is an open access article distributed under the Creative Commons Att use, distribution, and reproduction in any medium, provided the original work is properly cited.
Many research problem calls for the analysis and prediction of a dichotomous outcome whether a student will succeed in college, whether a child should be classified as learning disable, whether a teenager is prone to engage in risky raditionally, these research questions were addressed by either ordinary least squares (OLS) regression or linear discriminate function analysis. Both techniques were subsequently found to be less than ideal for handling dichotomous outcomes due to their strict statistical assumption that is linearity, normality, and continuity for OLS regression and multivariate normality with equal variances and Generally, logistic regression is well suited for describing and testing hypotheses about relationships between a categorical outcome variable and one or more categorical or continuous predictor variables. In the simplest case of linear regression for one continuous (student’s Jamb Score),
one categorical predictor or Independent variable 2 (Gender of
a student) and one dichotomous outcome or Dependent variable (the student being recommended for admission into
ersity or not), the plot of such data results in two parallel
Jodhpur National University, Narnadi, Jhanwar Road, Boranada,
lines, each corresponding to a value of the dichotomous outcome or dependent variable. Logistic regression is less restrictive than ordinary sum of squares regression. It does not require normally distributed dependent data or homogeneity of variance. Prediction made by ordinary sum of square regression are based on the observed changes in the independent data itself. Logistic regression is based on the log of the odds of a particular event occurring with a given set of observations. Logistic regression’s underlying principles are based on probabilities and the nature of the log curve.
The only assumptions of logistic regression are that the resulting logit transformation is linear, the dependent variable is dichotomous and that the resultant logarithmic curve
not include outliers (Peng and So, 2002b
techniques are appropriate when dummy variables are required during analysis. Logistic regression was proposed as an alternative in the late 1960s and early 1970s (
and it became routinely available in statistical packages in the early 1980s. Since that time, the use of logistic regression has increased in the social sciences
Weisz, 1995) and in educational research education (Austin et al., 1992)
2002a) and (Peng et al., 2002
sophisticated statistical software for high
use of logistic regression is increasing. This expanded use
International Journal of Current Research
Vol. 8, Issue, 01, pp.25235-25239, January, 2016
INTERNATIONAL
Kabiru Tukur and Abdullahi Ubale Usman, 2016. “Binary logistic regression analysis on addmiting students using jamb score
BINARY LOGISTIC REGRESSION ANALYSIS ON ADDMITING STUDENTS USING JAMB SCORE
Boranada, Rajasthan, India
This research work was carried out using the record of applicants whose apply for admission into Kano University of Science and Technology, Wudil. The researcher apply the Binary logistic regression analysis technique to form a model that will be fit for the data and to know if there is any significance of the two independent variables that is Gender and Jamb scores of the students on the dichotomous dependent variable (admitted/not admitted) for the student. And the analysis indicated t significance in predicting the dependent variable as its p-value is greater than 0.05 while jamb score is significance in the predicting the dependent variable because it’s p-value is less than 0.05 and by looking at the goodness of fit I found out that the model is fit since the value is not 0.05 and at least one of the independent variable (jamb score) is significant.
article distributed under the Creative Commons Attribution License, which
, each corresponding to a value of the dichotomous outcome or dependent variable. Logistic regression is less restrictive than ordinary sum of squares regression. It does not require normally distributed dependent data or homogeneity of n made by ordinary sum of square regression are based on the observed changes in the independent data itself. Logistic regression is based on the log of the odds of a particular event occurring with a given set of observations. ying principles are based on probabilities and the nature of the log curve.
The only assumptions of logistic regression are that the resulting logit transformation is linear, the dependent variable is dichotomous and that the resultant logarithmic curve does
Peng and So, 2002b). Logistics regression techniques are appropriate when dummy variables are required during analysis. Logistic regression was proposed as an the late 1960s and early 1970s (Cabrera, 1994), and it became routinely available in statistical packages in the early 1980s. Since that time, the use of logistic regression has increased in the social sciences (Chuang, 1997), (Tolman and
and in educational research especially in higher ), (Cabrera, 1994; Peng and So, 2002). With the wide availability of sophisticated statistical software for high-speed computers, the use of logistic regression is increasing. This expanded use
INTERNATIONAL JOURNAL OF CURRENT RESEARCH
demands that researchers, editors, and readers be attuned to what to expect in an article that uses logistic regression techniques. What tables, figures, or charts should be included to comprehensibly assess the results? What assumptions should be verified? In this article, we address these questions with an illustration of logistic regression applied to a data set in testing a research hypothesis.
1.Therefore in this article titled ‘Binary logistic regression analysis on admitting students using jamb score’’ A legitimate research hypothesis posed to the data was that “the likelihood that the prospective candidate seeking for admission into university or any tertiary institution in Nigeria is recommended to be admitted or not is related to both his/her jamb score and gender.” Thus, the outcome variable was students being recommended for admitted or not (1 = yes or admitted, 0 = no or not admitted), and the two predictors were students’ jamb score on a standardized test ( 1 = the score variable) and
gender ( 2 = gender). The gender predictor was coded as 1 =
boy and 0 = girl. Joint Admissions and Matriculation Board (JAMB) was established as an agency charged with the dual responsibility of testing and placement of suitably qualified candidates into the Nation’s tertiary institutions viz; Universities, Polytechnics and College of Education as a response to the problems of multiple applications, multiple admissions as well as the absence of standardization and lack of uniformity in admission guidelines which beset tertiary
institutions before 1978 (Guidelines for Admissions into
Nigerian Universities, 2007/2008; Guidelines for Admissions into Monotechnics, Polytechnics and Colleges of Education, 2007/2008). Government also ensure a commensurate increase in the number of vacancies available in the tertiary institutions
to cater for qualified applicants. This will reduce the problem
of scarcity and remove the ‘do or die’ syndrome from the educational system. Through the establishment of the Joint Admissions and Matriculation Board (JAMB), and the policies put in place to guide its operations, the Federal Government of Nigeria has been able to ensure a near even representation of the various parts for the country in the Nation’s Tertiary Institutions. Despite its shortcomings, the Board has continued
to play a positive role as a unifying the Nation(JAMB Annual
Reports, 2000).
Study Question
Once the logistic regression model is estimated there are 3 primary considerations for diagnostic analysis:
How well does the model predict outcome? Does a
relationship exist between the independent variables as a group and dependent variable such that the independent variables within a given level of confidence actually predict the outcome and that outcome is not random chance?
If the model works well, what is the relative predictive strength of each independent variable?
Are the assumptions of the model completely satisfied
Objectives of the study
To develop a logistic regression model
To predict the category of dependent variable using the
candidates jamb score and his/her gender
To determine the significance of the independent variables
using either the Wald statistic or the likelihood ratio test.
Hypotheses of the study
Ho: When all the coefficients in the regression equation take the value 0
Ha: the model with predictors currently under consideration is accurate and differ significantly from the null of 0
Assumptions
1. There is no linear relationship between dependent and
independent variables
2. Dependent variable must be dichotomous
3. The independent variables need not be interval nor
normally distributed or linearly related of equal variance within a group
4. The category for dependent variable must be mutually
exclusive and exhausted
5. It is involved a large sample because maximum likelihood
coefficients are large sample estimate
Data collection
Base on our assumptions and objectives a sample jamb scores for 150 candidate seeking for admission in Kano university of Science and Technology for the year 2014 is collected and
used. Therefore the data is secondary data with
recommendation (admitted or not admitted) as dependent variable and jamb score and gender as two independent variables
MATERIALS AND METHODS
Logistic regression model
As with any research the study objectives must first be defined. The researcher should then establish the best research design to address the objective. After stating all assumptions, the researcher should estimate the logistic regression model using the logit transformation and assess oveall model fit and predictive accuracy. The result should then be interpreted and validated. Once the logistic regression model is estimated there are three (3) primary considerations for diagnostic analysis:
How well does the model predict outcome, Does a
relationship exist between the independent variables as a group and dependent variable such that the independent variable within a given level of confidence actually predict the outcome and that outcome is not random chance?
If the model works well, what is the relative predictive strength of each independent variable?
Are the assumptions of the model completely satisfied?
The intent of this paper is to present a practical overview of logistic regression techniques and considerations
Generation of logistic regression model
independent variables. The basic logistic regression analysis begins with logit transformation of the dependent variable through utilisation of maximum likelihood estimation. This is done using the odd ratio.
The odds ratio can be described as
( ) = [ ] = ⋯
Where is the probability of an event ,
+ 1 1 + ⋯ + represents the regression model. It represent all event probabilities relationships and their exponential nature. The odds ratio has numerous advantageous properties, it is clearly portrays the increased or decreased likelihood of an event outcome occurrence. If the odds ratio is less than one then we can say that there is decreased likelihood of an event occurring and if the odds ratio is greater than one then there will be an increased likelihood of the event occurring. The odd ratio provides an intuitive foundation for any sensitivity analysis of interest between the dependent and independent variables. The odds ratio is on the probabilities that a specific binary outcome will occur when using particular model estimation. It is converted to a continuous function through the logit transformation.
For each data point, logit i is represented by
( ) = [ ]
The maximum likelihood estimate (MLE) is now used to
estimate the coefficients ( , 1, 2, … ) from the logit
transformation. MLE is similar to the ordinary least squares used in multiple regression analysis, the likelihood is the probability that the observed values of the dependent variable will be predicted by the observed independent data. The log likelihood (LL) is the log of that likelihood and is in the range of infinity to negative infinity, the logistic curve simplifies the coefficient estimation.
The maximum likelihood estimate seeks to maximize the log likelihood (LL) value and estimate the coefficient found at that maximum point. It is determined through an iterative process that is normally handled by computer software such as MINITAB, SAS, SPSS e.t.c. one point worth mentioning is that MLE is extremely accurate for large sample size, since the log likelihood (LL) is the log probability that the dependent variables will be predicted by the observed independent variables, we should seek to maximize tha probability.
[image:3.595.324.534.82.763.2]The coefficient estimate where the log likelihood maximized will represent the best probability that the observed dependent variable is predicted by the observed independent variables. At this juncture MINITAB or some other statistical packages can be used to compute the log likelihood and logit transformation to estimate the coefficients for the initial model. This article will now address logistic regression analysis to validate the proposed model derived through the logit transformation.
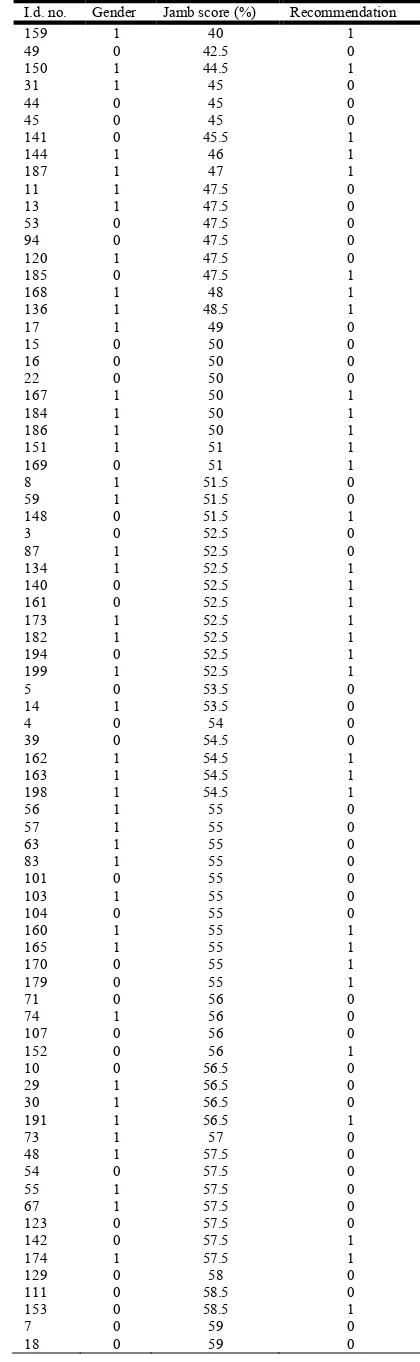
Table Containing record of student’s i.d. No., jamb scores, gender and recommendation
I.d. no. Gender Jamb score (%) Recommendation
159 1 40 1
49 0 42.5 0
150 1 44.5 1
31 1 45 0
44 0 45 0
45 0 45 0
141 0 45.5 1
144 1 46 1
187 1 47 1
11 1 47.5 0
13 1 47.5 0
53 0 47.5 0
94 0 47.5 0
120 1 47.5 0
185 0 47.5 1
168 1 48 1
136 1 48.5 1
17 1 49 0
15 0 50 0
16 0 50 0
22 0 50 0
167 1 50 1
184 1 50 1
186 1 50 1
151 1 51 1
169 0 51 1
8 1 51.5 0
59 1 51.5 0
148 0 51.5 1
3 0 52.5 0
87 1 52.5 0
134 1 52.5 1
140 0 52.5 1
161 0 52.5 1
173 1 52.5 1
182 1 52.5 1
194 0 52.5 1
199 1 52.5 1
5 0 53.5 0
14 1 53.5 0
4 0 54 0
39 0 54.5 0
162 1 54.5 1
163 1 54.5 1
198 1 54.5 1
56 1 55 0
57 1 55 0
63 1 55 0
83 1 55 0
101 0 55 0
103 1 55 0
104 0 55 0
160 1 55 1
165 1 55 1
170 0 55 1
179 0 55 1
71 0 56 0
74 1 56 0
107 0 56 0
152 0 56 1
10 0 56.5 0
29 1 56.5 0
30 1 56.5 0
191 1 56.5 1
73 1 57 0
48 1 57.5 0
54 0 57.5 0
55 1 57.5 0
67 1 57.5 0
123 0 57.5 0
142 0 57.5 1
174 1 57.5 1
129 0 58 0
111 0 58.5 0
153 0 58.5 1
7 0 59 0
60 1 59.5 0
61 1 59.5 0
62 1 59.5 0
19 1 60 0
20 0 60 0
24 1 60 0
50 1 60 0
86 1 60 0
105 1 60 0
109 0 60 0
118 1 60 0
119 0 60 0
126 0 60 0
128 0 60 0
131 1 60 1
156 1 60 1
166 0 60 1
175 1 60 1
178 0 60 1
180 1 60 1
193 0 60 1
21 1 60.5 0
32 0 60.5 0
79 1 60.5 0
26 0 61 0
172 1 61 1
9 0 61.5 0
85 1 61.5 0
130 0 61.5 0
6 1 62.0 0
37 0 62 0
34 0 62.5 0
90 0 62.5 0
149 1 62.5 1
84 1 63.5 0
51 0 64 0
137 1 64 1
124 0 64.5 0
42 0 65 0
52 1 65 0
88 0 65 0
110 1 65 0
115 0 65 0
117 0 65 0
125 0 65 0
132 0 65 1
143 1 65 1
155 0 65 1
157 1 65 1
158 0 65 1
177 0 65 1
189 0 65 1
192 0 65 1
81 0 65.5 0
46 0 66 0
47 0 66 0
138 1 66 1
65 1 66.5 0
91 0 66.5 0
78 0 67 0
113 0 67 0
75 0 67.5 0
92 1 67.5 0
95 0 67.5 0
96 0 67.5 0
114 0 67.5 0
116 1 67.5 0
100 0 68.5 0
36 0 69 0
154 0 69 1
35 1 70 0
64 0 70 1
77 0 70 0
Analysis
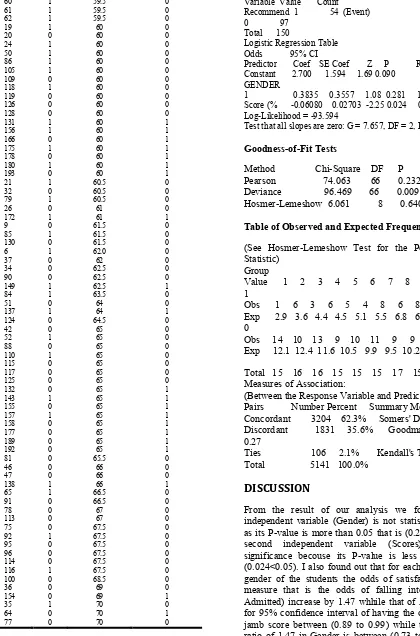
Binary Logistic Regression: RECOMENDATION versus GENDER, Score (%)
Link Function: Logit Response Information
Variable Value Count Recommend 1 54 (Event) 0 97
Total 150
Logistic Regression Table Odds 95% CI
Predictor Coef SE Coef Z P Ratio Lower Upper Constant 2.700 1.594 1.69 0.090
GENDER
1 0.3835 0.3557 1.08 0.281 1.47 0.73 2.95 Score (% -0.06080 0.02703 -2.25 0.024 0.94 0.89 0.99 Log-Likelihood = -93.594
Test that all slopes are zero: G = 7.657, DF = 2, P-Value = 0.022
Goodness-of-Fit Tests
[image:4.595.62.482.57.693.2]Method Chi-Square DF P Pearson 74.063 66 0.232 Deviance 96.469 66 0.009 Hosmer-Lemeshow 6.061 8 0.640
Table of Observed and Expected Frequencies:
(See Hosmer-Lemeshow Test for the Pearson Chi-Square Statistic)
Group
Value 1 2 3 4 5 6 7 8 9 10 Total 1
Obs 1 6 3 6 5 4 8 6 8 6 53 Exp 2.9 3.6 4.4 4.5 5.1 5.5 6.8 6.6 7.4 6.2 0
Obs 14 10 13 9 10 11 9 9 7 5 97 Exp 12.1 12.4 11.6 10.5 9.9 9.5 10.2 8.4 7.6 4.8
Total 15 16 16 15 15 15 17 15 15 11 150 Measures of Association:
(Between the Response Variable and Predicted Probabilities) Pairs Number Percent Summary Measures
Concordant 3204 62.3% Somers' D 0.27 Discordant 1831 35.6% Goodman-Kruskal Gamma 0.27
Ties 106 2.1% Kendall's Tau-a 0.12 Total 5141 100.0%
DISCUSSION
From the result of our analysis we found out that the independent variable (Gender) is not statistically significance as its P-value is more than 0.05 that is (0.281>0.05) while the
second independent variable (Scores) is statistically
Conclusion
This project has presented an overview of the logistic regression analysis methods, its primary guiding principles and a research study that utilizes a few of the techniques. The study presented a reasonable overview of logistic regression methods using the dichotomous mutually exclusive and exhausted outcomes, the two outcomes are whether the students applied for an admission into kano University of science and technology is admitted or not using his/her Jamb result. Therefore we can conclude that logistic regression is the best for analysis of categorical dependent variable so that the predicted outcomes is not the values but it is the probability that it falls into one or the other category of dependent variable. logistic regression is an excellent tool for a researcher who is attempting to utilize independent data (continuous, interval or dichotomous) in practical situations requiring a dichotomous dependent variable to appropriately predict the results.
REFERENCES
Austin, J. T., Yaffee, R.A. and Hinkle, D.E. 1992. Logistic Regression for research in higher education.
Cabrera, A. F. 1994. Logistic regression analysis in higher education: An applied perspective
Chuang, H. L. 1997. High school youth’s dropout and re-enrollment behavior. Economics of Education Review Tolman, R. M. and Weisz, A. 1995. Coordinated community
intervention for domestic violence: The effects of arrest and prosecution on recidivismof woman abuse perpetrators.
Crime and Delinquency, 41(4), 481–495.
Peng, C. Y. and So, T. S. H. 2002a. Modeling strategies in logistic regression. Journal of Modern Applied Statistical
Methods,
Peng, C. Y. and So, T. S. H. 2002b. Logistic regression analysis and reporting: A primer. Understanding Statistics, Peng, C. Y., So, T. S., Stage, F. K. and St. John, E. P. 2002.
The use and nterpretation of logistic regression in higher education journals: 1988–1999. Research in Higher Education, 43, 259–293.
Guidelines for Admissions into Nigerian Universities, 2007/2008
Guidelines for Admissions into Monotechnics, Polytechnics and Colleges of Education, 2007/2008
JAMB Annual Reports, 2000