J. Range Manage.
56: 375-381 July 2003
Defoliation impacts on Festuca campestris (Rydb.) plants exposed to wildfire
AMANDA D. BOGENI, EDWARD W. BORK, AND WALTER D. WILLMS
Authors are Rangeland Ecologist, Box 484, Consort, Alberta, Canada TOG J BO; Assistant Professor, Dept. of Agr., Food and Nutr. Sci., University of Alberta, Edmonton, Alberta, Canada T6G 2P5 and Range Scientist, Agr, and Agr. Food Canada, P. 0. Box 3000, Lethbridge, Alberta, Canada Tl J 4B1. At the time of the research, the senior author was a Research Assistant, Dept, of Agr., Food and Nutr. Sci., University of Alberta.
Abstract
Wildfires commonly occur in the Fescue Prairie of Alberta, but little information exists to provide a basis for making grazing recommendations after burning. A wildfire in April 1999 provid- ed an opportunity to study the effect of season and intensity of post-burn defoliation on foothills rough fescue (F. campestris Rydb.) in southwestern Alberta. A 3 (date of defoliation) x 2 (defoliation intensity) factorial experiment with 10 replicates (plants) was established in both a burned and a non-burned grassland and analyzed as a nested design. Plants were defoliated once during active vegetative growth (17 May), inflorescence development (2 July), or dormancy (30 September), at either 5 or 15-cm clipped stubble heights in the first growing season after fire. Burning increased tiller numbers by 54% compared to non- burned plants but reduced plant ANPP by 51 % in the second growing season. While a single defoliation of burned plants, par- ticularly early in the year, had little effect on growth, delaying defoliation into July decreased tillers 1 year later. Increasing defoliation intensity had the greatest impact on non-burned plants, reducing plant height (15%) as well as tiller (21 %) and plant (32%) ANPP in the second year. May defoliation reduced etiolated growth 1 year later regardless of burn treatment. A sin- gle grazing event after wildfire does not necessarily appear to detrimentally affect rough fescue; however, the low herbage available immediately after fire may not justify the increased
risk to the plant with subsequent grazing.
Key Words: defoliation intensity, deferment, etiolated growth, herbage yield, resilience, tillers
The Fescue Prairie of the Northern Great Plains is characterized by the occurrence of plains rough fescue [Festuca hallii (Vasey) Piper] and foothills rough fescue (F. campestris Rydb) in the prairie-parkland and foothill regions, respectively. Plains rough fescue is shorter than foothills rough fescue and produces short rhizomes compared with the strongly tufted habit of the latter (Pavlick and Looman 1984). Most fire ecology studies in the Fescue Prairie have been conducted in the Parkland (Bailey and Anderson 1978, Anderson and Bailey 1980, Redmann et al. 1993, Gerling et al. 1995). Although the foothills species of rough fes-
The authors would like to thank the Alberta Cattle Commission and the Range Management Post-Graduate Endowment Fund at the University of Alberta for funding this research. Special thanks are extended to Albert Middleton and Ryan Beck for their assistance with fieldwork, as well as Dr. Peter Blenis for statistical advice. The authors are also grateful to George Powell and 2 anonymous review- ers, who provided helpful comments on an earlier version of the manuscript.
Manuscript accepted 26 Aug. 02.
Resumen
Comunmente ocurren fuegos naturales en las praderas de
"Fescue" de Alberta, pero existe poca information en que basar las recomendaciones de apacentamiento despues del fuego. Un fuego natural que ocurrio en Abril de 1999 brindo la oportu- nidad para estudiar el efecto de la epoca a intensidad de defo- liacion despues del fuego en una pradera de "Foothills rough fes- cue" (F. campestris Rydb.) del sudeste de Alberta. Un experimen- to factorial 3 (fecha de defoliacion) x 2 (intensidad de defo- liacion) con 10 repeticiones (plantas) se establecio en porciones de pastizal quemado y no quemado y se analizo como un diseno anidado. Las plantas fueron defoliadas una vez en las etapas de crecimiento vegetativo activo (17 de Mayo), desarrollo de la inflorescencia (2 de Julio) o dormancia (30 de Septiembre), la defoliacion se efectuo a dos alturas del rastrojo, 5 o 15 cm, y se llevo a cabo en la primer estacion de crecimiento despues del fuego. El fuego aumento el numero de hijuelos en 54% en com- paracion con las plantas no quemadas, pero redujo la ANNP de las plantas en 51% en la segunda estacion de crecimiento.
Mientras que una sola defoliacion de las plantas quemadas, par- ticularmente a inicio del ano, tuvo poco efecto en el crecimiento, retasando la defoliacion pasta Julio disminuyo el ahijamiento en el ano siguiente. El aumento en la intensidad de defoliacion tuvo el mayor impacto en las plantas no quemadas, reduciendo en el segundo ano la altura de la plants (15%), el ahijamiento (21%) y la ANPP de la planta (32%). La defoliacion en Mayo redujo el crecimiento etiolado al ano siguiente, sin importar el tratamiento de quema. Un solo evento de apacentamiento despues de un fuego natural no necesariamente parece tener un efecto detri- mental en el "Rough fescue"; sin embargo, el poco forraje
disponible inmediatamente despues del fuego, puede no justificar el aumento en riesgo para la planta que se corre con el apacen- tamiento subsecuente.
cue might be expected to have a similar response to fire, this premise remains untested.
Rough fescue loses vigor when grazed during the growing sea- son (Looman 1969). Burning may reduce rough fescue abun- dance (Bailey and Anderson 1978, Antos et al. 1983) and produc- tivity (Jourdonais and Bedunah 1990, Gerling et al. 1995). While considerable research has addressed the effects of grazing on Fescue Prairie (Barker and Erickson 1971, Wright 1974, Willms et al. 1985), no information is available on the cumulative effects of grazing following wildfire on foothills rough fescue plants.
Previous research has shown that grazing can affect the subse- quent recovery of native bunchgrasses such as Idaho fescue (F.
idahoensis Elmer) and bluebunch wheatgrass [Pseudoroegneria spicata (Pursh) A. Love subsp. Spicata] after wildfire (Bunting et
JOURNAL OF RANGE MANAGEMENT 56(4) July 2003 375
al. 1998). Recent increases in wildfire occurrence in the Fescue Prairie (Bork et al. 2002) indicate information specific to foothills rough fescue is needed to develop appropriate guidelines for grazing follow- ing fire.
In April 1999, a small wildfire in the Foothills region of Alberta provided an opportunity to study the effects of defolia- tion following burning on foothills rough fescue plants. The study was specifically designed to evaluate the resilience of plants subjected to variation in the season and intensity of defoliation over a 2 year period.
Materials and Methods Site Description
The study was conducted in southwest- em Alberta (50°11'30" N, 113°53'30" W;
1,366 m above sea level) within the Fescue Prairie ecoregion on the eastern slopes of the Porcupine Hills (Strong and Leggat 1992). The area was lightly grazed from 1949 until 1982 when it was fenced to exclude livestock. The plant communi- ty was a foothills rough fescue-Parry oat grass (Danthonia parryi Scribn.) type indicative of the modal range for the region (Wroe 1972, Strong and Leggat
1992).
The regional landform is rolling moraine upland. The local range site had a slope of approximately 8% with a southerly aspect and is well-drained on loamy parent mate- rial. Soils on the site have been classified as Orthic Black Chernozems (Udic Haploboral) developed on till over-lying sandstone (Dormaar and Willms 1990).
The climate is dry subhumid with a mean annual precipitation of 444 mm (Table 1).
In 1999 and 2000, annual precipitation was 399 and 264 mm, respectively.
Growing season (April-August) precipita- tion during those same years was 123%
(351 mm) and 60% (171 mm), respective- ly, of the long-term mean.
Wildfire Description
The study site was burned by a 1-ha wildfire around 2 pm on 7 April 1999. The average daily wind speed on the day of the fire was 30 km hour' (AAFC, unpublished climate data) and air temperatures aver- aged 6.7° C with a low of 0.9° C and a high of 13 ° C. Relative humidity in the morning was 50%, dropping to 30% at the time of the fire. The litter fuel load in the area was assessed at 6,372 kg ha' in 1999
(AAFRD-Public Lands Division, unpub- lished data). The fire occurred immediate- ly following snowmelt but before the initi- ation of plant growth. Although only a small area was burned, the fire was intense and inflicted considerable visible damage (e.g., pitting) to rough fescue tussocks.
Although this study involved a single burn and is therefore unreplicated, vari- ability in fuel loading and microclimatic conditions at the ground surface typically results in variable treatment exposure among individual plants, which was con- sidered the experimental unit in this inves- tigation. Immediate containment of the fire on the windward side ensured that rough fescue plants sampled on either side of the fire boundary were on the same range site.
Methodology
The effects of defoliation intensity fol- lowing burning were evaluated in a 3 (sea- son of defoliation) x 2 (defoliation intensi- ty) factorial experiment using 10 replicates (plants) of each treatment combination within each of the burned and non-burned areas. Rough fescue plants (N =120) hav- ing a diameter of 15 to 20 cm near the base were randomly selected from within the burned and adjacent non-burned areas
following the fire and permanently
marked.
Defoliation dates were 17 May (active vegetative growth), 2 July (inflorescence development), or 30 September (dormant).
Defoliation intensities were 5 and 15-cm clipped stubble heights. All defoliation treatments were imposed only during
1999, the first growing season following fire, by clipping to the prescribed height.
Harvested phytomass was oven-dried and weighed to determine defoliation intensity.
An additional 10 plants were randomly selected in each of the burned and non- burned areas for measurement to serve as a check. These plants were added for qual- itative comparisons only and were not part of the main design.
In spring 2000, 2 of 10 plants from each treatment were assessed for etiolated growth. Prior to spring green-up, all stand- ing dead plant material was removed to a 5-cm stubble height. Cones were then placed over these plants down to soil around the outside base to exclude light and all etiolated growth clipped bi-weekly to ground level commencing 2 May until growth ceased. All harvested material was oven-dried and weighed.
Tiller counts were made on all plants in September 1999 at the time of the final defoliation treatments. These counts were subsequently repeated on all non-etiolated plants in the third week of May, second week of July, and last week of September 2000, in order to assess the residual treat- ment effects of burning and defoliation on tiller demography throughout the following growing season. Inflorescences were count- ed in July 1999 on all plants defoliated ear- lier in May and of all plants marked for defoliation in September. In addition, inflo- rescences were counted on all non-etiolated plants in July 2000. Plant heights were measured at the same time as tiller counts were undertaken on all undefoliated plants in 1999 (i.e., September) to assess the effect of burning alone, and of all plants in 2000. Plant height was measured as the average extended length of tillers.
Maximum above-ground net primary pro- duction (ANPP) was harvested near ground level on 30 September, 2000, oven-dried, and weighed. Average tiller weights (mg
tiller') were determined for each plant using ANPP and tiller count data.
Table 1. Winter (January to March, November to December), monthly growing season, and 40-year average precipitation on the Fescue Prairie AAFC sub-station near Stavely, Alberta, from 1997 to 2000.
Year Jan-Mar April July Aug. Sept. Oct. Nov-Dec Total
1997 21.9 21.4 138 73.1 28 77 34.9 0.2 4.9 399.4
1998 47.5 27.9 169.6 186.9 129.7 16.2 25.3 12.5 31.9 647.5
1999 10.9 66.21 71.6 109 53.9 50.3 15.6 8.6 12.6 398.7
2000 23 27 16.6 66.2 13.1 48.1 59.9 1.6 8 263.5
40-yr
average 76.22 27.22 61.8 84.1 56.1 56.8 40.8 22.6 44.82 444.32
Indicates time of wildfire, -- 7 April 1999.
ZData from the Claresholm Meadows Creek, Alberta climate station, 1961-1990 (Environment Canada 1998).
376 JOURNAL OF RANGE MANAGEMENT 56(4) July 2003
Statistical Analyses
All data were analyzed using a split-plot design (Steel et al. 1997). Given the lack of replication of fire, burn treatment was considered the whole plot, with defoliation regimes nested within individual burn treatments. Analysis was done using ANOVA (Proc GLM, SAS Institute Inc.
1991), with an emphasis on defoliation and burn by defoliation effects. Where sig- nificant results were found, comparisons were made among seasons and/or intensi- ties of defoliation within individual burned and non-burned treatments. Fescue plant responses examined included phytomass removed in 1999, ANPP levels and maxi- mum plant height in 2000, as well as tiller and inflorescence numbers in 1999 and 2000. Probability values for the differ- ences of the least-square-means were adjusted for multiple comparisons accord- ing to Tukey's procedure. Inflorescence numbers were analyzed as percent of total tillers to adjust for unequal tiller numbers per plant. Tiller count and weight data were normalized using a square root trans- formation to meet the conditions of nor- mality based on the Shapiro-Wilk statistic and homogeneity of variance based on Levene's test (Steel et al. 1997).
To evaluate changes in tiller demo- graphics, the percentage change in tiller numbers per plant was analyzed using a repeated measures multivariate analysis of variance (MANOVA, SAS Institute Inc.
1991). This procedure tested for the pat- tern of correlation between treatment effects and seasonal changes in rough fes- cue tiller numbers based on sequential sampling from September 1999 through May, July, and September of 2000. The process of evaluating percent changes in tiller numbers through time also circum- vented the problem that initial, pre-wild- fire tiller counts were not available for use as a covariate. Data on percent change in tillers per plant were also normalized using a square root transformation.
Results First-Year Effects
Phytomass yields in the first growing season after burning (1999) were partly an artifact of the nature of the harvesting treatments and did not reflect a plant response to clipping (Tables 2 and 3).
Nevertheless, the observations provide an opportunity to compare growth and associ- ated opportunities for livestock grazing, as
defined by the harvest date, between burned and non-burned plants when cut at
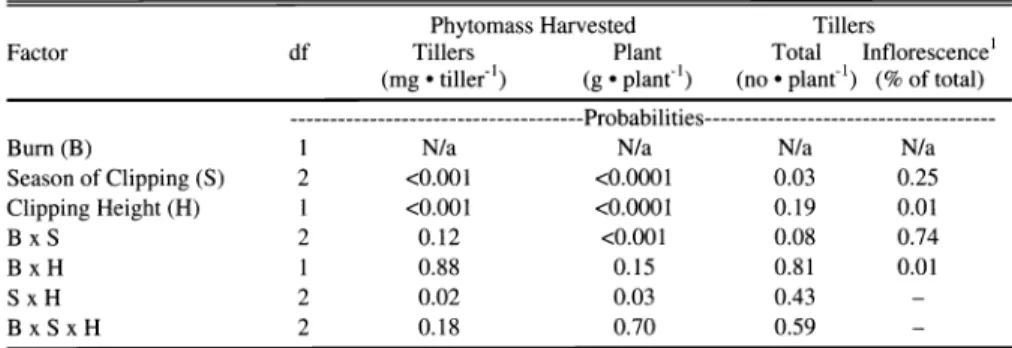
Table 2. Interactive effects of spring wildfire, season of clipping, and clipping height on plant and tiller characteristics of Festuca campestris plants (n = 10) in September 1999. Analysis of phy- tomass harvested and tiller numbers performed on square root transformed data.
Factor
Burn (B)
Season of Clipping (S) Clipping Height (H)
BxS BxH SxH BxSxH
Phytomass Harvested Tillers
df Tillers Plant Total Inflorescence'
(mg tiller') (g plant') (no plant') (% of total) ---Probabilities---
1 N/a N/a N/a N/a
2 <0.001 <0.0001 0.03 0.25
1 <0.001 <0.0001 0.19 0.01
2 0.12 <0.001 0.08 0.74
1 0.88 0.15 0.81 0.01
2 0.02 0.03 0.43 -
2 0.18 0.70 0.59 -
Analysis of % reproductive tillers per plant is based only on spring defoliated and non-defoliated plants due to interfer- ence of July clipping with inflorescence production (d.f. =1 for all variables tested).
the same stubble height. Burned plants had tiller and plant phytomass levels that were 69 and 51% lower, respectively, than non- burned plants (Table 3). Burned plants also exhibited a marked reduction in spring growth leading to a burn by season interaction (P < 0.001), which was reflect- ed in lower herbage yields throughout the year. For example, burned plants harvest- ed in May and September yielded only 4 and 41% the phytomass of their non- burned counterparts, respectively (Table 3). As expected, defoliation later into the year increased harvested yields (P <
0.001), particularly at the 5-cm clipping height (Table 3).
The reduction of plant and tiller phy- tomass after burning was associated with a
reduction in plant height by September 1999, from an average of 54 (±5) to 25 (±4) cm. Although burning had little effect on tiller numbers at the end of the first growing season, tillering was significantly altered by the phenological stage when defoliation occurred (P = 0.03). Tiller counts taken in September indicated that plants harvested in May (active vegetative growth), July (inflorescence develop- ment), and September (dormancy) had an average of 120, 98, and 128 tillers, respec- tively, with burned and non-burned plants responding in a similar manner (P = 0.08).
In 1999, inflorescence production was also affected by a burn by clipping height interaction (P = 0.01). Burned plants pro- duced few seedheads regardless of clip- Table 3. Phytomass harvested at 3 dates and 2 stubble heights from burned and non-burned Festuca campestris plants (n = 10) during the first growing season (1999) after spring wildfire.
Results of ANOVA are given in Table 2.
Treatment Tiller Phytomass Plant Phytomass
Burn x Season of Clipping (mg tillef') (g plan
Burn
May 6.4
July 23.5 2.9 b
Sept 61.7 5.3 a
Pooled Mean 30.6 2.9
Non-burned
May 99.1 b
July 82.4 10.7 ab
Sept 115.8 13.0 a
Pooled Mean 99.1 10.9
Interaction SE mean 10.2 0.9
Clipping Height x Season of Clipping 5-cm
May b2
July 67.2b 8.8b
Sept 128.1 a 12.9 a
15-cm
May 38.4 a 3.7b
July 38.6 a 4.8a
Sept 49.4 a 5.4a
Interaction SE mean 10.2 0.9
h a column and bum treatment, means followed by the same letter do not differ significantly (P > 0.05).
2Within a column and clipping height, means followed by the same letter do not differ significantly (P > 0.05)
JOURNAL OF RANGE MANAGEMENT 56(4) July 2003 377
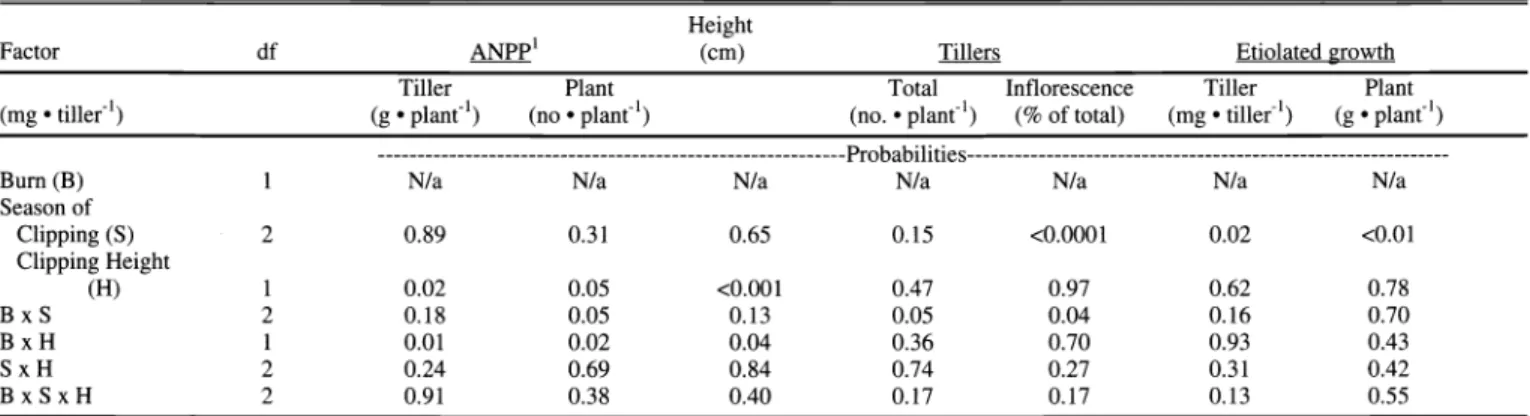
Table 4. Interactive effects of burning, season of clipping, and clipping height on plant and tiller characteristics of Festuca campestris in September 2000 following exposure to spring wildfire and subsequent defoliation in 1999 (n = 8, except for etiolated growth, where n = 2). Analysis for tillers and ANPP performed on square root transformed data.
Height
Factor df ANPP' (cm) Tillers Etiolated growth
Tiller Plant Total Inflorescence Tiller Plant
(mg tiller') (g plant 1) (no plant 1) (no. plant 1) (% of total) (mg tiller') (g plant') ---Probabilities--- Burn (B)
Season of
1 N/a N/a N/a N/a N/a N/a N/a
Clipping (5) 2 0.89 0.31 0.65 0.15 <0.0001 0.02 <0.01
Clipping Height
(H) 1 0.02
BxS 2 0.18
B x H 1 0.01
S x H 2 0.24
BxSxH 2 0.91
Aboveground net primary production.
ping height (< 0.11% of tillers), while plants not exposed to fire but clipped at 5 and 15-cm stubble heights had 0.43 and 1.76% of their tillers produce an inflores- cence, respectively.
Second-Year Effects
Responses in 2000 represented residual effects of defoliation in 1999 (Table 4). In 2000, burned plants continued to have lower tiller and plant yields (i.e. ANPP) compared to non-burned plants, by 69 and 51 %, respectively (Table 5). The observed reduction in plant ANPP in September of 2000 with burning coincided with a contin- ued reduction in plant height (58% of non- burned; Table 5) and tillers that weighed 32% that of non-burned tillers (Table 5).
Burned plants remained about 60% the height of non-burned plants throughout the summer of 2000 (data not shown).
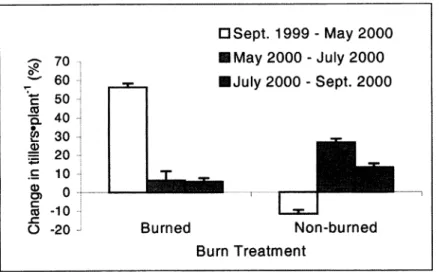
In contrast to these results, burned fescue plants had greater tiller numbers (203 tillers plant-') compared to those not exposed to fire (132 tillers plant'). While the increase in tillers within burned plants occurred primari- ly before May 2000 (Fig. 1), tiller emer- gence in non-burned plants was most abun- dant between May and July of 2000.
Plants defoliated to a 5-cm height in 1999 had reduced tiller (P = 0.02) and plant ANPP (P = 0.05), as well as plant height (P < 0.001) in 2000. These effects, however, were confined to non-burned plants (P < 0.05, Table 5), suggesting burning reduced the impact of the inten- sive clipping treatment.
Variation in the response of plants to different seasons of clipping was also evi- dent within the burn treatments (P = 0.05).
Examination of these data indicated ANPP levels were stable among non-burned plants defoliated at different times the year before (Table 5). In contrast, defoliation of burned plants in July resulted in the lowest
0.05 <0.001 0.47
0.05 0.13 0.05
0.02 0.04 0.36
0.69 0.84 0.74
0.38 0.40 0.17
plant ANPP the following year, although post-hoc mean comparisons revealed no significant difference (at P = 0.05). Year- end tiller numbers in 2000 also varied among the seasonal defoliation treatments within the burned and non-burned plants (P = 0.05). Defoliation of non-burned plants prior to September 1999 stimulated tillering the following year (140, 140, and 118 tillers planr1, with May, July, and September defoliation, respectively), but depressed tillering if applied in July to burned plants (234, 168, and 207 tillers plant-', with May, July, and September defoliation, respectively). Tiller numbers
0.97 0.62 0.78
0.04 0.16 0.70
0.70 0.93 0.43
0.27 0.31 0.42
0.17 0.13 0.55
within burned and non-burned plants defo- liated in September were also similar to the non-defoliated controls for both burned (207 vs 195, respectively) and non- burned (118 vs 114, respectively) plants.
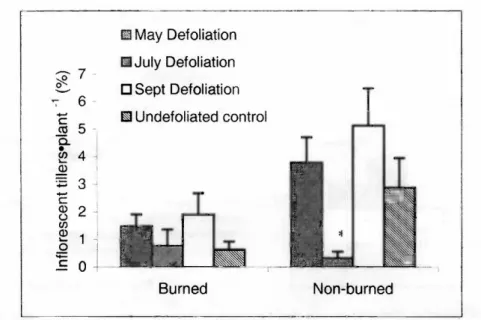
Additional effects were observed of burning and defoliation season on inflores- cence production (P = 0.04) in 2000.
Defoliation in July resulted in the greatest reduction of inflorescences (Fig. 2), but was most apparent within non-burned plants. Notably, inflorescence production also appeared to increase within the September defoliated plants in both burned and non-burned plants relative to the unde- Table 5. Effects of different clipping heights and seasons of defoliation on the mean height and ANPP of burned and non-burned rough fescue plants (n = 8), as measured in September 2000 following spring wildfire and defoliation in 1999. ANOVA results are given in Table 4.
Treatment Plant Height Tiller ANPP' ANPP'
(cm) (mg ' tiller') (g . planf')
Burn x Clipping Height Burned
5-cm a2
15-cm 26a 43a
Undefoliated 23 46
Pooled Mean 25 44
Non-burned
5-cm 39 b
15-cm 46a 153a
Undefoliated 46 172
Pooled Mean 43 143
Interaction SE 1 0.6
Burn x Season of Clipping Burned
May a
July 23 38 a3
September 22 45
Non-burned
May 38 a
July 43 144 a
September 39 137 a
Interaction SE 1 0.8
Aboveground net primary production.
3Within a column and bum treatment, means followed by the same letter do not differ significantly (P > 0.05).
Burned July plant ANPP differs from May (0.05 < P < 0.10).
378 JOURNAL OF RANGE MANAGEMENT 56(4) July 2003
70 60 50 40 30
j 20 10
ro -10 U -20
D Sept.1999 - May 2000 May 2000 - July 2000 July 2000 - Sept. 2000
Burned Non-burned
Burn Treatment
Fig, 1. Seasonal changes in tiller numbers (±SE) from September 1999 to September 2000 on burned and non-burned plants following a spring wildfire in 1999 (n = 8). Changes in tiller number were affected (P < 0.0001) by the measurement interval and the burning treat- ment as evaluated by multivariate analysis of variance for repeated measures.
foliated controls (Fig. 2). In contrast, clip- ping intensity had no effect (P > 0.05) on inflorescence production (Table 4).
Finally, burned plants had 44% less eti- olated growth of tillers compared to non- burned plants (Table 6), and May defolia- tion the previous year resulted in signifi- cantly less (P < 0.05) etiolated growth at both the tiller and plant level (Table 6).
The effect of defoliation intensity and sea- son, however, were similar (P > 0.05) between burned and non-burned plants.
Discussion Response to Burning
Foothills rough fescue plants had reduced yields the first and second grow- ing seasons after spring burning, which is comparable to Redmann et al. (1993) and Gerling et al. (1995) for plains rough fes- cue. The yield reductions in the present study were related to burning resulting in shorter, lighter tillers, and occurred despite a 50% increase in tiller numbers in burned plants during the second year. These results indicate that tiller recruitment by burning could not compensate for
depressed tiller weights over the 2 years of monitoring conducted here. This pattern may be related to re-allocation of limited plant resources such as carbohydrates to a greater number of tillers, particularly as they become larger with age throughout the growing season, post-burn conditions related to litter removal (Redmann 1978, Savage 1980) and precipitation.
Precipitation during the first growing season after fire was near average, howev- er, precipitation to the end of the second growing season was only about 54% of the long-term average (Table 1). Reduced pre- cipitation may have limited plant growth in the second year. Given the loss of litter with burning and its importance for growth (Willms et al. 1986), moisture deficits were also likely exacerbated by the fire.
Although burning decreased plant ANPP, height and inflorescence produc- tion, suggesting a negative response to burning, a more reliable indicator of plant response may be tiller numbers as it repre- sents longer-term productive potential.
Using tiller numbers as a standard, burn- ing may have improved plant vigor by stimulating tillering, thereby supporting the notion that rough fescue is both adapt- ed to, and the beneficiary of, fire.
Coincident changes in etiolated growth, however, showed no effect (P > 0.05) of burning on the plant but a reduction for individual tillers (Table 6). Etiolated
growth is positively correlated with carbo- hydrate levels in the roots and crowns of grasses (Raese and Decker 1966, Dorvat et al. 1972). The reduction in energy at the tiller level in burned plants suggests some susceptibility to further damage should tiller development be impeded. Burning foothills rough fescue has been shown to increase individual plant production 3 years after wildfire, but increased plant mortality of burned plants resulted in lower total fescue production compared to non-burned areas (Antos et al. 1983).
Therefore, enhanced tiller numbers fol- lowing burning are likely to benefit future production only when plant mortality is limited. No mortality was documented in the current study.
Although the results here focus on rough fescue plants, their response is not neces- sarily indicative of the entire grassland because the reproductive capacity of many plant species are uniquely adapted to fill- ing ecological niches in the post-fire envi- ronment. Increased forb biomass after a late winter wildfire helped compensate for a reduction in grass production by the sec- ond year after burning in a grassland simi- lar to the present study (Bork et al. 2002).
Response to Post-Burn Defoliation Given that post-burn grazing of regrowth by wildlife was likely common prior to European settlement, the postula- tion might be made that rough fescue can
tolerate this pattern of disturbance.
However, the decision to graze with live- stock in the year after burning might be based as much on the benefits to animals as on the effect to the plant. By May, the time when grazing normally begins on Fescue Prairie, burned plants had pro- duced only 5% the biomass of non-burned plants, which subsequently increased to only 40% by September. Thus, available forage for grazing declined markedly with burning.
Results indicate that clipping of burned plants in early spring did not produce a cumulative negative effect on plant recov- ery. Burning appeared to increase plant resilience to post-burn harvesting by slow- ing growth and minimizing exposure of regrowth to defoliation. Nevertheless, plant energy reserves were lowest in Table 6. Effects of spring wildfire and subse- quent date of defoliation in 1999 on the ANPPI of etiolated tillers and plants in May 2000.
Plant Treatment Tiller
(mg tiller) (g . plant 1)
Burn Treatment (n =12)
Burned 9.0 1.6
Non-burned 16.2 1.8
SE mean
Season of Clipping (n = 8) 1.8
May 7.4b2 1.2b
July 14.0 ab 1.5 ab
September 16.3 a 2.5 a
SE mean Undefoliated Control
2.2
(n =4) 16.3 1.5
A ob veground net primary production.
2Within a column and burn treatment, means followed by the same letter do not differ significantly (P > 0.05).
JOURNAL OF RANGE MANAGEMENT 56(4) July 2003 379