Munich Personal RePEc Archive
Does Size influence Jail Efficiency?: A
Metafrontier analyisis of local Jails in the
United States
Alda, Erik
American University
28 January 2019
Online at
https://mpra.ub.uni-muenchen.de/92120/
Does Size influence Jail Efficiency?: A Metafrontier
analysis of local Jails in the United States
Erik Alda, PhD
11
Faculty Fellow, Department of Justice, Law and Criminology,
Abstract
This study examines the efficiency of local jails for the year 2016. It employs a well-known non-parametric methodology (DEA) with
metafrontiers. Metafrontiers envelop separate groups that have similar production technologies and therefore allows for more accurate efficiency estimates. Using an input-oriented model with variable returns to scale, the results of this study suggest that, on average, jails could reduce or reallocate their inputs by 37% given their output level. Also, there are differences in efficiency between groups that operate on different production technologies. The group of small jails appears to operate more efficiently than the groups of large and mega-large jails. From a managerial perspective, this study presents evidence that jail managers need to assess more carefully how they allocate human and financial resources to try to improve operational
efficiency. From a policy perspective, the results indicate that there is room for cost-saving approaches to maximize taxpayer dollars.
1
Introduction
On any given day, there are around 700,000 people incarcerated in local jails in the United States. Since the year 2000 there has been a steady growth of jail
population throughout the United States to reach its peak in 2010. Since 2010 the jail population has experienced a slow but steady decline at an average of 1% per year (Henrichson, Rinaldi & Delaney, 2015). This decline, however, has been largely driven by large jails while the jail population continues to grow by more than 50% in rural jails and by 40% in small, and midsize jails (Kang-Brown & Subramanian, 2017; Lu, 2017).
The size of the jail population in the US, however, is still very large and absorbs a significant share of local government resources, which has sparked the interest of the academic and policy fields to try to devise ways to improve jail efficiency and prevent it from bulging further. Various reasons that support the need to devise ways to improve jail efficiency.
The first one relates to whether tax dollars are spent optimally. A recent study indicates that local governments spent $22.2 billion in jails in 2011 (Kyckelhahn, 2013), which appears to underestimate local costs. This is a four-fold increase in costs compared to what was spent in the 1980s (Henrichson et al., 2015). The resources allocated to jails, while necessary to ensure that they function properly and meet required standards of safety, security, and fair and humane treatment of inmates1
, are also drawn from the same general budget that goes to fund hospitals, schools, and other critical social services (Henrichson et al., 2015). Therefore, as the jail population continues to grow, so will the amount of resources allocated to jails, which in turn will affect budgetary allocations to other sectors.
Another important reason, and also related to the above, is that given the number of resources spent on jails every year, the measurement of jail performance is still limited. Other than partial performance metrics, there have been few efforts to assess the efficiency of correctional systems2
. Furthermore, available studies have
1
ACA stands for American Correctional Association. This association published operational standards to enhance the correct functioning of corrections systems in the US so that it ultimately benefits inmates, correctional staff, administrators and the public.
2
not taken into account the differences that may exist between corrections systems that operate under different production technologies, which will lead to biased efficiency estimates.
Finally, having a better understanding of how efficient jails can assist jail managers to make informed decisions on how to improve human resource and budgetary allocations to enhance jail performance.
Within this context, this study examines the efficiency of jails in the United States (US) using a metafrontier efficiency analysis (Battese & Rao, 2002; Battese, Rao & O’Donnell, 2004; O’Donnell, Rao & Battese, 2008). This approach differs from prior research on corrections systems in that the efficiency analysis is based on the comparison of jails that operate under similar production technologies.
The empirical analysis begins by estimating the efficiency scores for all the jails in the sample using an input-oriented model with variable returns to scale. The study then estimates the efficiency of jails for each group-the sample is divided into four different groups based on their official rated capacity– so each jail is compared with other jails that operate under a similar technology. Finally, the study estimates the technology gap ratios, which measures the distance between the group frontier and the metafrontier.
The results indicate that the mean efficiency score for the metafrontier was 0.63 for the input-oriented metafrontier model. These results suggest substantial
improvement in terms of their efficiency, which could be addressed by reducing or reallocating inputs given the current output. The analysis of the technological gap ratios indicate that the mean scores were 0.83, which suggest that, on average, the potential input reduction is 83% of the "best practice" defined by the metafrontier.
This study contributes to the limited but growing literature on corrections systems efficiency. Although prior research has assessed the efficiency of corrections
new insights on how jails in the US could improve their efficiency by comparing sets of jails that operate under the same production technology and, thus, providing more accurate efficiency estimates.
The remainder of this paper is organized as follows. Section 2 provides a review of the literature on corrections systems efficiency. Section 3 discusses the empirical approach to measuring efficiency using non-parametric methodologies with
metafrontiers and describes the data used in this analysis. Section 4 describes and presents the findings including metafrontier efficiency scores, group efficiency scores, and technology gap ratios. Finally, Section 5 discusses the findings and presents the conclusions and limitations.
2
Literature Review
The measurement of jail efficiency is a long-standing issue for jail managers, policymakers, and scholars. Despite the growing interest in improving corrections efficiency so that there is an optimal use of taxpayer dollars, there are only eight available studies that assess corrections efficiency using methodologies that have been validated extensively. Four of these studies have used non-parametric approaches like Data Envelopment Analysis (DEA) and four studies have used parametric approaches such as Stochastic Frontier Analysis (SFA) and linear regression models.
Ganley and Cubbin (1992) was the first study to use non-parametric methodologies to measure the efficiency of 33 local prisons and remand centers in the UK in the 1980s. Their study found an average technical efficiency score of 0.88 and the authors indicated that the primary source of inefficiency was the excess number of staff in the prisons, which translated into higher operational costs that could be reduced if inefficient units improve their levels of efficiency relative to the best performers.
non-parametric frontier methodologies to measure efficiency of correctional systems compared to, for example, basic ratio analysis or regression analysis. The second objective was to demonstrate the usefulness of this methodology by presenting the results of their efficiency analysis, including an analysis of slacks3
and offer insights on how inefficient units could adjust their inputs/outputs to achieve efficiency.
Nyhan (2002) also employed a non-parametric approach to examine the
performance of juvenile halfway house facilities in the state of Florida. Nyhan’s approach differed from previous studies in that the author used non-discretionary inputs4
in one of the models and outputs related to efficiency, quality, and
effectiveness of correction systems. The use of outputs related to quality of service and effectiveness is troublesome because, from a pure production performance measurement, they do not capture a direct output or approximate the outputs produced by a correctional system. This approach also underscores the challenges of identifying outputs in correctional systems. The results indicated that there was significant variation in the levels of performance among juvenile facilities. The mean efficiency score of 0.68 for the model without non-discretionary inputs and 0.78 for the model with non-discretionary inputs.
Simões and Cunha Marques (2009) examined both the performance and the levels of congestion of 47 prison facilities in Portugal. They use a traditional DEA model with input orientation and a model to examine prison congestion (Tone & Sahoo, 2004). Their empirical strategy estimated constant (CRS) and variable returns to scale (VRS) to estimate scale efficiency (SE)5
. The results indicate that the mean efficiency score ranged from 0.62 (CRS), 0.78 (VRS) to 0.79 (SE). Finally, their analysis of congestion indicated that 60% of prison facilities in Portugal show congestion inefficiencies.
Studies employing parametric approaches to measuring efficiency have relied on linear regression models and stochastic frontier models (SFA).
One of the earliest studies by Trumbull and Witte (1981) examined a cost function
3
Slacks are the additional improvement needed by an inefficient unit to achieve efficiency. This could be done by either decreasing outputs and/or increasing inputs.
4
Non-discretionary inputs are those inputs that cannot be controlled by the prison managers.
5
using a linear regression model for 6 federal corrections institutions in the US between 1976 and 1978. They argue that smaller and larger prisons will have higher costs when other factors remain unchanged. Furthermore, they estimate that the minimum daily cost per inmate size of a jail ranged between 1000 to 1600 inmates; but there would be substantial cost penalties for standard jail sizes of 500 that was advocated at the time by the Accreditation Commission.
Panci (1999) examined a production function and a cost function for 107 prisons in Italy in 1996. The study found that there existed economies of scale for those jails are smaller than the sample average. In addition, the study found that the mean technical inefficiency was 8% for the production function model and 14% for the cost model. Finally, the results indicate that controlling for other factors in the model, there appears to be an issue of excess labor in prisons located in Southern Italy compared to those prisons in the North.
Gyimah-Brembong (2000) examined the efficiency of a four-year panel of 45 Florida prisons using a cost-function model, which included exogenous variables that affect prison efficiency in addition to prison inputs. The author found that the average efficiency score of 86%. However, it has been argued that his estimates may be inconsistent given the small sample size and the use of too many external ’control’ variables (Cesaroni and Lamberti, 2014).
More recently, Balassone et al. (2008) examined the efficiency of 142 prisons in Italy for the 2003-2005 period using a stochastic cost frontier model. The authors were interested in estimating the sources of inefficiency related to the operating costs of the prison system. The study found that Italian prisons spend 2.5 times of what they should and that leads to operational inefficiency. Moreover, the main source of inefficiency was due to overstaffing, which is a common driver of inefficiency in this field (Simões & Cunha Marques, 2009).
Finally, Cesaroni and Lamberti (2014) examined the efficiency of Italian prisons over the 2003-2005 period by comparing the estimates of parametric and
higher number of inmates will likely drive up costs because it will require a higher number of officers. However, if officers and other inputs are not allocated efficiently, it will ultimately lead to inefficiency. Finally, from a methodological point of view, the authors argue that non-parametric methods like DEA are more adequate to estimate the efficiency of complex production technologies like those of prisons.
One common thread across the literature on correctional systems efficiency is that one of the chief sources of inefficiency is excess of staff and, in particular, excess of correctional officers. At the same time, the available literature underscores the usefulness of benchmarking techniques like DEA and SFA are useful in ascertaining the sources of inefficiency and can provide managers and policymakers with tools to improve the operational efficiency of these systems.
3
Empirical Strategy
3.1
Data Envelopment Analysis-DEA
This study employs a non-parametric efficiency measurement approach, Data Envelopment Analysis (DEA), to estimate the technical efficiency of jails in the US. DEA is a powerful linear programming technique that uses the linear combination of DMU’s6
that employ a set of inputs and outputs to generate a "best practice frontier". The "best practice frontier" captures the firm/s production of maximum output/s given a set of inputs relative to their peers in the sample (Charnes, Cooper, & Rhodes, 1978). Therefore, a DMU that is on the "best practice"7
frontier indicates that, relative to its comparators, this unit has produced more output using the same amount of inputs and is, therefore, efficient. This interpretation is for an output-oriented model. The interpretation of an input-oriented model is that a DMU is efficient relative to its peers if it produced the same amount of output using the same or fewer inputs.
To estimate the efficiency of jails, this study employs a DEA input-oriented model
6
The DMU (Decision Management Unit) is the unit of analysis. In the case of the current study is local jails.
7
with variable returns to scale (VRS). The use of an input-oriented is primarily a result of the type output that defines a jail production technology since jails are not set up to maximize their output but rather, at the very least, minimize the amount of resources used to maintain the same level of output (Ganley & Cubbin, 1992; Aubyn, 2008). In addition, the choice of an input-oriented model is
appropriate when jails have control over their inputs (i.e. staff, beds, and other inputs employed in jail operations) (Chen, K. C., Chien, Hsu, & Yu,2016).
Finally, the choice of variable returns to scale is also straightforward since an additional input would not result in a proportional change of the output as is the case with constant returns to scale models because jails generally operate in a non-market environment with imperfect competition and budgetary constraints (Jacobs, Smith & Street, 2006; Giménez, Keith & Prior, 2019). This often leads jails to operate at an inefficient scale size. The author also conducted a
non-parametric returns to scale test (Simar & Wilson, 2002) to support (or reject) the previous assumption to choose a VRS model. The results rejected the null hypothesis (p<.01) that jails operate at an efficient scale8 and thus, a variable
returns to scale model is appropriate.
θ∗=min θ
subject to
∑nj=1λjxij ⩽θxio i=1,2, ..., m;
∑nj=1λjyrj ⩾yro r=1,2, ..., s;
∑nj=1λj =1
λj ⩾0 j =1,2, ..., n.
(1)
whereDM Uo represents a DMU under analysis, and xio and yro are the ith input
and rth output for DM Uo. The objective of an input-oriented model is to estimate
whether the jail under analysis can produce the same level of output with the least amount of inputs compared to its peers.
8
The value ofθ ranges from 0 (most inefficient) to 1 (efficient) Hence, in an
input-oriented model, a value of 1-θ indicates the proportional radial contraction in inputs that a DMU could achieve given the output level.
3.2
DEA Metafrontier
As noted earlier, because DEA measures the efficiency of DMU’s operating under a similar production technology–they are considered homogeneous units–, when DMU’s operate under different production technologies it may lead to inaccurate efficiency estimates (O’Donnell, Battese & Rao, 2008).
[image:11.612.189.428.388.540.2]To prevent biased efficiency estimates, Battese and Rao (2002), developed a metafrontier approach to account for these differences in production technologies among units. This new approach estimates efficiency with respect to a metafrontier (all jails in the sample) and with respect to a group frontier of homogeneous units, that is, jails that operate under the same production technology.
Figure 1: Illustration of Metafrontiers
Source: Battese & Rao (2002).
Figure 1 illustrates the concept of metafrontier in efficiency analysis. The isoquant
M M′ illustrates the metafrontier which envelops the group frontiers (11′,22′, and
33′). The group frontiers denote each of the sub-groups in the sample that operate
under different production technologies.
amount of workload in the court system, socioeconomic and demographic
[image:12.612.178.436.175.393.2]characteristics, actual rated jail capacity, among others. All these factors can be used to define a production technology for the jail. Figure 2 shows the complexity and the many factors that drive jail populations.
Figure 2: Flow of Factors that Produce Jail Population
Source: Austin(2012).
In this study, the jails in the sample are divided into four different groups according to jail capacity and, therefore, the efficiency estimates would be based on jails with a similar number of beds. (see Table 1) (Cornelius, 2012). The author opted for the jail capacity as the factor to define the production technology because, from an efficiency point of view, the maximum allowed capacity can help estimate more accurately how well (or poorly) a jail will operate. For example, large jails have larger capacity, more resources, and, as a result, more output than smaller jails. In other words, larger jails operate on a different production technology than smaller jails and, as a result, comparing these two groups under the same efficiency frontier would lead to biased efficiency estimates.
and being jailed. Therefore, using this variable to define the production technology of jails would likely lead to biased efficiency estimates.
Table 1: Jail Groups
Capacity Number of Jails
Small Jails - 1 to 50 Beds 30 Mid-size Jails - 50 to 250 Beds 192 Large Jails - 250 to 1000 Beds 324 Mega Jails ->1000 Beds 178
Source: Bureau of Justice Statistics (2016) based on the definition of the American Jail
Association (n.d).
3.2.1 Technical Efficiency and Technological Ratios
To estimate the metafrontier efficiency, it requires solving to separate models using equation (1). The first step estimates the efficiency frontier for each of the regional groups (see Figure2). The second step estimates the efficiency frontier for the whole sample. This metafrontier envelops the four groups in our analysis and it can be decomposed into:
• Metafrontier technical efficiency T Ek: This component captures the efficiency of all the jails under one efficiency frontier.
• Group technical efficiency T Eg: This component captures the efficiency frontier of each group in the sample.
The ratio between T Ek and T Eg is defined as technological gap ratio (T GR) or
meta-technology ratio (Chebile et al, 2016; Rao et al, 2003) and measures the technological gap between the group and the metafrontier and represents the restrictive nature of the production environment in which jails operate. Going back to figure 1 above,T Ek captures the efficiency of all the DMU’s underM M′
whereasT Eg captures the efficiency for each of the DMU’s under the groups 11′,
22′, and 33′. For example, DMU A in figure 1 is said to be technically inefficient
frontier is 0C
0D and the T E
k with respect to the meta-technology is 0C
0F. As a result,
the technological gap ratio or TGR for the DMU under analysis is 0D
0F. The T GR
should have values between 0 and 1 and the distance to the frontier9
is the percentage of potential output that can be achieved by the group and this improvement is defined by the metafrontier (Tunca & Yesilyurt, 2016).
To illustrate this with an example, consider a jail i in a group g. The efficiency score with respect to its group frontier (T Eg) is 0.7 and the efficiency score with
respect to the metafrontier (T Ek) is 0.8. The T GR score =0.7/0.8=0.875.
The interpretation of the scores is as follows. A score of 0.7 indicates that, relative to its group peers, jaili can maximize its output production by 30% relative to its group peers. The score of 0.875 indicates that the potential output for jaili is 87.5% of the metafrontier. In other words, this group could improve its output production by 12.5%.
3.3
Data
This study employs data collected and published by the Bureau of Justice Statistics (BJS) annual survey10
on jail populations in 201611
. The data reported in the survey was collected in 2015. (Bureau of Justice Statistics, 2016). The original sample of jails was 910 jails but because frontier methodologies like DEA are very sensitive to missing values and values equal to 012
, the author pre-processed the data to drop jails that had either missing observations or values of 0. The final sample was 724 jails in 45 out of the 50 states in the US.
Defining outputs of prisons is especially challenging (Ganley & Cubbin, 1992). This task is more challenging in a jail system because of its operational nature. One of the main differences between jails and prisons is the length of stay. Whereas jail
9
The distance of the unit to the frontier measures the percentage of output maximization of the unit to become efficient.
10
The Annual Jail survey collects data from a nationally representative sample of local jails on jail inmate populations, jail capacity, and related information
11
Bureau of Justice Statistics
12
inmates stay from a few days to13
to less than one year if the inmate is sentenced in jail. In contrast, prison inmates are already sentenced and, thus, the amount of time that the inmate will spend in prison is known and will be lengthier than in a jail where there is a higher population turnover14
. For example, the estimated average turnover rate15
for jails in 2015 was 71%. In this regard, this study follows previous literature and approximates jail output using the total number of inmates by disaggregating the total number of inmates by convicted inmates 16
and unconvicted inmates (pre-trial detainees).
The outputs used in this study differ from prior research. For example, the inmate total population output measure was not disaggregated by inmate
conviction–convicted or unconvicted (see Butler & Johnson, 1997; Marques & Simões, 2009). Similar to this study, Ganley and Cubbin (1992) disaggregated prisoner data by type of sentencing in addition to the number of punished offenses within the jail. Making this distinction in the output measures is more evident in jails where most of the inmate population is in pre-trial status compared to prisons where the inmate population is serving a sentence17
. Also, because there is more variation in the number of unconvicted –due to high turnover– inmates compared to convicted ones and it is thus important to include them as separate outputs in the model.
The inputs included the number of correctional officers, the number of other staff working in the jail, and the official rated capacity, which captures the official number of beds in the jail.
It is worth noting that none of the output measures described above is a ’true’ direct output measure of jails because outputs in these systems depend on external factors like the courts, law enforcement agencies, or socioeconomic factors. Thus,
13
The expected length of stay in 2015 was 41 days and it is calculated by multiplying the average daily population by the number of days in a year divided by the number of annual admissions to the jail.
14
At 12 million admissions per year, jails have almost 20 times more admissions than state and federal prisons combined (Henrichson et al., 2015).
15
This is calculated as the sum of weekly admissions and releases divided by the average daily population in the jail (Bureau of Justice Statistics, 2016).
16
Convicted inmates are those inmates that have been convicted but are awaiting sentence.
17
these outputs should be interpreted as crude proxy measures for the level of jail output.
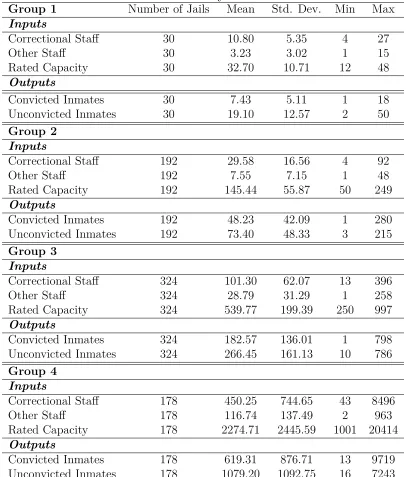
Table 2 presents the summary statistics by jail group. On average, 164 correctional officers, 44 other staff, and 840 beds. As the data show, however, there is
substantial variation in both the capacity and the number of inmates, particularly in the mega-jails (with more than 1,000 beds) when compared to smaller jails. This variation supports the need to run a metafrontier model to prevent biased efficiency estimates that would result when comparing very large jails to smaller ones in the same model.
Before running the DEA metafrontier model, the author mean normalized the data to reduce potential imbalances. This is a normal procedure in DEA analyses ensure that the data is similar across units18
(Sarkis, 2007).
4
Findings
Table 3 presents the results of the analysis for each individual group and the metafrontier. The mean efficiency scores for the groups disaggregated by jail size indicate that jail size appears to be an important factor explaining efficiency. The results show the smaller jails (1 to 50 beds) had higher levels of efficiency than the rest of the jail groups. It appears that mid-size and large jails are, on average, underperforming compared to small and mega large jails. The efficiency scores for mid-size and large jails are 0.75 and 0.72, respectively. These two groups have the greatest potential to reduce inputs while having the same inmate population. By contrast, the mean efficiency score for the group of small jails was 0.91 and for the mega-large jails was 0.82.
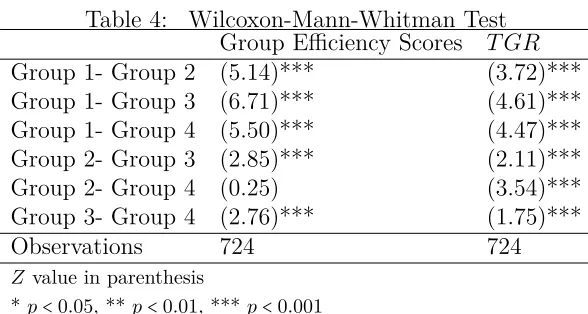
The author performed a Wilcoxon-Mann-Whitney test (Wilcoxon, Katti, & Wilcox, 1970) for each of the group combinations to ascertain if the group efficiency scores are statistically different from each other (see Table 4 below). The results indicate that all but one group comparison are statistically different. Group 2 and group 4 are not statistically different.
18
Table 2:
Summary Statistics
Group 1 Number of Jails Mean Std. Dev. Min Max
Inputs
Correctional Staff 30 10.80 5.35 4 27
Other Staff 30 3.23 3.02 1 15
Rated Capacity 30 32.70 10.71 12 48
Outputs
Convicted Inmates 30 7.43 5.11 1 18
Unconvicted Inmates 30 19.10 12.57 2 50 Group 2
Inputs
Correctional Staff 192 29.58 16.56 4 92
Other Staff 192 7.55 7.15 1 48
Rated Capacity 192 145.44 55.87 50 249
Outputs
Convicted Inmates 192 48.23 42.09 1 280
Unconvicted Inmates 192 73.40 48.33 3 215 Group 3
Inputs
Correctional Staff 324 101.30 62.07 13 396
Other Staff 324 28.79 31.29 1 258
Rated Capacity 324 539.77 199.39 250 997
Outputs
Convicted Inmates 324 182.57 136.01 1 798 Unconvicted Inmates 324 266.45 161.13 10 786 Group 4
Inputs
Correctional Staff 178 450.25 744.65 43 8496
Other Staff 178 116.74 137.49 2 963
Rated Capacity 178 2274.71 2445.59 1001 20414
Outputs
Convicted Inmates 178 619.31 876.71 13 9719 Unconvicted Inmates 178 1079.20 1092.75 16 7243
Table 3: Results
Group Meta Frontier Efficiency Technical Efficiency T GR
Metafrontier (N=724) 0.633 – –
Group 1 (N=30) 0.861 0.916 0.936
Group 2 (N=192) 0.654 0.753 0.869
Group 3 (N=324) 0.597 0.722 0.831
Group 4 (N=178) 0.638 0.827 0.779
Mean Scores – – 0.833
Observations 724 724 724
Own Analysis based on Bureau of Justice Statistics (2016).
Table 4: Wilcoxon-Mann-Whitman Test Group Efficiency Scores T GR
Group 1- Group 2 (5.14)*** (3.72)*** Group 1- Group 3 (6.71)*** (4.61)*** Group 1- Group 4 (5.50)*** (4.47)*** Group 2- Group 3 (2.85)*** (2.11)*** Group 2- Group 4 (0.25) (3.54)*** Group 3- Group 4 (2.76)*** (1.75)***
Observations 724 724
Z value in parenthesis
*p<0.05, **p<0.01, ***p<0.001
[image:18.612.158.452.454.611.2]The mean efficiency score for the metafrontier estimation, which captures the levels of efficiency for the whole sample was 0.63 and ranged from 0.14 to 1. This means that the inefficient jails could reduce their input by 37% relative to their best performing peers in order to become efficient. Only 64 jails were fully efficient (θ = 1) out of 724 jails (around 8% of the sample). The largest proportion of fully efficient jails belongs to the group for mid-size jails with 25 jails followed by the group for small jails with 14, and 13 and 12, respectively.The least efficient group relative to the metafrontier is the group of large jails with a mean score of 0.59, which means that jails in this group have room for substantial improvement.
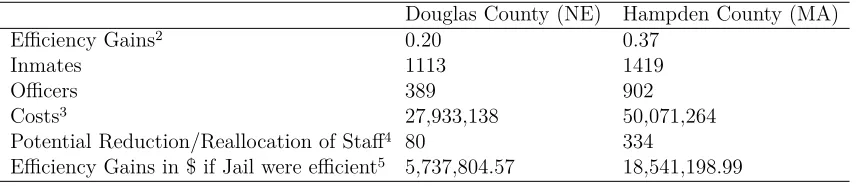
To provide an overly simplistic "back of the envelope" example that illustrates the impact that efficiency gains can have in terms of costs, consider two jails–Douglas County (NE) and Hampden County (MA)– that have similar levels of total
population and jail population. Douglas County (NE) had an estimated population in 2015 of 550,000 inhabitants and a jail population of slightly over 1,100 inmates, and an overall cost of USD37,747,484 million19
according to a recent study (Henrichson et al., 2015). Similarly, Hampden County (MA) had an estimated population of about 470,000 inhabitants and a jail population of slightly over 1,400 inmates, and an overall cost of USD67,663,871 million. The results of this study indicated that the levels of efficiency relative to their group frontier were 0.79 and 0.62, respectively. Taking the average salary for correctional officers and the distance to the efficiency frontier, it is possible to quantify cost-savings if the jails were efficient. The total costs-savings if the jail in Douglas County and Hampden County were efficient would be about USD6 million and USD18 million,
respectively (see Table 5).
After estimating the individual group and metafrontier efficiency scores, the next step involves calculating the technological gap ratios (T GR), which is defined as the uppermost boundary of an unrestricted technology set and envelops all the units in the sample. The results reveal that the mean technology gap ratio ranges from 0.78 for the group of mega-large jails and 0.93 for the group of small jails. In other words, the minimum input bundle is between 7% and 22% of the minimum input bundle needed for a given output level. The Wilcoxon-Mann-White test reveal statistically differences in the T GR between groups (see Table 4).
19
Table 5: Quantification of Efficiency Gains1
Douglas County (NE) Hampden County (MA) Efficiency Gains2
0.20 0.37
Inmates 1113 1419
Officers 389 902
Costs3
27,933,138 50,071,264 Potential Reduction/Reallocation of Staff4
80 334
Efficiency Gains in $ if Jail were efficient5
5,737,804.57 18,541,198.99
1
Data on costs was obtained from Henrichson et al. (2015). Vera Institute of Justice. 2
The distance to the efficiency frontier (1-θ) reflects the efficiency gains. 3
Personnel costs account for 74% of total jail costs (Henrichson et al., 2015). 4
Includes Correctional and Other staff. 5
This calculated by multiplying the row costs by the row efficiency gains.
It is worth noting that the size of theT GR coefficient declines as the size of the jail increases. In effect, there is a negative and statistically significant correlation between jail size and the T GR (p<.01). This suggests that smaller jails operate more efficiently compared to larger jails, which is likely driven by having excess staff in larger jails (correctional officers) given their output level. It is therefore important that jail managers allocate and/or reallocate inputs where there is an operational need and avoid the allocation of staff to housing units where officers are not needed thereby operating at sub-optimal efficiency levels.
5
Conclusions, Limitations and Implications
An overarching motivation to measure jail efficiency is to ascertain the extent to which taxpayer dollars are optimized. Given the large inmate population in local jails in the US, the measurement of efficiency has garnered the interest of
policymakers and practitioners and, to some degree, of researchers. Most of the available research on the efficiency of correctional systems has focused on prisons. However, to date, no studies have examined the efficiency of jails.
The results of this study indicate that there is potential for improvement in terms of efficiency. The mean efficiency score was 0.63, which suggests that, on average, jails could become efficient using 37% fewer inputs given their output level.
Furthermore, it appears that smaller jails operate more efficiently than larger jails and, therefore, are closer to the efficiency metafrontier. The technical efficiency score and theT GR for the group of small jails is larger the rest of the groups in the sample. Furthermore, the differences in the efficiency scores between groups are statistically significant.
A potential explanation of these differences in efficiency scores is that the number of inputs, especially correctional officers, in a jail is generally driven by the number of inmates, which also drives up the overall costs of the jail (Kyckelhahn, 2013). This is why smaller jails appear operate more efficiently than larger jails since the number of inmates is generally low given their limited capacity. The implications inefficiency for larger jails are manifold.
First, larger jails would have an incentive to reduce the number of inmates in order to reduce costs. This reduction, however, requires the involvement of the larger jurisdiction where they jail belongs to since inmates that come to jail do so via police arrests and the court system. Although the reduction in inmates may lead to a reduction in costs (officers and other staff) it may not necessarily lead to an immediate improvement in efficiency. For example, if a jail experiences a significant decline in inmates, it may be forced to reduce its correctional and other staff
because there is no need to have excess staff. However, if the remaining staff are not allocated according to the needs of the housing units, they will likely operate inefficiently.
Secondly, jail managers can use benchmarking techniques like the one presented in this study to establish targets in terms of resource reduction/allocation and
developing strategies to improve overall performance. For example, this analysis may be conducted within the jail at the housing unit level and will provide jail managers with real-time information on what are the drivers of inefficiency and where allocate inputs to improve operational efficiency, which in turn, will be reflected in costs savings for the jail.
Finally, it is important for policymakers to use and understand the gamut of methodologies to measure efficiency so that they can make informed decisions on budgetary allocations that will maximized resource-constrained budgets.
One of the limitations of the study is that there related to the inherent difficulty of defining outputs in jails since the outputs used in previous studies are not produced directly by jails. Further research on this topic should consider identifying outputs that are both a direct product of jail production and also capture the dynamism of jails compared to prisons.
Another limitation is that the current study could not measure the behavior of each group frontier over a period of time. This is particularly interesting since the decline in jail population has been largely driven by large and mega-large jails whereas small and mid-size jails have experienced a significant growth in their inmate population (Kang-Brown & Subramanian, 2017; Lu, 2017). Therefore, conducting temporal analysis would offer important insights to both jail managers and policymakers on whether jail efficiency has improved or worsened as a result of the natural ’churning’ of inmates.
References
American Jail Association (n.d.). Statistics of note.
website:https://members.aja.org/About/StatisticsOfNote.aspx
Aubyn, M. (2008). Law and order efficiency measurement: A literature review. Working paper no. 19, School of Economics and Management, Technical University of Lisbon, Portugal.
Austin, J. (2012). Assessing and Managing yout Jail Population. A Toolkit for Practitioners. The JFA Institute. https://www.ca-ilg.org/sites/main/files/ file-attachments/jailassessmentoolkit10_31_12.pdf
Balassone, F., Camilletti, M., Grembi, V., Zanardi, A. (2008). Evaluating the efficiency of the Italian penitentiary system. Working Paper no. 136, Econpubblica, Centre for Research on the Public Sector, Commercial University Luigi Bocconi.
Battese, G. E., Rao, D. P., & O’Donnell, C. J. (2004). A metafrontier production function for estimation of technical efficiencies and technology gaps for firms operating under different technologies. Journal of Productivity Analysis, 21(1), 91-103.
Battese, G. E., & Rao, D. P. (2002). Technology gap, efficiency, and a stochastic metafrontier function. International Journal of Business and Economics, 1(2), 87.
Bogetoft, P., & Otto, L. (2010). Benchmarking with DEA, SFA, and R (Vol. 157). Springer Science & Business Media.
Bureau of Justice Statistics (2016). Jail inmates in 2016. Bureau of Justice Statistics: Washington, DC, USA.
https://www.bjs.gov/index.cfm?ty=dcdetail&iid=261
Butler, T., Johnson, W. (1997). Efficiency evaluation of Michigan prisons using data envelopment analysis. Criminal Justice Review, 22(1), 1-15.
Cesaroni, G., & Lamberti, A. (2014). Technical efficiency and productivity
Charnes, A., Cooper, W., Rhodes, E. (1978). Measuring the efficiency of decision making units. European Journal of Operational Research, 2(6), 429-444.
Chebil, A., Hashim, A. A., Hassan, A. O., Abdalla, I., Tahir, I., Assefa, S., & Yameogo, O. (2016). Metafrontier analysis of technical efficiency of wheat farms in Sudan. Journal of Agricultural Science, 8(2), 179.
Cornelius, G. F. (2012). Jails: Pretrial detention, and short-term confinement. In Petersilia, J. & K. R. Reitz (Eds.). The Oxford Handbook of Sentencing and Corrections, 389-415. Oxford University Press.
Ganley, J., Cubbin, J. (1992). Public sector efficiency measurement. applications of data envelopment analysis. London: North Holland.
Giménez, V., Keith, J. R., & Prior, D. (2019). Do healthcare financing systems influence hospital efficiency? A metafrontier approach for the case of Mexico. Health Care Management Science, 1-11.
Gyimah-Brembong, K. (2000). Cost efficiency in Florida prisons. In J. Blank (Ed.) Public Provision and Performance, North-Holland, Amsterdam, 221-246.
Henrichson, C. (2015). The price of jails: Measuring the taxpayer cost of local incarceration. Vera Institute of Justice. Jacobs, R., Smith, P. C., & Street, A. (2006). Measuring efficiency in health care: analytic techniques and health policy. Cambridge University Press.
Kang-Brown, J., & Subramanian, R. (2017). Out of sight: The growth of jails in rural America. Vera Institute of Justice.
https://storage.googleapis.com/vera-web-assets/downloads/Publications/ out-of-sight-growth-of-jails-rural-america/legacy_downloads/
out-of-sight-growth-of-jails-rural-america.pdf
Kyckelhahn, T. (2013). Local government corrections expenditures, FY 2005-2011. Washington, DC: Bureau of Justice Statistics, US Department of Justice.
Lu, O. (2017). Large Cities Drive Nationwide Jail Population Decline; Jails in Most Rural Counties Still Growing. In Think Justice Blog. Vera Institute of Justice. https://www.vera.org/blog/
Nyhan, R (2002). Benchmarking tools: an application to juvenile justice facility performance. The Prison Journal, 82(4), 423-439.
O’Donnell, C. J., Rao, D. P., & Battese, G. E. (2008). Metafrontier frameworks for the study of firm-level efficiencies and technology ratios. Empirical economics, 34(2), 231-255.
Panci, A. (1999). Efficienza dell’amministrazione penitenziaria: Parte I. Ministero del Tesoro, del Bilancio e della Programmazione Economica. Commissione Tecnica per la Spesa Pubblica.
Rao, D. S., O’Donnell, C. J., & Battese, G. E. (2003). Metafrontier functions for the study of inter-regional productivity differences (No. Working Paper No. WP01/2003). The University of Queensland School of Economics.
Sarkis, J. (2007). Preparing your data for DEA. In "Modeling data irregularities and structural complexities in data envelopment analysis" (pp. 305-320). Springer, Boston, MA.
Simar, L., & Wilson, P. W. (2002). Non-parametric tests of returns to scale. European Journal of Operational Research, 139(1), 115-132.
Tone, K., & Sahoo, B. K. (2004). Degree of scale economies and congestion: A unified DEA approach. European Journal of Operational Research, 158(3), 755-772.
Tunca, H., & Yesilyurt, F. (2016). Hospital efficiency in Turkey: metafrontier analysis. European Scientific Journal, ESJ, 12(10).
Trumbull, W., Witte, A. (1981). Determinants of the costs of operating large-scale prisons with implications for the costs of correctional standards. Law & Society Review, 16(1), 115-137.